Location via proxy:   [ UP ]  
[Report a bug]   [Manage cookies]                
SlideShare a Scribd company logo
Bank of America
First Quarter 2008 Results

Ken Lewis
Chairman, CEO and President

Joe Price
Chief Financial Officer

April 21, 2008
Forward Looking Statements
    This presentation contains forward-looking statements, including statements about the
    financial conditions, results of operations and earnings outlook of Bank of America
    Corporation. The forward-looking statements involve certain risks and uncertainties. Factors
    that may cause actual results or earnings to differ materially from such forward-looking
    statements include, among others, the following: 1) projected business increases following
    process changes and other investments are lower than expected; 2) competitive pressure
    among financial services companies increases significantly; 3) general economic conditions
    are less favorable than expected; 4) political conditions including the threat of future terrorist
    activity and related actions by the United States abroad may adversely affect the company’s
    businesses and economic conditions as a whole; 5) changes in the interest rate environment
    and market liquidity reduce interest margins, impact funding sources and effect the ability to
    originate and distribute financial products in the primary and secondary markets; 6) changes in
    foreign exchange rates increases exposure; 7) changes in market rates and prices may
    adversely impact the value of financial products; 8) legislation or regulatory environments,
    requirements or changes adversely affect the businesses in which the company is engaged; 9)
    changes in accounting standards, rules or interpretations; 10) litigation liabilities, including
    costs, expenses, settlements and judgments, may adversely affect the company or its
    businesses; 11) mergers and acquisitions and their integration into the company; and 12)
    decisions to downsize, sell or close units or otherwise change the business mix of any of the
    company. Accordingly, readers are cautioned not to place undue reliance on forward-looking
    statements, which speak only as of the date on which they are made. Bank of America does
    not undertake to update forward-looking statements to reflect the impact of circumstances or
    events that arise after the date the forward-looking statements are made. For further
    information regarding Bank of America Corporation, please read the Bank of America reports
    filed with the SEC and available at www.sec.gov.

2
Important Presentation Format Information


    • Certain prior period amounts have been reclassified to conform
      to current period presentation

    • The Corporation reports its Global Consumer & Small Business
      Banking (GCSBB) results, specifically Card Services, on a
      managed basis. Refer to Exhibit A in the Supplemental Package
      for a reconciliation from Managed to Held results


3
1Q08 Summary Items

    • Diluted EPS of $0.23
        – Business growth offset by credit costs and market valuations
        – Merger and restructuring charges - $107 million (after-tax)
    • Visa equity investment gain - $776 million (pre-tax)
    • Net interest income up on higher loan and deposit levels and a steeper yield curve
    • Capital markets valuations
        – CDO and subprime-related exposures - $1.5 billion, net of hedge gains
        – Leveraged lending - $439 million
        – CMBS - $191 million
    • Cost to support funds in 1Q08 - $220 million
    • Provision of $6.0 billion (includes $3.3 billion reserve increase)
    • Noninterest expenses down $1.1 billion from 4Q07 driven by the reversal of 4Q07
      Visa-related costs.


4
1,2
    Consolidated Highlights Adjusted to a Managed Basis

                                                                                                            Increase (decrease) over
        ($ in millions)
                                                                                                          1Q07                     4Q07
                                                                                     1Q08
         Net interest income (FTE)                                                                      $   1,925                $     546
                                                                                   $ 12,381
         Noninterest income                                                                                (2,818)                   3,541
                                                                                       6,338
             Total revenue, net of interest expense (FTE)                                                       (893)                  4,087
                                                                                         18,719
                                          3
                                                                                                               5,063                   2,806
                                                                                          7,426
         Provision for credit losses
         Noninterest expense                                                                                      98                  (1,082)
                                                                                          9,195
             Pre-tax income                                                                                    (6,054)                 2,363
                                                                                          2,098
         Income tax expense (FTE)                                                                              (2,009)                 1,421
                                                                                            888
             Net income                                                                                 $      (4,045)           $       942
                                                                                   $      1,210

         Preferred dividends                                                                            $         144            $        137
                                                                                   $         190
         Diluted EPS                                                                                            (0.93)                   0.18
                                                                                            0.23
         After tax effect of merger charge                                                                         37                      19
                                                                                            107
                           4
         Return on equity                                                                                      (1,318) bps                235 bps
                                                                                            3.20 %
                                   4
         Tangible return on equity                                                                             (2,494)                    475
                                                                                            6.87


    1   Managed basis assumes that loans that have been securitized were not sold and presents earnings on these loans in a manner similar to the way loans that
        have not been sold (i.e., held loans) are presented. Noninterest income, both on a held and managed basis, includes the impact of adjustments to the
        interest-only strip that are recorded in card income.
    2   Represents the Consolidated FTE results plus the loan securitization adjustments, related to Card Services, utilizing actual bond costs. This is different
        from GCSBB which utilizes fund transfer pricing methodology. See Reconciliation of Presented Held to Managed Basis on pages 32-34.
    3   Represents the provision for credit losses on held loans combined with realized credit losses associated with the Card Services securitized loan portfolio.
    4   Measures shown on an operating basis. Please refer to the Supplemental Information Package.
5
Global Consumer & Small Business Banking (GCSBB) – Managed Basis

                                                               Increase (decrease) over
    ($ in millions)                                                                                 1Q08 Highlights:
                                                               1Q07                4Q07
                                              1Q08                                                  • Net Interest Income increased due to an
                                                                                                      increase in average loans and deposits.
    Net interest income (FTE)                              $       680         $       222
                                          $     7,684                                               • Noninterest income growth over 1Q07 reflects
      Card income                                                  344                 100
                                                2,725                                                 good business activity across all products and
      Service charges                                                                                 half of company’s recognized Visa gain.
                                                                   189                 (58)
                                                1,566
      Mortgage banking income                                      354                 166
                                                  656                                               • The increase in provision for credit losses was
      All other income                                                                                driven by ongoing weakness in the housing
                                                                   408                 301
                                                  675
                                                                                                      market and the economy along with seasoning
        Total noninterest income                                  1,295                509
                                                5,622
                                                                                                      of several growth portfolios.
        Total revenue, net of
         interest expense (FTE)                                                                     • Noninterest expense decreased from 4Q07
                                                                  1,975                731
                                               13,306
                                                                                                      due to the reversal of 4Q07 Visa-related costs.
                                  1
    Provision for credit losses                                   4,041              2,149
                                                6,452
                                                                                                    • Average loans and leases increased $55 billion
    Noninterest expense                                            464                (356)
                                                5,139
                                                                                                      from 1Q07, driven by U.S. consumer card,
        Net income                                         $     (1,582)       $      (819)
                                          $     1,090
                                                                                                      unsecured lending, home equity and LaSalle.

    Efficiency ratio                                               (264) bps          (508) bps
                                                38.62 %
                                                 6.64
    Return on equity                                             (1,098)              (466)


       1   Represents the provision for credit losses on held loans combined with realized credit losses associated with the Card Services securitized
           loan portfolio.

6
Global Consumer & Small Business Banking (GCSBB) – Managed Basis
                                                      Revenue of $13.3 billion, 17% over 1Q07
     ($ in millions)
                                                      • Net interest income of $7.7 billion increased 10%
     14,000
                                                                 Deposits grew 5% over 1Q07
                                                             –
     12,000
                                                                 Loan growth of 18% from 1Q07
                                                             –
                 5,622                    5,113
     10,000
                            4,327                                Spreads expanded 13 bps
                                                             –
      8,000
                                                      • Noninterest income of $5.6 billion improved 30%
      6,000
                                                                 Service charge revenue grew 14% due to account growth
                                                             –
      4,000      7,684                    7,462
                            7,004
                                                                 Card income increased due to improved funding costs and
                                                             –
      2,000
                                                                 higher fees
          -
                  1Q08        1Q07         4Q07
                                                      Managed credit costs of $6.5 billion, up $4.0 billion from
                                                       1Q07, and $2.1 billion from 4Q07
        Net interest income    Noninterest income
                                                      • Managed net losses of $3.7 billion in 1Q08
     ($ in millions)
                                                                 Total Corp., home equity net c/o ratio rose to 1.71% from .63% in
                                                             –
     7,000
                                                                 4Q07
     6,000
                                                                 Consumer credit card managed net loss ratio increased to 5.19%
                                                             –
                 2,766
     5,000
                                                                 from 4.75% in 4Q07
     4,000
                                           1,270      • Increased reserves, in GCSBB, $2.8 billion in 1Q08
     3,000
                                                                 $1.4 billion home equity
                                                             –
     2,000       3,686
                                           3,033
                              2,433                              $0.7 billion small business
                                                             –
     1,000
          -                    (22)                              $0.4 billion unsecured lending
                                                             –
     (1,000)                                                     $0.3 billion consumer credit card
                                                             –
                  1Q08        1Q07          4Q07


7             Managed net losses      Reserve build
Global Consumer & Small Business Banking (GCSBB) – Managed Basis
     (units in thousands)
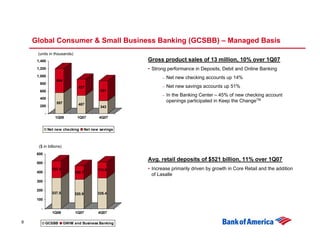
                                                        Gross product sales of 13 million, 10% over 1Q07
     1,400

                                                        • Strong performance in Deposits, Debit and Online Banking
     1,200

     1,000                                                        Net new checking accounts up 14%
                                                              –
                   644
      800
                                                                  Net new savings accounts up 51%
                                                              –
                                427
                                              531
      600
                                                                  In the Banking Center – 45% of new checking account
                                                              –
      400
                                                                  openings participated in Keep the ChangeTM
                   557          487
      200                                     343
           -
                  1Q08          1Q07         4Q07


               Net new checking       Net new savings


      ($ in billions)
     600
                                                        Avg. retail deposits of $521 billion, 11% over 1Q07
     500
                                                        • Increase primarily driven by growth in Core Retail and the addition
                 183.4                       174.0
     400                      148.7
                                                          of Lasalle
     300

     200
                 337.5                       335.4
                              320.9
     100

       -
                 1Q08          1Q07          4Q07

8          GCSBB         GWIM and Business Banking
Global Wealth & Investment Management (GWIM)

                                                      Increase (decrease) over         1Q08 Highlights:
($ in millions)
                                                       1Q07             4Q07
                                      1Q08                                             • Noninterest income improved from 4Q07
                                                                                         primarily on lower charges to support cash
    Net interest income (FTE)                                                            funds
                                                  $        75        $           9
                                  $      998
     Inv. & brokerage services                            275                    1
                                        1,081                                                     AUM declined $36 billion or 6%,
                                                                                              –
     All other income (loss)                                                                      driven by a 10% decline in the S&P
                                                         (209)              162
                                         (157)
                                                                                                  and cash product outflows.
       Total noninterest income                            66               163
                                         924
       Total revenue, net of                                                           • The increase in provision for credit losses
                                                          141               172
                                        1,922
        interest expense (FTE)                                                           was driven by deterioration in the home
    Provision for credit losses                                                          equity portfolio related to ongoing
                                                          220               209
                                         243
                                                                                         weakness in the housing market .
    Noninterest expense                                   341                38
                                        1,316
       Net income                                                                      • Noninterest expense increased from 4Q07
                                                  $      (263)       $      (83)
                                  $       228
                                                                                         on increased spending for retirement and
                                                                                         mass affluent marketing.
    Efficiency ratio                                    1,374 bps          (453) bps
                                        68.49 %
                                                                                       • Organic deposits (which excludes premier
                                         7.92
    Return on equity                                    (1,469)            (295)
                                                                                         balances transferred from GCSBB) on
                                                                                         average, grew $7 billion or 5% from 4Q07


9
Global Corporate & Investment Banking (GCIB)
                                                                                     1Q08 Highlights:
                                                       Increase (decrease) over
     ($ in millions)
                                                                                     • Net interest income increase due to good
                                                        1Q07             4Q07
                                        1Q08
                                                                                       commercial loan growth, higher average
                                                                                       capital market positions as a result of both
     Net interest income (FTE)                                                         trading strategies and underwritten paper, and
                                                   $     1,177        $      165
                                    $    3,599
                                                                                       improved asset spreads, partially offset by
       Card income                                          19                (37)
                                           250
                                                                                       lower spreads on deposits.
       Service charges                                     134                28
                                           788
                                                                                     • Negative noninterest income improved over
       Inv. & brokerage services                            13                23
                                           245                                         4Q07.
       Investment banking income                            (38)              88
                                           665                                                 Strong equity, FX and interest rate
                                                                                           –
       Trading account profits                                                                 product results
        (losses)                                         (2,628)           3,644
                                         (1,790)                                               Reduced writedowns on CMAS assets
                                                                                           –
       All other income (loss)                                                                 of $2.0 billion in 1Q08 vs. $5.3 billion in
                                                           (909)              12
                                          (589)
                                                                                               4Q07.
         Total noninterest income                        (3,409)           3,758
                                          (431)
                                                                                               Higher treasury management fees
                                                                                           –
         Total revenue, net of
                                                                                               Good investment banking income
          interest expense (FTE)                                                           –
                                                         (2,232)           3,923
                                         3,168
                                                                                               Half of Visa gain
     Provision for credit losses                                                           –
                                                           408               255
                                           523
                                                                                     • The increase in provision for credit losses was
     Noninterest expense                                   (469)            (891)
                                         2,461
                                                                                       primarily driven by homebuilder exposure, but
         Net income (loss)                         $     (1,362)      $    2,857
                                    $      115
                                                                                       also included a further trending towards more
                                                                                       normalized commercial credit performance.
     Efficiency ratio                                      n/m               n/m
                                         77.68 %                                     • Noninterest expense decreased from 4Q07
                                                                                       due largely to the reversal of 4Q07 Visa-
                                          0.78
     Return on equity                                      n/m               n/m
                                                                                       related costs, as well as lower market based
                                                                                       compensation.


10
All Other – Including GCSBB Securitization Eliminations

                                                                       Increase (decrease) over
 ($ in millions)
                                                                                                       1Q08 Highlights:
                                                                         1Q07           4Q07
                                                  1Q08
                                                                                                       • Noninterest income declined as a result of
                                                                                                         prior quarter gain from the sale of Marsico
 Net interest income (FTE)                                         $       (238)      $         81
                                              $      (1,990)                                             of $1.5 billion offset by a 4Q07 $394 million
     Card income                                                             (57)              (16)
                                                        664                                              writedown on fund related investments.
     Equity investment income                                              (628)               (10)
                                                        268                                            • Equity gains were lower on reduced market
     Gains on sales of debt                                                                              liquidity.
                                                                            159               110
                                                         220
      securities
     All other income (loss)                                               (301)           (1,010)
                                                        (255)
       Total noninterest income                                            (827)             (926)
                                                         897
       Total revenue, net of
                                                                          (1,065)            (845)
                                                     (1,093)
         interest expense (FTE)
                                  1
                                                                            106                87
                                                     (1,208)
 Provision for credit losses
 Noninterest expense                                                       (297)               97
                                                        109
 Merger charges                                                              59                30
                                                        170
    Net income (loss)                                              $       (838)      $    (1,013)
                                              $        (223)


      1   Represents the provision for credit losses in All Other combined with the GCSBB securitization offset.


11
Summary

      • Environment
           –   Good underlying consumer and commercial business flows
           –   Deposits gaining traction
           –   Capital markets still unsettled
           –   Credit costs continue to rise
      • Gaining share in key products
           – Deposits
           – Card
           – Consumer real estate
      •   Balance sheet
           – Tier 1 Capital ratio improved
           – Parent company liquidity steady at 20 months
           – Increased credit reserves


12
Capital Markets Environment Remains Challenging

      • Strong performance in equity and rates businesses offset by market valuations


        ($ in millions)                                                                   1Q08
                                                            Total                    Sales & Trading         Investment Banking
        Liquid Products                            $                   766       $                 744       $                    22
        Credit Products                                                (291)                       (523)                         232
        Structured Products                                          (1,806)                     (1,882)                          76
        Equities                                                        588                         348                          240
        Other                                                            95                         -                             95
            Total                                  $                   (648)     $               (1,313)     $                   665


                                                                               Change in revenue from 4Q07
                                                             Total                  Sales & Trading              Investment Banking
        Liquid Products                            $                    155      $                 164       $                    (9)
        Credit Products                                                (130)                      (103)                          (27)
        Structured Products                                           3,647                      3,629                            18
        Equities                                                        302                        150                           152
        Other                                                           (46)                       -                             (46)
            Total                                  $                  3,928      $               3,840       $                    88


     • Excludes $27 million and $26 million margin from FVO loan book for 1Q08 and 4Q07


13
Key Capital Markets Risk Exposures

       ($ in millions)                                         Exposures
                                                        3/31/2008    12/31/2007
       Leveraged lending related:
           Unfunded Commitments                         $    3,893    $   12,207
           Funded Commitments                                9,550         6,085
           Net Writedown                                      (439)          (41)

       CMBS related:
          Unfunded Commitments                                 784         2,217
          Funded Commitments                                11,144        13,583
          Net Writedown                                       (191)         (134)

       Super Senior CDO and other subprime related:
           Super senior subprime, net of insurance           5,935         8,176
           Super senior nonsubprime, net of insurance        3,350         3,454
           Subprime related warehouse and trading              472           593
           Net Writedown                                    (1,465)       (5,281)


14
Other Capital Markets Positions
     ($ in millions)
                                                                           1Q08 Highlights:
     Leverage Lending Related
                                                                           Leveraged Lending
                                              Unfunded        Funded       • Unfunded commitments dropped $8.3 billion
                                                                             from 12/31/07 while the funded positions
     Exposures 12/31/07                      $   12,207     $    6,085
                                                                             increased $3.5 billion. Total market exposure
       New                                         3,349         3,849
                                                                             decreased $4.8 billion to $13.4 billion.
       Syndicated                                 (6,195)         (449)
                                                                           • Writedowns, net of fees, in 1Q08 were $439
       Funded and not syndicated                  (3,838)          -
                                                                             million.
       Terminations and other                     (1,630)           65
     Exposures 3/31/08                       $     3,893    $    9,550     • Sold roughly $1.3 billion after quarter-end
                                                                             slightly above marks
     Net writedowns                          $         4    $     (443)

     CMBS Related
                                                                           CMBS
                                                                           • Funded exposures declined $2.4 billion to
                                              Unfunded        Funded
                                                                             $11.1 billion.
     Exposures 12/31/07                      $     2,217    $   13,583
       Funded/Originated                          (1,249)         1,162               $8.7 billion is primarily related to
                                                                                  –
                                                                                      floating rate acquisition related
       Sales/Paydowns/Rate Lock Unwinds             (184)        (3,376)
                                                                                      financings
       Q1 Transfer In/Change in Unrealized           -             (225)
     Exposures 3/31/08                       $       784    $   11,144                Remainder is primarily fixed-rate
                                                                                  –
                                                                                      conduit type product
     Net writedowns                          $         -    $     (191)
                                                                           • Writedowns, net of hedge gains, in 1Q08
                                                                             were $191 million.


15
Super Senior CDO Exposure

     (Dollars in millions)


                                                                                                           Total CDO Exposure at March 31, 2008
                                                                             Subprime Exposure (1)                                                         Non-Subprime Exposure (2)                                     Total CDO Net Exposure
                                                                                  Net of                                                                           Net of
                                                                                                Cumulative                                                                       Cumulative
                                                                                 Insured                              Net                                         Insured                              Net               March 31    December 31
                                                                                                          (3)                                                                              (3)
                                                     Gross         Insured       Amounts       Writedowns           Exposure           Gross        Insured       Amounts       Writedowns           Exposure             2008          2007

     Super senior liquidity
     commitments
        High grade                                    $1,800        $(1,800)            $-                  $-               $-         $3,042             $-        $3,042               $(150)         $2,892             $2,892         $5,166
        Mezzanine                                                                                                                                                                                                                             358
                                                         363              -            363                  (5)             358              -              -             -                   -               -                358
        CDOs-squared                                     988              -            988                (574)             414              -              -             -                   -               -                414          2,227
            Total super senior
              liquidity commitments                     3,151         (1,800)        1,351                (579)             772           3,042              -        3,042                (150)           2,892             3,664          7,751

     Other super senior exposure
        High grade                                                                                                                                                                                                                          2,125
                                                        6,242         (2,043)        4,199              (1,228)           2,971           1,192          (734)          458                    -             458             3,429
        Mezzanine                                       1,570              -         1,570              (1,075)             495               -             -             -                    -               -               495            795
        CDOs-squared                                    4,132              -         4,132              (2,435)           1,697             376          (376)            -                    -               -             1,697            959
            Total other super
              senior exposure                         11,944          (2,043)        9,901              (4,738)           5,163           1,568        (1,110)          458                    -             458             5,621          3,879
                                     (4)
     Losses on liquidated CDOs                                                                            (121)
          Total super senior
             exposure                                $15,095        $(3,843)      $11,252              $(5,438)         $5,935          $4,610        $(1,110)       $3,500               $(150)         $3,350             $9,285        $11,630

     (1) Classified as subprime when subprime consumer real estate loans make up at least 35 percent of the ultimate underlying collateral.
     (2) Includes highly-rated collateralized loan obligations and commercial mortgage-backed securities super senior exposure.
     (3) Net of insurance.
     (4) At March 31, 2008, the Corporation held $242 million in assets acquired from liquidated CDO vehicles. During the first quarter of 2008, the Corporation recognized $25 million in writedowns on these assets.


16
Super Senior CDO Exposure Rollforward

     (Dollars in millions)
                                                                                                                      First Quarter 2008
                                                     December 31, 2007           Paydowns / Liquidations /                                                                           March 31, 2008
                                                                                                                      Net Writedowns (1)             Reclassifications (2)
                                                       Net Exposure                      Other                                                                                        Net Exposure
     Super senior liquidity
     commitments
        High grade                                                   $5,166                               $(64)                          $(388)                     $(1,822)                      $2,892
        Mezzanine                                                       358                                  -                                                                                       358
                                                                                                                                             -                            -
        CDOs-squared                                                  2,227                               (361)                           (468)                        (984)                         414
            Total super senior
              liquidity commitments                                   7,751                               (425)                            (856)                      (2,806)                         3,664

     Other super senior exposure
        High grade                                                    2,125                               (375)                            (143)                       1,822                          3,429
         Mezzanine                                                       795                                24                             (324)                           -                            495
         CDOs-squared                                                    959                               (36)                            (210)                         984                          1,697
          Total other super
            senior exposure                                           3,879                               (387)                            (677)                       2,806                          5,621
     Losses on liquidated CDOs                                                                                                              (39)
          Total super senior
             exposure                                               $11,630                              $(812)                        $(1,572)                           $-                      $9,285


     (1) Net of insurance.
     (2) Represents CDO exposure that was reclassified from super senior liquidity commitments to other super senior exposure as the Corporation is no longer providing liquidity.


17
Asset Quality
     •   Managed net credit loss ratio across all businesses was 1.69%, up 35 basis points from 4Q07
         –   Held net charge-offs increased to 1.25%, up 34 basis points from 4Q07
     •   Provision was higher than net charge-offs by $3.3 billion increasing allowance for loans and
         leases ratio to 1.71% from 1.33% in 4Q07
         –   Housing market related
                  $1.6 billion in home equity
                  $0.2 billion residential mortgage
                  $0.1 billion commercial homebuilder deterioration

         –   Seasoning and deterioration
                  $0.7 billion small business
                  $0.4 billion unsecured lending
                  $0.3 billion consumer card

     •   Consumer card losses trending higher
         –   Managed consumer credit card net loss rate increased to 5.19% from 4.75% in 4Q07. 30 day
             delinquencies increased to 5.61% from 5.45% in 4Q07. 90 day delinquencies increased to 2.83%
             from 2.66% in 4Q07.
     •   Deterioration in Small Business Lending driving commercial losses
     •   Commercial net charge-off ratio excluding small business increased from 0.13% in 4Q07 to
         0.26%, primarily due to homebuilders.

18
Consumer Asset Quality Key Indicators
     ($ in millions)

                                                                                                                          Other 1
                                     Credit Card (Held)            Home Equity         Residential Mortgage                                       Total Consumer
                                                  4Q07                     4Q07                      4Q07                           4Q07                     4Q07
                                     1Q08                        1Q08                    1Q08                      1Q08                          1Q08

     Loans EOP                                  $ 80,724                   $114,820                $274,949                    $ 80,708                    $551,201
                                 $ 75,911                    $118,381                  $266,145                $ 84,192                      $544,629
     Loans Avg                                    74,392                    112,369                 277,058                      79,344                     543,163
                                   78,518                     116,562                   270,541                  82,754                       548,375

     Net charge-offs                          $      846                  $     179               $      27                 $          552                $   1,604
                                 $      956                $        496               $      66               $       641                    $    2,159
     % of avg loans                                 4.51 %                     0.63 %                  0.04 %                         2.76 %                   1.17 %
                                       4.90 %                      1.71 %                  0.10 %                    3.11 %                        1.58 %

     90 Performing DPD                        $    2,127                        N/A               $     237                 $          749                $   3,113
                                 $    2,056                        N/A                 $    248               $       863                    $    3,167
      % of Loans                                    2.63 %                      N/A                    0.09 %                         0.93 %                   0.56 %
                                       2.71 %                      N/A                     0.09 %                    1.03 %                        0.58 %

     Nonperforming loans                             N/A                  $   1,340                $   1,999                $          103                $   3,442
                                        N/A                  $    1,786               $    2,576               $       97                    $    4,459
     % of Loans                                      N/A                       1.17 %                   0.73 %                        0.13 %                   0.62 %
                                        N/A                        1.51 %                   0.97 %                   0.12 %                        0.82 %

     Allowance for loan losses                $    3,360                  $     963               $     207                 $        2,228                $   6,758
                                 $    3,654                $      2,549               $     394               $     2,647                    $    9,244
     % of Loans                                     4.16 %                     0.84 %                  0.08 %                         2.76 %                   1.23 %
                                       4.81 %                      2.15 %                  0.15 %                    3.14 %                        1.70 %

     Avg. refreshed (C)LTV                           N/A                        70                       61                            N/A                      N/A
                                        N/A                         74                       62                       N/A                           N/A

     90%+ refreshed (C)LTV                           N/A                        21                        8                            N/A                      N/A
                                        N/A                         26                       10                       N/A                           N/A

     Avg. refreshed FICO 2                           688                       722                      737                            N/A                      N/A
                                        685                        718                      733                       N/A                           N/A

     % below 620 FICO 2                               15 %                        8%                      5%                           N/A                      N/A
                                         16 %                       10 %                      6%                      N/A                           N/A


       1   Other primarily consists of the following portfolios of loans: Unsecured lending, dealer financial services, marine and RV

       2   Credit card shown on a managed, domestic basis.


19
Concentrations in Housing Depressed States Driving Home Equity Losses

     • California and Florida, franchise originated, combined represent:
        - 39% of the portfolio balance
        - 46% of delinquencies
        - 51% of charge-offs
     • California, Florida, Nevada, Arizona and Virginia have experienced a disproportionately
       higher share of charge-offs and delinquencies relative to share of portfolio balance.
                                                                 30day+        Nonperforming
                                      EOP       % of Total    performing as    loans as a %     % of Total Net    Charge-offs as    Refreshed    Current
       State                        Balances     Portfolio    a % of Loans       of Loans        Charge-offs      a % of Loans        CLTV        FICO
       Franchise Originated
       CA                           $ 30,534           26 %           1.54 %           1.59 %              34 %            2.32 %         76 %      722
       FL                             15,775           13             1.72             2.06                17              2.06           79        708
       NJ                              7,781            7             0.96             1.07                 2              0.68           61        722
       NY                              7,488            6             1.49             1.48                 2              0.66           60        711
       MA                              5,138            4             0.82             0.83                 2              0.73           63        728
       VA                              3,785            3             1.31             1.42                 4              2.23           80        718
       MD                              3,741            3             1.00             0.87                 1              0.60           72        718
       AZ                              3,626            3             1.37             1.21                 4              1.91           81        718
       NV                              1,950            2             1.83             2.45                 3              3.03           83        710

                                     114,342           97             1.26             1.36                80              1.41           73        718
       Total franchise originated

                                       4,039            3             3.51             5.66                20              9.66          101        685
       Non-franchise originated


       Total Home Equity            $ 118,381        100              1.33             1.51              100               1.71           74        718


20
Origination Period and CLTV are Major Loss Determinants for Home Equity

     (Dollars in millions)

     Portfolio Vintage Analysis

                             Ending Balance     Q1 Losses         Q1 Loss Rate
     >= 2004                 $       28,050   $          32                0.45 %
     2005                            21,750              84                1.54     • 60% of 1Q08 losses came
     2006                            33,530             301                3.57       from 2006 originations
     2007                            30,066              79                1.08
     2008                             4,985               -                 -
     Total amount            $     118,381    $         496                1.71


      ($ in millions)

      Portfolio Refreshed Cumulative Loan to Value

                                                                                    • 82% of 1Q08 losses came
                              Portfolio mix  % of NPLs    % of losses
                                                                                      from loans with greater
      < = 80%                           56 %         28 %           9%
                                                                                      than 90% refreshed
      80% - 90%                         17           10             9
                                                                                      cumulative loan to value
      > 90%                             26           54            82
      Other                              1            8              -

      Total amount            $    118,381    $     1,786     $         496
21
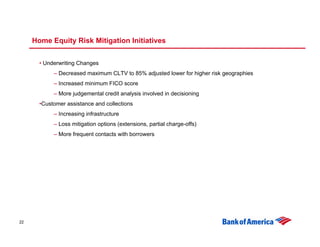
Home Equity Risk Mitigation Initiatives


       • Underwriting Changes
            – Decreased maximum CLTV to 85% adjusted lower for higher risk geographies
            – Increased minimum FICO score
            – More judgemental credit analysis involved in decisioning
       •Customer assistance and collections
            – Increasing infrastructure
            – Loss mitigation options (extensions, partial charge-offs)
            – More frequent contacts with borrowers


22
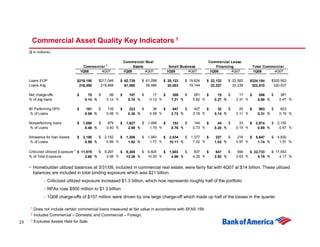
Commercial Asset Quality Key Indicators 1
     ($ in millions)

                                                               Commercial Real                               Commercial Lease
                                        Commercial 2                Estate               Small Business          Financing             Total Commercial
                                                4Q07                       4Q07                    4Q07                  4Q07                    4Q07
                                      1Q08                     1Q08                     1Q08                  1Q08                     1Q08

     Loans EOP                                $217,049                  $ 61,298                 $ 19,624              $ 22,582                 $320,553
                                  $219,190                $ 62,739                 $ 20,123                 $ 22,132              $324,184
     Loans Avg                                 219,668                    59,486                   19,144                22,239                  320,537
                                   218,490                  61,890                   20,003                   22,227               322,610

     Net charge-offs                           $     66                 $     17                 $    281               $     17                $    381
                                  $       75              $       107              $       359              $      15              $      556
     % of avg loans                                0.12 %                   0.12 %                   5.82 %                 0.31 %                  0.47 %
                                        0.14 %                   0.70 %                   7.21 %                 0.27 %                  0.69 %

     90 Performing DPD                         $    135                 $     36                 $    427               $     25                $    623
                                  $      191              $       223              $       547              $      32              $      993
      % of Loans                                   0.06 %                   0.06 %                   2.18 %                 0.11 %                  0.19 %
                                        0.09 %                   0.36 %                   2.72 %                 0.14 %                  0.31 %

     Nonperforming loans                       $    879                 $   1,099                $    144               $     33                $   2,155
                                  $    1,050              $     1,627               $      153              $      44              $    2,874
     % of Loans                                    0.40 %                    1.79 %                  0.73 %                 0.15 %                   0.67 %
                                        0.48 %                   2.59 %                   0.76 %                 0.20 %                  0.89 %

     Allowance for loan losses                 $   2,152                $   1,083                $   1,377              $    218                $   4,830
                                  $    2,180               $    1,206               $    2,034               $    227              $    5,647
     % of Loans                                     0.99 %                   1.77 %                   7.02 %                0.97 %                   1.51 %
                                        0.99 %                   1.92 %                  10.11 %                 1.03 %                  1.74 %

     Criticized Utilized Exposure 3 $ 11,875   $   9,297                $   6,825                $    837               $    594              $ 17,553
                                                           $    9,208               $    1,003              $     647              $ 22,733
     % of Total Exposure                            2.98 %                  10.35 %                  4.25 %                 2.63 %                4.17 %
                                        3.60 %                  13.36 %                   4.96 %                 2.92 %                5.15 %


     • Homebuilder utilized balances at 3/31/08, included in commercial real estate, were fairly flat with 4Q07 at $14 billion. These utilized
       balances are included in total binding exposure which was $21 billion.
                   Criticized utilized exposure increased $1.3 billion, which now represents roughly half of the portfolio
               –

                   NPAs rose $500 million to $1.3 billion
               –

                   1Q08 charge-offs of $107 million were driven by one large charge-off which made up half of the losses in the quarter
               –


      1   Does not include certain commercial loans measured at fair value in accordance with SFAS 159.
      2   Includes Commercial – Domestic and Commercial – Foreign.
      3   Excludes Assets Held for Sale.
23
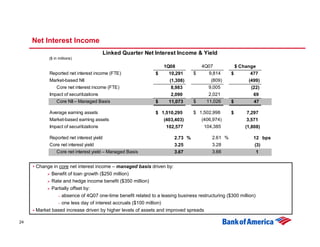
Net Interest Income
                                     Linked Quarter Net Interest Income & Yield
            ($ in millions)

                                                                                    4Q07
                                                                  1Q08                             $ Change
            Reported net interest income (FTE)                                  $     9,814
                                                              $     10,291                       $        477
            Market-based NII                                                           (809)
                                                                    (1,308)                              (499)
               Core net interest income (FTE)                                         9,005
                                                                     8,983                                (22)
            Impact of securitizations                                                 2,021
                                                                     2,090                                 69
                Core NII – Managed Basis                                        $     11,026
                                                              $     11,073                       $          47

            Average earning assets                                              $ 1,502,998
                                                              $ 1,510,295                        $       7,297
            Market-based earning assets                                            (406,974)
                                                                 (403,403)                               3,571
            Impact of securitizations                                               104,385
                                                                  102,577                               (1,808)

            Reported net interest yield                                                 2.61 %
                                                                       2.73 %                               12 bps
            Core net interest yield                                                     3.28
                                                                       3.25                                 (3)
               Core net interest yield – Managed Basis                                  3.66
                                                                       3.67                                  1


     • Change in core net interest income – managed basis driven by:
             Benefit of loan growth ($250 million)
             Rate and hedge income benefit ($350 million)
             Partially offset by:
                – absence of 4Q07 one-time benefit related to a leasing business restructuring ($300 million)

                – one less day of interest accruals ($100 million)

      Market based increase driven by higher levels of assets and improved spreads

24
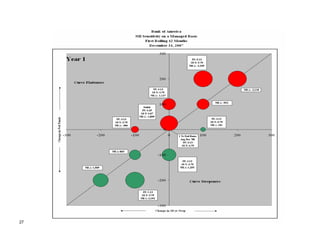
Net Interest Income – Managed Sensitivity


       ($ in millions)                              Managed net interest income impact for next 12 months
                                                      @ 3/31/08                              @ 12/31/07
       Forward curve interest rate scenarios
       +100 bp parallel shift                                                           $             (952)
                                                $              (865)
       - 100 bp parallel shift                                                                         865
                                                                527

       Flattening scenario from forward curve
       + 100 bp flattening on short end                                                             (1,127)
                                                              (1,153)
       - 100 bp flattening on long end                                                                (386)
                                                                (614)

       Steepening scenario from forward curve
       + 100 bp steepening on long end                                                                 181
                                                                 275
       - 100 bp steepening on short end                                                              1,255
                                                               1,112


25
26
27
Capital Strength


        ($ in millions)
                                                                      1Q07            4Q07
                                                      1Q08
        Tier 1 Capital                                            $   91,112      $   83,372
                                                  $   93,910
        Risk Weighted Assets                                      1,062,883       1,212,905
                                                  1,251,301
        Tier 1 Capital Ratio                                            8.57 %          6.87 %
                                                        7.51 %
        Total Capital Ratio                                            11.94           11.02
                                                       11.71
        Tier 1 Leverage Ratio                                           6.25            5.04
                                                        5.61
        Tangible Equity                                                59,943          58,977
                                                       68,616
        Tangible Equity Ratio                                            4.20 %          3.62 %
                                                        4.16 %
        Tangible Equity Ratio Adj. for OCI                              4.70             3.56
                                                        4.21
        Months to required funding – Parent Co.                              23              19
                                                             20


        Common dividends paid                                     $     2,502     $     2,849
                                                  $     2,859
        Cost of net share repurchases                                  1,359                  1
                                                              -
        Dividend yield                                                  4.39 %          6.20
                                                        6.75

        Preferred dividends paid                                  $          46   $          53
                                                  $      190


28
Conclusions

      • Environment remains challenging
           – Credit costs reflect economic environment
           – Capital markets remain volatile
      • Business momentum remains strong in most businesses
           – Retail deposits and lending growing
           – Wealth management showing steady customer activity and performance
      • Balance sheet remains strong
      • Integration of acquisitions on track


29
Appendix


30
Summary Earnings Statement –
     1st Quarter Comparison
         ($ in millions)
                                                                                       1Q07         $ Change      % Change
                                                                       1Q08
         Core net interest income (FTE)                                            $     8,116      $     867           11 %
                                                                   $     8,983
         Market-based net interest income                                                  481
                                                                         1,308
            Net interest income (FTE)                                                    8,597           1,694          20
                                                                        10,291
         Noninterest income                                                              9,887          (2,875)        (29)
                                                                         7,012
            Total revenue, net of interest expense (FTE)                                18,484          (1,181)          (6)
                                                                        17,303
         Provision for credit losses                                                     1,235           4,775         387
                                                                         6,010
         Noninterest expense (excl. merger & restruct.)                                  8,986              39         -
                                                                         9,025
         Merger and restructuring charges                                                  111
                                                                           170
            Noninterest expense                                                          9,097
                                                                         9,195
             Pre-tax income                                                              8,152
                                                                         2,098
         Income tax expense                                                              2,897
                                                                           888
             Net income                                                                  5,255          (4,045)        (77)
                                                                         1,210
         Merger & restructuring charges (after-tax)                                         70
                                                                           107
             Net Income before merger and restruct.                                $     5,325          (4,008)        (75)
                                                                   $     1,317

         Preferred dividends                                                       $          46
                                                                   $      190
         Diluted EPS                                                                      1.16
                                                                          0.23
                            1
         Return on equity                                                                16.38 %
                                                                          3.20 %
                                     1
         Tangible return on equity                                                       31.81
                                                                          6.87


     1 Measures shown on an operating basis. Please refer to the Supplemental Information Package


31
Reconciliation of Presented Held to Managed Basis – Consolidated 1Q081

           ($ in millions)                                                                                 1Q08
                                                                                     Held              Securitization              Managed
                                                                                                                                           2
                                                                                     Basis                  Impact                  Basis
           Net interest income (FTE)                                            $        10,291        $          2,090        $       12,381
           Noninterest income                                                             7,012                    (674)                 6,338
              Total revenue, net of interest expense (FTE)                               17,303                  1,416                 18,719
           Provision for credit losses                                                    6,010                  1,416                  7,426
           Noninterest expense                                                            9,195                         -                9,195
               Pre-tax income                                                             2,098                         -                2,098
           Income tax expense                                                                888                        -                  888
               Net income                                                       $         1,210        $                -      $         1,210


     1   Represents the Consolidated FTE results plus the loan securitization adjustments, related to Card Services, utilizing actual bond costs. This
         is different from GCSBB which utilizes fund transfer pricing methodology.
     2   Provision for credit losses on a managed basis represents the provision for credit losses on held loans combined with realized credit losses
         associated with the Card Services securitized loan portfolio.


32
Reconciliation of Presented Held to Managed Basis – Consolidated 1Q071


           ($ in millions)                                                                                 1Q07
                                                                                     Held             Securitization              Managed
                                                                                                                                           2
                                                                                    Basis                  Impact                  Basis
           Net interest income (FTE)                                           $          8,597        $          1,859       $       10,456
           Noninterest income                                                             9,887                   (731)                 9,156
              Total revenue, net of interest expense (FTE)                              18,484                   1,128                 19,612
           Provision for credit losses                                                   1,235                   1,128                  2,363
           Noninterest expense                                                            9,097                        -                9,097
               Pre-tax income                                                             8,152                        -                8,152
           Income tax expense                                                             2,897                        -                2,897
               Net income                                                      $          5,255        $               -      $          5,255


     1   Represents the Consolidated FTE results plus the loan securitization adjustments, related to Card Services, utilizing actual bond costs. This
         is different from GCSBB which utilizes fund transfer pricing methodology.
     2   Provision for credit losses on a managed basis represents the provision for credit losses on held loans combined with realized credit losses
         associated with the Card Services securitized loan portfolio.


33
Reconciliation of Presented Held to Managed Basis – Consolidated 4Q071


           ($ in millions)                                                                                 4Q07
                                                                                      Held             Securitization              Managed
                                                                                                                                           2
                                                                                     Basis                  Impact                  Basis
           Net interest income (FTE)                                            $         9,814        $          2,021        $       11,835
           Noninterest income                                                             3,508                    (711)                 2,797
              Total revenue, net of interest expense (FTE)                               13,322                   1,310                 14,632
           Provision for credit losses                                                    3,310                   1,310                  4,620
           Noninterest expense                                                           10,277                         -               10,277
                Pre-tax income                                                               (265)                      -                 (265)
           Income tax expense                                                                (533)                      -                 (533)
                Net income                                                      $            268       $                -      $           268


     1   Represents the Consolidated FTE results plus the loan securitization adjustments, related to Card Services, utilizing actual bond costs. This
         is different from GCSBB which utilizes fund transfer pricing methodology.
     2   Provision for credit losses on a managed basis represents the provision for credit losses on held loans combined with realized credit losses
         associated with the Card Services securitized loan portfolio.


34
First Quarter 2008 Earnings Presentation

More Related Content

First Quarter 2008 Earnings Presentation

  • 1. Bank of America First Quarter 2008 Results Ken Lewis Chairman, CEO and President Joe Price Chief Financial Officer April 21, 2008
  • 2. Forward Looking Statements This presentation contains forward-looking statements, including statements about the financial conditions, results of operations and earnings outlook of Bank of America Corporation. The forward-looking statements involve certain risks and uncertainties. Factors that may cause actual results or earnings to differ materially from such forward-looking statements include, among others, the following: 1) projected business increases following process changes and other investments are lower than expected; 2) competitive pressure among financial services companies increases significantly; 3) general economic conditions are less favorable than expected; 4) political conditions including the threat of future terrorist activity and related actions by the United States abroad may adversely affect the company’s businesses and economic conditions as a whole; 5) changes in the interest rate environment and market liquidity reduce interest margins, impact funding sources and effect the ability to originate and distribute financial products in the primary and secondary markets; 6) changes in foreign exchange rates increases exposure; 7) changes in market rates and prices may adversely impact the value of financial products; 8) legislation or regulatory environments, requirements or changes adversely affect the businesses in which the company is engaged; 9) changes in accounting standards, rules or interpretations; 10) litigation liabilities, including costs, expenses, settlements and judgments, may adversely affect the company or its businesses; 11) mergers and acquisitions and their integration into the company; and 12) decisions to downsize, sell or close units or otherwise change the business mix of any of the company. Accordingly, readers are cautioned not to place undue reliance on forward-looking statements, which speak only as of the date on which they are made. Bank of America does not undertake to update forward-looking statements to reflect the impact of circumstances or events that arise after the date the forward-looking statements are made. For further information regarding Bank of America Corporation, please read the Bank of America reports filed with the SEC and available at www.sec.gov. 2
  • 3. Important Presentation Format Information • Certain prior period amounts have been reclassified to conform to current period presentation • The Corporation reports its Global Consumer & Small Business Banking (GCSBB) results, specifically Card Services, on a managed basis. Refer to Exhibit A in the Supplemental Package for a reconciliation from Managed to Held results 3
  • 4. 1Q08 Summary Items • Diluted EPS of $0.23 – Business growth offset by credit costs and market valuations – Merger and restructuring charges - $107 million (after-tax) • Visa equity investment gain - $776 million (pre-tax) • Net interest income up on higher loan and deposit levels and a steeper yield curve • Capital markets valuations – CDO and subprime-related exposures - $1.5 billion, net of hedge gains – Leveraged lending - $439 million – CMBS - $191 million • Cost to support funds in 1Q08 - $220 million • Provision of $6.0 billion (includes $3.3 billion reserve increase) • Noninterest expenses down $1.1 billion from 4Q07 driven by the reversal of 4Q07 Visa-related costs. 4
  • 5. 1,2 Consolidated Highlights Adjusted to a Managed Basis Increase (decrease) over ($ in millions) 1Q07 4Q07 1Q08 Net interest income (FTE) $ 1,925 $ 546 $ 12,381 Noninterest income (2,818) 3,541 6,338 Total revenue, net of interest expense (FTE) (893) 4,087 18,719 3 5,063 2,806 7,426 Provision for credit losses Noninterest expense 98 (1,082) 9,195 Pre-tax income (6,054) 2,363 2,098 Income tax expense (FTE) (2,009) 1,421 888 Net income $ (4,045) $ 942 $ 1,210 Preferred dividends $ 144 $ 137 $ 190 Diluted EPS (0.93) 0.18 0.23 After tax effect of merger charge 37 19 107 4 Return on equity (1,318) bps 235 bps 3.20 % 4 Tangible return on equity (2,494) 475 6.87 1 Managed basis assumes that loans that have been securitized were not sold and presents earnings on these loans in a manner similar to the way loans that have not been sold (i.e., held loans) are presented. Noninterest income, both on a held and managed basis, includes the impact of adjustments to the interest-only strip that are recorded in card income. 2 Represents the Consolidated FTE results plus the loan securitization adjustments, related to Card Services, utilizing actual bond costs. This is different from GCSBB which utilizes fund transfer pricing methodology. See Reconciliation of Presented Held to Managed Basis on pages 32-34. 3 Represents the provision for credit losses on held loans combined with realized credit losses associated with the Card Services securitized loan portfolio. 4 Measures shown on an operating basis. Please refer to the Supplemental Information Package. 5
  • 6. Global Consumer & Small Business Banking (GCSBB) – Managed Basis Increase (decrease) over ($ in millions) 1Q08 Highlights: 1Q07 4Q07 1Q08 • Net Interest Income increased due to an increase in average loans and deposits. Net interest income (FTE) $ 680 $ 222 $ 7,684 • Noninterest income growth over 1Q07 reflects Card income 344 100 2,725 good business activity across all products and Service charges half of company’s recognized Visa gain. 189 (58) 1,566 Mortgage banking income 354 166 656 • The increase in provision for credit losses was All other income driven by ongoing weakness in the housing 408 301 675 market and the economy along with seasoning Total noninterest income 1,295 509 5,622 of several growth portfolios. Total revenue, net of interest expense (FTE) • Noninterest expense decreased from 4Q07 1,975 731 13,306 due to the reversal of 4Q07 Visa-related costs. 1 Provision for credit losses 4,041 2,149 6,452 • Average loans and leases increased $55 billion Noninterest expense 464 (356) 5,139 from 1Q07, driven by U.S. consumer card, Net income $ (1,582) $ (819) $ 1,090 unsecured lending, home equity and LaSalle. Efficiency ratio (264) bps (508) bps 38.62 % 6.64 Return on equity (1,098) (466) 1 Represents the provision for credit losses on held loans combined with realized credit losses associated with the Card Services securitized loan portfolio. 6
  • 7. Global Consumer & Small Business Banking (GCSBB) – Managed Basis Revenue of $13.3 billion, 17% over 1Q07 ($ in millions) • Net interest income of $7.7 billion increased 10% 14,000 Deposits grew 5% over 1Q07 – 12,000 Loan growth of 18% from 1Q07 – 5,622 5,113 10,000 4,327 Spreads expanded 13 bps – 8,000 • Noninterest income of $5.6 billion improved 30% 6,000 Service charge revenue grew 14% due to account growth – 4,000 7,684 7,462 7,004 Card income increased due to improved funding costs and – 2,000 higher fees - 1Q08 1Q07 4Q07 Managed credit costs of $6.5 billion, up $4.0 billion from 1Q07, and $2.1 billion from 4Q07 Net interest income Noninterest income • Managed net losses of $3.7 billion in 1Q08 ($ in millions) Total Corp., home equity net c/o ratio rose to 1.71% from .63% in – 7,000 4Q07 6,000 Consumer credit card managed net loss ratio increased to 5.19% – 2,766 5,000 from 4.75% in 4Q07 4,000 1,270 • Increased reserves, in GCSBB, $2.8 billion in 1Q08 3,000 $1.4 billion home equity – 2,000 3,686 3,033 2,433 $0.7 billion small business – 1,000 - (22) $0.4 billion unsecured lending – (1,000) $0.3 billion consumer credit card – 1Q08 1Q07 4Q07 7 Managed net losses Reserve build
  • 8. Global Consumer & Small Business Banking (GCSBB) – Managed Basis (units in thousands) Gross product sales of 13 million, 10% over 1Q07 1,400 • Strong performance in Deposits, Debit and Online Banking 1,200 1,000 Net new checking accounts up 14% – 644 800 Net new savings accounts up 51% – 427 531 600 In the Banking Center – 45% of new checking account – 400 openings participated in Keep the ChangeTM 557 487 200 343 - 1Q08 1Q07 4Q07 Net new checking Net new savings ($ in billions) 600 Avg. retail deposits of $521 billion, 11% over 1Q07 500 • Increase primarily driven by growth in Core Retail and the addition 183.4 174.0 400 148.7 of Lasalle 300 200 337.5 335.4 320.9 100 - 1Q08 1Q07 4Q07 8 GCSBB GWIM and Business Banking
  • 9. Global Wealth & Investment Management (GWIM) Increase (decrease) over 1Q08 Highlights: ($ in millions) 1Q07 4Q07 1Q08 • Noninterest income improved from 4Q07 primarily on lower charges to support cash Net interest income (FTE) funds $ 75 $ 9 $ 998 Inv. & brokerage services 275 1 1,081 AUM declined $36 billion or 6%, – All other income (loss) driven by a 10% decline in the S&P (209) 162 (157) and cash product outflows. Total noninterest income 66 163 924 Total revenue, net of • The increase in provision for credit losses 141 172 1,922 interest expense (FTE) was driven by deterioration in the home Provision for credit losses equity portfolio related to ongoing 220 209 243 weakness in the housing market . Noninterest expense 341 38 1,316 Net income • Noninterest expense increased from 4Q07 $ (263) $ (83) $ 228 on increased spending for retirement and mass affluent marketing. Efficiency ratio 1,374 bps (453) bps 68.49 % • Organic deposits (which excludes premier 7.92 Return on equity (1,469) (295) balances transferred from GCSBB) on average, grew $7 billion or 5% from 4Q07 9
  • 10. Global Corporate & Investment Banking (GCIB) 1Q08 Highlights: Increase (decrease) over ($ in millions) • Net interest income increase due to good 1Q07 4Q07 1Q08 commercial loan growth, higher average capital market positions as a result of both Net interest income (FTE) trading strategies and underwritten paper, and $ 1,177 $ 165 $ 3,599 improved asset spreads, partially offset by Card income 19 (37) 250 lower spreads on deposits. Service charges 134 28 788 • Negative noninterest income improved over Inv. & brokerage services 13 23 245 4Q07. Investment banking income (38) 88 665 Strong equity, FX and interest rate – Trading account profits product results (losses) (2,628) 3,644 (1,790) Reduced writedowns on CMAS assets – All other income (loss) of $2.0 billion in 1Q08 vs. $5.3 billion in (909) 12 (589) 4Q07. Total noninterest income (3,409) 3,758 (431) Higher treasury management fees – Total revenue, net of Good investment banking income interest expense (FTE) – (2,232) 3,923 3,168 Half of Visa gain Provision for credit losses – 408 255 523 • The increase in provision for credit losses was Noninterest expense (469) (891) 2,461 primarily driven by homebuilder exposure, but Net income (loss) $ (1,362) $ 2,857 $ 115 also included a further trending towards more normalized commercial credit performance. Efficiency ratio n/m n/m 77.68 % • Noninterest expense decreased from 4Q07 due largely to the reversal of 4Q07 Visa- 0.78 Return on equity n/m n/m related costs, as well as lower market based compensation. 10
  • 11. All Other – Including GCSBB Securitization Eliminations Increase (decrease) over ($ in millions) 1Q08 Highlights: 1Q07 4Q07 1Q08 • Noninterest income declined as a result of prior quarter gain from the sale of Marsico Net interest income (FTE) $ (238) $ 81 $ (1,990) of $1.5 billion offset by a 4Q07 $394 million Card income (57) (16) 664 writedown on fund related investments. Equity investment income (628) (10) 268 • Equity gains were lower on reduced market Gains on sales of debt liquidity. 159 110 220 securities All other income (loss) (301) (1,010) (255) Total noninterest income (827) (926) 897 Total revenue, net of (1,065) (845) (1,093) interest expense (FTE) 1 106 87 (1,208) Provision for credit losses Noninterest expense (297) 97 109 Merger charges 59 30 170 Net income (loss) $ (838) $ (1,013) $ (223) 1 Represents the provision for credit losses in All Other combined with the GCSBB securitization offset. 11
  • 12. Summary • Environment – Good underlying consumer and commercial business flows – Deposits gaining traction – Capital markets still unsettled – Credit costs continue to rise • Gaining share in key products – Deposits – Card – Consumer real estate • Balance sheet – Tier 1 Capital ratio improved – Parent company liquidity steady at 20 months – Increased credit reserves 12
  • 13. Capital Markets Environment Remains Challenging • Strong performance in equity and rates businesses offset by market valuations ($ in millions) 1Q08 Total Sales & Trading Investment Banking Liquid Products $ 766 $ 744 $ 22 Credit Products (291) (523) 232 Structured Products (1,806) (1,882) 76 Equities 588 348 240 Other 95 - 95 Total $ (648) $ (1,313) $ 665 Change in revenue from 4Q07 Total Sales & Trading Investment Banking Liquid Products $ 155 $ 164 $ (9) Credit Products (130) (103) (27) Structured Products 3,647 3,629 18 Equities 302 150 152 Other (46) - (46) Total $ 3,928 $ 3,840 $ 88 • Excludes $27 million and $26 million margin from FVO loan book for 1Q08 and 4Q07 13
  • 14. Key Capital Markets Risk Exposures ($ in millions) Exposures 3/31/2008 12/31/2007 Leveraged lending related: Unfunded Commitments $ 3,893 $ 12,207 Funded Commitments 9,550 6,085 Net Writedown (439) (41) CMBS related: Unfunded Commitments 784 2,217 Funded Commitments 11,144 13,583 Net Writedown (191) (134) Super Senior CDO and other subprime related: Super senior subprime, net of insurance 5,935 8,176 Super senior nonsubprime, net of insurance 3,350 3,454 Subprime related warehouse and trading 472 593 Net Writedown (1,465) (5,281) 14
  • 15. Other Capital Markets Positions ($ in millions) 1Q08 Highlights: Leverage Lending Related Leveraged Lending Unfunded Funded • Unfunded commitments dropped $8.3 billion from 12/31/07 while the funded positions Exposures 12/31/07 $ 12,207 $ 6,085 increased $3.5 billion. Total market exposure New 3,349 3,849 decreased $4.8 billion to $13.4 billion. Syndicated (6,195) (449) • Writedowns, net of fees, in 1Q08 were $439 Funded and not syndicated (3,838) - million. Terminations and other (1,630) 65 Exposures 3/31/08 $ 3,893 $ 9,550 • Sold roughly $1.3 billion after quarter-end slightly above marks Net writedowns $ 4 $ (443) CMBS Related CMBS • Funded exposures declined $2.4 billion to Unfunded Funded $11.1 billion. Exposures 12/31/07 $ 2,217 $ 13,583 Funded/Originated (1,249) 1,162 $8.7 billion is primarily related to – floating rate acquisition related Sales/Paydowns/Rate Lock Unwinds (184) (3,376) financings Q1 Transfer In/Change in Unrealized - (225) Exposures 3/31/08 $ 784 $ 11,144 Remainder is primarily fixed-rate – conduit type product Net writedowns $ - $ (191) • Writedowns, net of hedge gains, in 1Q08 were $191 million. 15
  • 16. Super Senior CDO Exposure (Dollars in millions) Total CDO Exposure at March 31, 2008 Subprime Exposure (1) Non-Subprime Exposure (2) Total CDO Net Exposure Net of Net of Cumulative Cumulative Insured Net Insured Net March 31 December 31 (3) (3) Gross Insured Amounts Writedowns Exposure Gross Insured Amounts Writedowns Exposure 2008 2007 Super senior liquidity commitments High grade $1,800 $(1,800) $- $- $- $3,042 $- $3,042 $(150) $2,892 $2,892 $5,166 Mezzanine 358 363 - 363 (5) 358 - - - - - 358 CDOs-squared 988 - 988 (574) 414 - - - - - 414 2,227 Total super senior liquidity commitments 3,151 (1,800) 1,351 (579) 772 3,042 - 3,042 (150) 2,892 3,664 7,751 Other super senior exposure High grade 2,125 6,242 (2,043) 4,199 (1,228) 2,971 1,192 (734) 458 - 458 3,429 Mezzanine 1,570 - 1,570 (1,075) 495 - - - - - 495 795 CDOs-squared 4,132 - 4,132 (2,435) 1,697 376 (376) - - - 1,697 959 Total other super senior exposure 11,944 (2,043) 9,901 (4,738) 5,163 1,568 (1,110) 458 - 458 5,621 3,879 (4) Losses on liquidated CDOs (121) Total super senior exposure $15,095 $(3,843) $11,252 $(5,438) $5,935 $4,610 $(1,110) $3,500 $(150) $3,350 $9,285 $11,630 (1) Classified as subprime when subprime consumer real estate loans make up at least 35 percent of the ultimate underlying collateral. (2) Includes highly-rated collateralized loan obligations and commercial mortgage-backed securities super senior exposure. (3) Net of insurance. (4) At March 31, 2008, the Corporation held $242 million in assets acquired from liquidated CDO vehicles. During the first quarter of 2008, the Corporation recognized $25 million in writedowns on these assets. 16
  • 17. Super Senior CDO Exposure Rollforward (Dollars in millions) First Quarter 2008 December 31, 2007 Paydowns / Liquidations / March 31, 2008 Net Writedowns (1) Reclassifications (2) Net Exposure Other Net Exposure Super senior liquidity commitments High grade $5,166 $(64) $(388) $(1,822) $2,892 Mezzanine 358 - 358 - - CDOs-squared 2,227 (361) (468) (984) 414 Total super senior liquidity commitments 7,751 (425) (856) (2,806) 3,664 Other super senior exposure High grade 2,125 (375) (143) 1,822 3,429 Mezzanine 795 24 (324) - 495 CDOs-squared 959 (36) (210) 984 1,697 Total other super senior exposure 3,879 (387) (677) 2,806 5,621 Losses on liquidated CDOs (39) Total super senior exposure $11,630 $(812) $(1,572) $- $9,285 (1) Net of insurance. (2) Represents CDO exposure that was reclassified from super senior liquidity commitments to other super senior exposure as the Corporation is no longer providing liquidity. 17
  • 18. Asset Quality • Managed net credit loss ratio across all businesses was 1.69%, up 35 basis points from 4Q07 – Held net charge-offs increased to 1.25%, up 34 basis points from 4Q07 • Provision was higher than net charge-offs by $3.3 billion increasing allowance for loans and leases ratio to 1.71% from 1.33% in 4Q07 – Housing market related $1.6 billion in home equity $0.2 billion residential mortgage $0.1 billion commercial homebuilder deterioration – Seasoning and deterioration $0.7 billion small business $0.4 billion unsecured lending $0.3 billion consumer card • Consumer card losses trending higher – Managed consumer credit card net loss rate increased to 5.19% from 4.75% in 4Q07. 30 day delinquencies increased to 5.61% from 5.45% in 4Q07. 90 day delinquencies increased to 2.83% from 2.66% in 4Q07. • Deterioration in Small Business Lending driving commercial losses • Commercial net charge-off ratio excluding small business increased from 0.13% in 4Q07 to 0.26%, primarily due to homebuilders. 18
  • 19. Consumer Asset Quality Key Indicators ($ in millions) Other 1 Credit Card (Held) Home Equity Residential Mortgage Total Consumer 4Q07 4Q07 4Q07 4Q07 4Q07 1Q08 1Q08 1Q08 1Q08 1Q08 Loans EOP $ 80,724 $114,820 $274,949 $ 80,708 $551,201 $ 75,911 $118,381 $266,145 $ 84,192 $544,629 Loans Avg 74,392 112,369 277,058 79,344 543,163 78,518 116,562 270,541 82,754 548,375 Net charge-offs $ 846 $ 179 $ 27 $ 552 $ 1,604 $ 956 $ 496 $ 66 $ 641 $ 2,159 % of avg loans 4.51 % 0.63 % 0.04 % 2.76 % 1.17 % 4.90 % 1.71 % 0.10 % 3.11 % 1.58 % 90 Performing DPD $ 2,127 N/A $ 237 $ 749 $ 3,113 $ 2,056 N/A $ 248 $ 863 $ 3,167 % of Loans 2.63 % N/A 0.09 % 0.93 % 0.56 % 2.71 % N/A 0.09 % 1.03 % 0.58 % Nonperforming loans N/A $ 1,340 $ 1,999 $ 103 $ 3,442 N/A $ 1,786 $ 2,576 $ 97 $ 4,459 % of Loans N/A 1.17 % 0.73 % 0.13 % 0.62 % N/A 1.51 % 0.97 % 0.12 % 0.82 % Allowance for loan losses $ 3,360 $ 963 $ 207 $ 2,228 $ 6,758 $ 3,654 $ 2,549 $ 394 $ 2,647 $ 9,244 % of Loans 4.16 % 0.84 % 0.08 % 2.76 % 1.23 % 4.81 % 2.15 % 0.15 % 3.14 % 1.70 % Avg. refreshed (C)LTV N/A 70 61 N/A N/A N/A 74 62 N/A N/A 90%+ refreshed (C)LTV N/A 21 8 N/A N/A N/A 26 10 N/A N/A Avg. refreshed FICO 2 688 722 737 N/A N/A 685 718 733 N/A N/A % below 620 FICO 2 15 % 8% 5% N/A N/A 16 % 10 % 6% N/A N/A 1 Other primarily consists of the following portfolios of loans: Unsecured lending, dealer financial services, marine and RV 2 Credit card shown on a managed, domestic basis. 19
  • 20. Concentrations in Housing Depressed States Driving Home Equity Losses • California and Florida, franchise originated, combined represent: - 39% of the portfolio balance - 46% of delinquencies - 51% of charge-offs • California, Florida, Nevada, Arizona and Virginia have experienced a disproportionately higher share of charge-offs and delinquencies relative to share of portfolio balance. 30day+ Nonperforming EOP % of Total performing as loans as a % % of Total Net Charge-offs as Refreshed Current State Balances Portfolio a % of Loans of Loans Charge-offs a % of Loans CLTV FICO Franchise Originated CA $ 30,534 26 % 1.54 % 1.59 % 34 % 2.32 % 76 % 722 FL 15,775 13 1.72 2.06 17 2.06 79 708 NJ 7,781 7 0.96 1.07 2 0.68 61 722 NY 7,488 6 1.49 1.48 2 0.66 60 711 MA 5,138 4 0.82 0.83 2 0.73 63 728 VA 3,785 3 1.31 1.42 4 2.23 80 718 MD 3,741 3 1.00 0.87 1 0.60 72 718 AZ 3,626 3 1.37 1.21 4 1.91 81 718 NV 1,950 2 1.83 2.45 3 3.03 83 710 114,342 97 1.26 1.36 80 1.41 73 718 Total franchise originated 4,039 3 3.51 5.66 20 9.66 101 685 Non-franchise originated Total Home Equity $ 118,381 100 1.33 1.51 100 1.71 74 718 20
  • 21. Origination Period and CLTV are Major Loss Determinants for Home Equity (Dollars in millions) Portfolio Vintage Analysis Ending Balance Q1 Losses Q1 Loss Rate >= 2004 $ 28,050 $ 32 0.45 % 2005 21,750 84 1.54 • 60% of 1Q08 losses came 2006 33,530 301 3.57 from 2006 originations 2007 30,066 79 1.08 2008 4,985 - - Total amount $ 118,381 $ 496 1.71 ($ in millions) Portfolio Refreshed Cumulative Loan to Value • 82% of 1Q08 losses came Portfolio mix % of NPLs % of losses from loans with greater < = 80% 56 % 28 % 9% than 90% refreshed 80% - 90% 17 10 9 cumulative loan to value > 90% 26 54 82 Other 1 8 - Total amount $ 118,381 $ 1,786 $ 496 21
  • 22. Home Equity Risk Mitigation Initiatives • Underwriting Changes – Decreased maximum CLTV to 85% adjusted lower for higher risk geographies – Increased minimum FICO score – More judgemental credit analysis involved in decisioning •Customer assistance and collections – Increasing infrastructure – Loss mitigation options (extensions, partial charge-offs) – More frequent contacts with borrowers 22
  • 23. Commercial Asset Quality Key Indicators 1 ($ in millions) Commercial Real Commercial Lease Commercial 2 Estate Small Business Financing Total Commercial 4Q07 4Q07 4Q07 4Q07 4Q07 1Q08 1Q08 1Q08 1Q08 1Q08 Loans EOP $217,049 $ 61,298 $ 19,624 $ 22,582 $320,553 $219,190 $ 62,739 $ 20,123 $ 22,132 $324,184 Loans Avg 219,668 59,486 19,144 22,239 320,537 218,490 61,890 20,003 22,227 322,610 Net charge-offs $ 66 $ 17 $ 281 $ 17 $ 381 $ 75 $ 107 $ 359 $ 15 $ 556 % of avg loans 0.12 % 0.12 % 5.82 % 0.31 % 0.47 % 0.14 % 0.70 % 7.21 % 0.27 % 0.69 % 90 Performing DPD $ 135 $ 36 $ 427 $ 25 $ 623 $ 191 $ 223 $ 547 $ 32 $ 993 % of Loans 0.06 % 0.06 % 2.18 % 0.11 % 0.19 % 0.09 % 0.36 % 2.72 % 0.14 % 0.31 % Nonperforming loans $ 879 $ 1,099 $ 144 $ 33 $ 2,155 $ 1,050 $ 1,627 $ 153 $ 44 $ 2,874 % of Loans 0.40 % 1.79 % 0.73 % 0.15 % 0.67 % 0.48 % 2.59 % 0.76 % 0.20 % 0.89 % Allowance for loan losses $ 2,152 $ 1,083 $ 1,377 $ 218 $ 4,830 $ 2,180 $ 1,206 $ 2,034 $ 227 $ 5,647 % of Loans 0.99 % 1.77 % 7.02 % 0.97 % 1.51 % 0.99 % 1.92 % 10.11 % 1.03 % 1.74 % Criticized Utilized Exposure 3 $ 11,875 $ 9,297 $ 6,825 $ 837 $ 594 $ 17,553 $ 9,208 $ 1,003 $ 647 $ 22,733 % of Total Exposure 2.98 % 10.35 % 4.25 % 2.63 % 4.17 % 3.60 % 13.36 % 4.96 % 2.92 % 5.15 % • Homebuilder utilized balances at 3/31/08, included in commercial real estate, were fairly flat with 4Q07 at $14 billion. These utilized balances are included in total binding exposure which was $21 billion. Criticized utilized exposure increased $1.3 billion, which now represents roughly half of the portfolio – NPAs rose $500 million to $1.3 billion – 1Q08 charge-offs of $107 million were driven by one large charge-off which made up half of the losses in the quarter – 1 Does not include certain commercial loans measured at fair value in accordance with SFAS 159. 2 Includes Commercial – Domestic and Commercial – Foreign. 3 Excludes Assets Held for Sale. 23
  • 24. Net Interest Income Linked Quarter Net Interest Income & Yield ($ in millions) 4Q07 1Q08 $ Change Reported net interest income (FTE) $ 9,814 $ 10,291 $ 477 Market-based NII (809) (1,308) (499) Core net interest income (FTE) 9,005 8,983 (22) Impact of securitizations 2,021 2,090 69 Core NII – Managed Basis $ 11,026 $ 11,073 $ 47 Average earning assets $ 1,502,998 $ 1,510,295 $ 7,297 Market-based earning assets (406,974) (403,403) 3,571 Impact of securitizations 104,385 102,577 (1,808) Reported net interest yield 2.61 % 2.73 % 12 bps Core net interest yield 3.28 3.25 (3) Core net interest yield – Managed Basis 3.66 3.67 1 • Change in core net interest income – managed basis driven by: Benefit of loan growth ($250 million) Rate and hedge income benefit ($350 million) Partially offset by: – absence of 4Q07 one-time benefit related to a leasing business restructuring ($300 million) – one less day of interest accruals ($100 million) Market based increase driven by higher levels of assets and improved spreads 24
  • 25. Net Interest Income – Managed Sensitivity ($ in millions) Managed net interest income impact for next 12 months @ 3/31/08 @ 12/31/07 Forward curve interest rate scenarios +100 bp parallel shift $ (952) $ (865) - 100 bp parallel shift 865 527 Flattening scenario from forward curve + 100 bp flattening on short end (1,127) (1,153) - 100 bp flattening on long end (386) (614) Steepening scenario from forward curve + 100 bp steepening on long end 181 275 - 100 bp steepening on short end 1,255 1,112 25
  • 26. 26
  • 27. 27
  • 28. Capital Strength ($ in millions) 1Q07 4Q07 1Q08 Tier 1 Capital $ 91,112 $ 83,372 $ 93,910 Risk Weighted Assets 1,062,883 1,212,905 1,251,301 Tier 1 Capital Ratio 8.57 % 6.87 % 7.51 % Total Capital Ratio 11.94 11.02 11.71 Tier 1 Leverage Ratio 6.25 5.04 5.61 Tangible Equity 59,943 58,977 68,616 Tangible Equity Ratio 4.20 % 3.62 % 4.16 % Tangible Equity Ratio Adj. for OCI 4.70 3.56 4.21 Months to required funding – Parent Co. 23 19 20 Common dividends paid $ 2,502 $ 2,849 $ 2,859 Cost of net share repurchases 1,359 1 - Dividend yield 4.39 % 6.20 6.75 Preferred dividends paid $ 46 $ 53 $ 190 28
  • 29. Conclusions • Environment remains challenging – Credit costs reflect economic environment – Capital markets remain volatile • Business momentum remains strong in most businesses – Retail deposits and lending growing – Wealth management showing steady customer activity and performance • Balance sheet remains strong • Integration of acquisitions on track 29
  • 31. Summary Earnings Statement – 1st Quarter Comparison ($ in millions) 1Q07 $ Change % Change 1Q08 Core net interest income (FTE) $ 8,116 $ 867 11 % $ 8,983 Market-based net interest income 481 1,308 Net interest income (FTE) 8,597 1,694 20 10,291 Noninterest income 9,887 (2,875) (29) 7,012 Total revenue, net of interest expense (FTE) 18,484 (1,181) (6) 17,303 Provision for credit losses 1,235 4,775 387 6,010 Noninterest expense (excl. merger & restruct.) 8,986 39 - 9,025 Merger and restructuring charges 111 170 Noninterest expense 9,097 9,195 Pre-tax income 8,152 2,098 Income tax expense 2,897 888 Net income 5,255 (4,045) (77) 1,210 Merger & restructuring charges (after-tax) 70 107 Net Income before merger and restruct. $ 5,325 (4,008) (75) $ 1,317 Preferred dividends $ 46 $ 190 Diluted EPS 1.16 0.23 1 Return on equity 16.38 % 3.20 % 1 Tangible return on equity 31.81 6.87 1 Measures shown on an operating basis. Please refer to the Supplemental Information Package 31
  • 32. Reconciliation of Presented Held to Managed Basis – Consolidated 1Q081 ($ in millions) 1Q08 Held Securitization Managed 2 Basis Impact Basis Net interest income (FTE) $ 10,291 $ 2,090 $ 12,381 Noninterest income 7,012 (674) 6,338 Total revenue, net of interest expense (FTE) 17,303 1,416 18,719 Provision for credit losses 6,010 1,416 7,426 Noninterest expense 9,195 - 9,195 Pre-tax income 2,098 - 2,098 Income tax expense 888 - 888 Net income $ 1,210 $ - $ 1,210 1 Represents the Consolidated FTE results plus the loan securitization adjustments, related to Card Services, utilizing actual bond costs. This is different from GCSBB which utilizes fund transfer pricing methodology. 2 Provision for credit losses on a managed basis represents the provision for credit losses on held loans combined with realized credit losses associated with the Card Services securitized loan portfolio. 32
  • 33. Reconciliation of Presented Held to Managed Basis – Consolidated 1Q071 ($ in millions) 1Q07 Held Securitization Managed 2 Basis Impact Basis Net interest income (FTE) $ 8,597 $ 1,859 $ 10,456 Noninterest income 9,887 (731) 9,156 Total revenue, net of interest expense (FTE) 18,484 1,128 19,612 Provision for credit losses 1,235 1,128 2,363 Noninterest expense 9,097 - 9,097 Pre-tax income 8,152 - 8,152 Income tax expense 2,897 - 2,897 Net income $ 5,255 $ - $ 5,255 1 Represents the Consolidated FTE results plus the loan securitization adjustments, related to Card Services, utilizing actual bond costs. This is different from GCSBB which utilizes fund transfer pricing methodology. 2 Provision for credit losses on a managed basis represents the provision for credit losses on held loans combined with realized credit losses associated with the Card Services securitized loan portfolio. 33
  • 34. Reconciliation of Presented Held to Managed Basis – Consolidated 4Q071 ($ in millions) 4Q07 Held Securitization Managed 2 Basis Impact Basis Net interest income (FTE) $ 9,814 $ 2,021 $ 11,835 Noninterest income 3,508 (711) 2,797 Total revenue, net of interest expense (FTE) 13,322 1,310 14,632 Provision for credit losses 3,310 1,310 4,620 Noninterest expense 10,277 - 10,277 Pre-tax income (265) - (265) Income tax expense (533) - (533) Net income $ 268 $ - $ 268 1 Represents the Consolidated FTE results plus the loan securitization adjustments, related to Card Services, utilizing actual bond costs. This is different from GCSBB which utilizes fund transfer pricing methodology. 2 Provision for credit losses on a managed basis represents the provision for credit losses on held loans combined with realized credit losses associated with the Card Services securitized loan portfolio. 34