


Fisheries-Aquaculture
- 2. What is aquaculture? Aquaculture, also known as aqua farming, is the farming of aquatic organisms such as fish, crustaceans, molluscs and aquatic plants.
- 3. Types of Aquaculture Marine/Brackishwater Aquaculture-It refers to the culturing of species that live in the ocean. Marine aquaculture can take place in the ocean (that is, in cages, on the seafloor, or suspended in the water column) or in on-land, manmade systems such as ponds or tanks. Recirculating aquaculture systems that reduce, reuse, and recycle water and waste can support some marine species. Species :- carp, catla, rohu, magur, freshwater prawn, freshwater pearl culture and ornamental fish farming
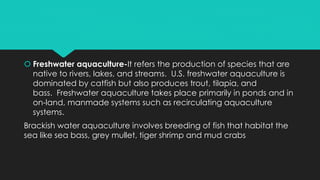
- 4. Freshwater aquaculture-It refers the production of species that are native to rivers, lakes, and streams. U.S. freshwater aquaculture is dominated by catfish but also produces trout, tilapia, and bass. Freshwater aquaculture takes place primarily in ponds and in on-land, manmade systems such as recirculating aquaculture systems. Brackish water aquaculture involves breeding of fish that habitat the sea like sea bass, grey mullet, tiger shrimp and mud crabs
- 5. Aquaculture & Fish Trade Increasing Importance of Aquaculture in trade. Very important for 26 % of international fish trade For another 21 % aquaculture is starting to gain important. Share of Shrimps in Int. trade-16.5 % Contribution of Farmed Shrimps-40 %
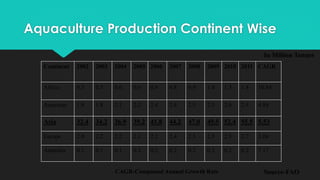
- 6. Aquaculture Production Continent Wise Continent 2002 2003 2004 2005 2006 2007 2008 2009 2010 2011 CAGR Africa 0.5 0.5 0.6 0.6 0.8 0.8 0.9 1.0 1.3 1.4 10.84 Americas 1.8 1.8 2.1 2.2 2.4 2.4 2.5 2.5 2.6 2.9 4.88 Asia 32.4 34.2 36.9 39.2 41.8 44.2 47.0 49.5 52.4 55.5 5.53 Europe 2.0 2.2 2.2 2.1 2.2 2.4 2.3 2.5 2.5 2.7 3.04 Australia 0.1 0.1 0.1 0.2 0.2 0.2 0.2 0.2 0.2 0.2 7.17 In Million Tonnes Source-FAOCAGR-Compound Annual Growth Rate
- 7. Top 10 Aquaculture Producing Countries Sr no. Country Production Sr no. Country Production 1 China 3,67,34,215 1 China 3,86,21,269 2 India 37,85,779 2 India 45,73,465 3 Vietnam 26,71,800 3 Vietnam 28,45,600 4 Indonesia 23,04,828 4 Indonesia 27,18,421 5 Bangladesh 13,08,515 5 Bangladesh 15,23,759 6 Thailand 12,86,122 6 Norway 11,38,797 7 Norway 10,08,010 7 Thailand 10,08,049 8 Egypt 9,19,585 8 Egypt 9,86,820 9 Myanmar 8,50,697 9 Chile 9,54,845 10 Philippines 7,44,695 10 Myanmar 8,16,820 In tonnes Year- 2010 Year- 2011 Source- FAO
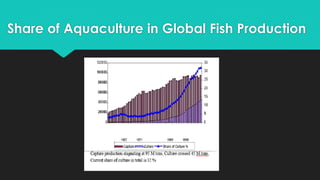
- 8. Share of Aquaculture in Global Fish Production
- 9. Top Species in Aquaculture Production Species group 2009 2010 Linear Growth (Tonnes) Carps and other cyprinids 1,66,73,155 1,83,03,847 8.9 Oysters 43,32,357 46,03,717 5.89 Clams, cockles 34,57,510 41,16,839 16.01 Miscellaneous freshwater fishes 37,63,902 37,39,949 -0.64 Shrimps, prawns 14,95,950 24,76,023 39.58 Salmons, Trouts 17,91,061 19,78,109 9.45 Mussels 17,00,871 18,60,249 8.56 Tilapias and other cichlids 14,83,309 18,22,745 18.62 Miscellaneous marine molluscs 12,89,586 14,65,191 11.98
- 10. Introduction Indian fisheries and aquaculture is an important sector of food production. It provides nutritional security to the food basket, contributing to the agricultural exports and engaging about fourteen million people in different activities. With diverse resources ranging from deep seas to lakes in the mountains and more than 10% of the global biodiversity in terms of fish and shellfish species, the country has shown continuous and sustained increments in fish production since independence.
- 11. Increasing food production especially of animal protein and achieving self sufficiency in aquatic product supplies. Generating new source of employment in rural area including part time employment of farmer and small scale fishery and arresting migration of people from rural to urban areas. Producing food near consumer centre in rural area thus contributing to improvement of human nutrition. Earning foreign exchange through export or saving foreign exchange through import substitution.
- 12. BLUE Revolution The term “Blue revolution" refers to the remarkable emergence of aquaculture as an important and highly productive agricultural activity. Aquaculture refers to all forms of active culturing of aquatic animals and plants, occurring in marine and fresh waters. Many Species of freshwater and marine organisms are being cultivated as highly productive and nutritious crops for consumption by humans. It is the rapid expansion of intensive, commercial aquaculture, It Came in a decade after the Green Revolution (1970s; chemical-based agriculture) Increase global food production and reduce widespread hunger.
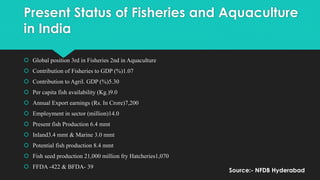
- 13. Present Status of Fisheries and Aquaculture in India Global position 3rd in Fisheries 2nd in Aquaculture Contribution of Fisheries to GDP (%)1.07 Contribution to Agril. GDP (%)5.30 Per capita fish availability (Kg.)9.0 Annual Export earnings (Rs. In Crore)7,200 Employment in sector (million)14.0 Present fish Production 6.4 mmt Inland3.4 mmt & Marine 3.0 mmt Potential fish production 8.4 mmt Fish seed production 21,000 million fry Hatcheries1,070 FFDA -422 & BFDA- 39 Source:- NFDB Hyderabad
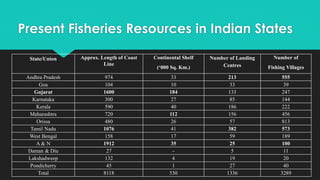
- 14. Present Fisheries Resources in Indian States State/Union Approx. Length of Coast Line Continental Shelf (‘000 Sq. Km.) Number of Landing Centres Number of Fishing Villages Andhra Pradesh 974 33 213 555 Goa 104 10 33 39 Gujarat 1600 184 133 247 Karnataka 300 27 85 144 Kerala 590 40 186 222 Maharashtra 720 112 156 456 Orissa 480 26 57 813 Tamil Nadu 1076 41 382 573 West Bengal 158 17 59 189 A & N 1912 35 25 100 Daman & Diu 27 - 5 11 Lakshadweep 132 4 19 20 Pondicherry 45 1 27 40 Total 8118 530 1336 3289
- 15. Reported aquaculture production in India (from 1950) 0 500000 1000000 1500000 2000000 2500000 3000000 3500000 4000000 4500000 5000000 1950 S_1952 1955 S_1957 1960 S_1962 1965 S_1967 1970 S_1972 1975 S_1977 1980 S_1982 1985 S_1987 1990 S_1992 1995 S_1997 2000 S_2002 2005 S_2007 2010 S_2012 India FAO - Fisheries and Aquaculture Information and Statistics Service - 14/04/2015
- 16. Major Markets and their Share (EXPORT)
- 17. Share of shrimp in India’s total exports
- 18. Market-wise export of Fr. Shrimp
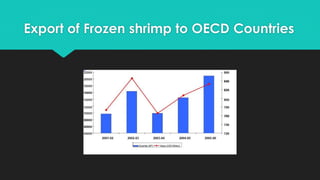
- 19. Export of Frozen shrimp to OECD Countries
- 20. Progress in India’s Seafood Export 1981-----------------------------------------------------2006
- 21. Disadvantages 1.Market access issues 2.Food safety issues 3.Environmental issues
- 22. Tariff escalation Value added products attract higher tariff levels. This perpetuates the dominance of Developed countries in the production and marketing of value-added products
- 23. Supermarkets Increased dominance of supermarkets in retail trade in fish and value-added products Entry barriers create difficulty in accessing supermarkets Supply logistics difficult for a new entrant. Shelf space expensive High costs of market promotion Brand barrier. Acquisition of brands prohibitively expensive
- 24. Non-Tariff Barriers The detection levels for chloramphenicol and Nitrofurans necessitate heavy investment in analytical equipment. Japanese market also becoming more sensitive to residues Rejection of shrimp consignments lead to financial crisis for the export industry
- 25. Measures to meet the challenges Short term measures: Notification banning the use of anti biotics in hatcheries ,farms etc Village level campaigns against use of anti-biotics and other pharmacologically active substances in shrimp farms
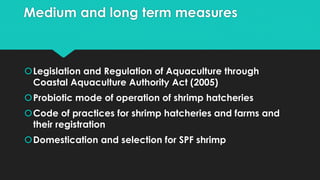
- 26. Medium and long term measures Legislation and Regulation of Aquaculture through Coastal Aquaculture Authority Act (2005) Probiotic mode of operation of shrimp hatcheries Code of practices for shrimp hatcheries and farms and their registration Domestication and selection for SPF shrimp
- 27. Traceability Since farming is highly fragmented, traceability becomes difficult. Certification becomes unaffordable Comprehensive database on shrimp farms in the country under preparation Assigning identification code to individual farms GIS mapping of farms in association with National Remote Sensing Agency
- 28. Value Addition Value addition key to betterment of farmers Investment needed in processing Technology up-gradation Access to retail chains difficult for small& medium exporters Better brand equity needed.
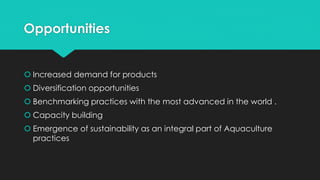
- 29. Opportunities Increased demand for products Diversification opportunities Benchmarking practices with the most advanced in the world . Capacity building Emergence of sustainability as an integral part of Aquaculture practices
- 30. Role of FAO Fish Technologists & Processors in developing countries, to introduce appropriate technologies for reducing fish spoilage. Fish processors in the fundamentals of quality, use of ice, hygiene, etc. Improves handling practices on fish landing sites & fish preservation methods. Improves fish consumption from low-value resources.
- 31. Future Prospects Increasing demand: The increasing demand for fish will require more production, and the supply from capture fisheries is static. Emergence of the sector: Aquaculture has become recognized as a growth sector of economic importance in many countries and has attracted the attention of the private and public sectors. Culture-based fisheries: Stocking of reservoirs and enhancement/rehabilitation of fisheries will gain importance with time, particularly as cost/benefit problems are resolved.
- 32. Growing awareness of sustainability needs There is a rapidly growing awareness of the need to ensure the sustainability of the sector in the long term. Public debate involving all stakeholders, national and international efforts to arrive at practical guidelines for sustainable practices. Technical efforts to improve the sustainability of some aquaculture systems, are positive responses to challenges and will yield constructive results in the medium and long term.
- 33. The Way Forward Value addition of seafood products „ More FDI inflow in Seafood sector „ Promotion of Brand equity Promotion of Organic Shrimp