


GIS for traffic management system
- 1. GIS FORTRAFFIC MANAGEMENT SYSTEM BY SOURABH JAIN
- 2. Introduction • Traffic management is the planning, monitoring and control or influencing of traffic. • The Traffic Systems Management Program (TSM) is used to increase the capacity of State and local transportation systems by increasing the number of peak-hour person-trips by improving existing facilities without major construction.
- 3. Objectives • Ensure reliable and safe operation of transport. • Ensure fair allocation of infrastructure space (road space, rail slots, etc.) among competing users. • Improving the travelling mobility. • Conserving the energy while protecting the environment.
- 4. Need of Traffic Management
- 6. Role of GIS in TMS GIS Plays Significant Role In Each Field Of Traffic Management. Some Of These Fields Are ……….. • Providing Alternate Routes To Road Users. • Providing Necessary Information To Passengers. • For Proper Signal Control. • Minimizing Accidents. • Reduction Of Congestion Spots.
- 7. ACCIDENT MINIMIZATION • Accidents Can Be Minimize Through GIS By Generating A Data Base Of Most Accidents Prone Spots (Crash Spots). • Information Can Be Provided Either In Tabular Or Graphical Format To The Users. • Drivers Become Extra Cautious At Such Spots Hence Free Flow Can Be Maintained.
- 8. METHODOLOGY • Load Pedestrian-vehicle Crash Data And Segregate The Data At Each Location • Compute A Severity Index At Each Location. • Examine The Spatial Patterns Of The Pedestrian-vehicle Crash Data. • Create A Pedestrian-vehicle Crash Hot Spots Map. • Load The Bus Stop Data And Identify Bus Stops In Hot Spots Areas. • Compute Severity Indices And Rank Unsafe Bus Stops.
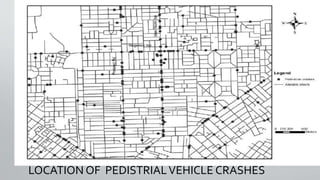
- 9. LOCATION OF PEDISTRIALVEHICLE CRASHES
- 10. DISTRIBUTION OF SEVERITY INDICES
- 12. UNSAFE BUS STOP IN HOT SPOT AREA
- 13. PASSENGER INFORMATION SYSTEM • Passenger Information System design for multi-modal transit system that integrates GIS, Network Analysis, user interfacing and database management. • PIS gives answers to user queries like : Locations and street address Optimum path based on time Optimum path on cost Optimum path based on dist. Trip making information Schedule of public transit Fare Enquiry
- 14. Three-tier Architecture for Passenger Information System
- 15. QUERY PROCEDURE IN A PIS
- 16. CASE STUDY A GIS Approach to Identify Road Network Improvement Needs By: Chandimal and Wijesekera
- 17. Study Area Kaduwela region which is located in the western province of Sri Lanka
- 18. • Aim Of The Study Is To Identify Improvements That Should Be Made To The Road Network In Order To Reduce Wastage Of Time, Fuel, And Other Valuable Resources. • GIS Is To Incorporates Spatial Variation Of Roads, Road Condition And Population In The Context Of Road Network Accessibility And Road Service Accessibility.
- 19. Methodology
- 22. Spatial Data Layers Used In The Study
- 23. Road feeder clusters in the study area
- 24. Proximity to Road layer in the study area
- 26. Affected road index values in different zone Spatial accessibility indicator for project area
- 27. CONCLUSION • The higher the Total Spatial Accessibility Indicator (TSAI) the higher is the easiness to access. • The higher the ARI the higher is the need to provide assistance to develop the roads in a particular land extent. • Higher the NPA higher would be the time taken to access a location through that a pathway. • A simple model developed for Kaduwela area presented the potential of GIS in the assessment of accessibility, thereby identifying the zones with various degrees of accessibility.
- 28. REFRENCES • A GIS Approach To Identify Road Network Improvement Needs – Case Study Of Kaduwela (Sri Lanka) by Chandimal W. P. A. I. M and Wijesekera N.T.S. • www.trafficinfratech.com • tanmoy.chakrabarty@tcs.com • NPTEL Web Course
- 29. Thank you 4 your attention !