Location via proxy:   [ UP ]  
[Report a bug]   [Manage cookies]                
SlideShare a Scribd company logo

1

(c) AZOTH Analytics
December 2015
Global Alzheimer’s Drug Market: Trends, Opportunities and
Forecasts (2015-2020)
1

2

(c) AZOTH Analytics
Table of Content
Figure No. Title Page No.
1 Research Methodology
2 Alzheimer’s Disease Market Overview
3 Global Alzheimer’s Disease Market Outlook
4 Global Alzheimer’s Disease Market
4.1 By Therapeutics
4.2 By Diagnostics and Biomarkers
4.3 By Imaging Sector
4.4 By Disease Modifying Therapeutics
5 Global Alzheimer’s Disease Market Outlook-By Demographic (Age-Group)
6 Global Alzheimer’s Disease Market Outlook-By Drug
6 Global Alzheimer’s Disease Market Outlook-By Region
7 United States Alzheimer’s Disease Market Outlook
7.1 United States Dementia Market Outlook
8 Global Dementia Disease Market Outlook
9 Global Dementia Disease Market Outlook,
9.1 By Regional Break-Up
9.1.1 Asia-Pacific Dementia Market Outlook
9.1 By Countries
9.2.2 Low Income Country -wise Break up
9.2.3 Top Ten Country-wise Break-Up
2

3

(c) AZOTH Analytics
Table of Content
Figure
No.
Title Page No.
9.3 Australia Dementia Market Outlook
9.4 UK Dementia Market Outlook
10 Market Dynamics
10.1 Drivers
10.2 Challenges
11 Market Trends & Developments
12 Competitive Landscape
12.2 Sales Comparatives, Top 5 Companies
12.3 EBITDA Comparatives, Top 5 Companies
12.4 EBIT Comparatives, Top 5 Companies
12.5 PBT Comparatives, Top 5 Companies
12.6 PAT Comparatives, Top 5 Companies
12.7 Current Ratio Comparatives, Top 5 Companies
12 Company Profiling
Pfizer Inc.
Novartis International AG
Axovant Sciences Ltd.
Acadia Pharmaceuticals
Biotie Therapies
3

4

(c) AZOTH Analytics
Table of Content
Figure
No.
Title Page No.
12.8 Profit Margin Ratio Comparatives, Top 5 Companies
12.9 Debt-Equity Ratio Comparatives, Top 5 Companies
13 About Us & Disclaimer
4

5

(c) AZOTH Analytics
List of Figures
Figure No. Title Page No.
Figure 1: Global Alzheimer’s Disease Market Size ,By Value (USD Billion) and Volume (Number of Patients in
Million) 2010-2020F
Figure 2: Global Alzheimer’s Disease Market by Therapeutics ,By Value (USD Million) 2010-2020F
Figure 3: Global Alzheimer’s Market share, By Therapeutics
Figure 4: Global Alzheimer’s Disease Market , By Diagnostics and Biomarkers ,By Value (USD Billion)
Figure 5: Global Alzheimer’s Disease Market, By Imaging Sector, By Value (USD Million)x`
Figure 6: Global Alzheimer’s Disease Market by Disease Modifying Therapeutics Market Size ,By Value (USD
Million)
Figure 7: Global Alzheimer’s Disease Market, By Demographics, By Age < 65, By Volume (Number of patients in
million),2010-2020F
Figure 8: Global Alzheimer’s Disease Market, By Demographics, By Age > 65, By Volume (Number of patients in
million),2010-2020F
Figure 9: Global Memantine (Nameda) Drug Market Size ,By Value (USD Billion) and Volume (Number of Patients
in Million) 2010-2020F
Figure 10: United States Dementia Disease Market Size ,By Value (USD Million) and Volume (Number of Patients
In Million) 2010-2020F
Figure 11: Cost of Alzheimer Disease in United States, By Payer, By percentage, 2010-14
Figure 12: U.S. Alzheimer’s Drug RTV-101 Market , By Value & Penetration Rate; 2019-2027 (USD Million)
Figure 13: U.S. Alzheimer’s Drug Azeliragon Market, By Value & Penetration Rate, 2019-2027 (USD Million)
Figure 14: U.S. Annual Alzheimer’s Death Rates ,By Age; 2006-2013
Figure 15: U.S. Annual Alzheimer’s Death Rates ,By Age; 2006-2013
5

6

(c) AZOTH Analytics
List of Figures
Figure No. Title Page No.
Figure 16: Global Dementia Disease Market Size ,By Value (USD Million) and Volume (Number of Patients In
Million) 2010-2020F
Figure 17: Global Dementia Disease Market Size , By Volume (Number of Patients In Million), By Region 2014
Figure 18: Global Dementia Disease Market Size , By Number of new cases, By Volume (Number of Patients In
Million), By Region 2014
Figure 19: Asia-Pacific Dementia Disease Market Size , By Volume (Number of Patients In Million), By country
2015E,2030F,2050F
Figure 20: Global Dementia Disease Market Size , By Volume (Number of Patients In Million), By Region 2014
Figure 21: Global Dementia Disease Market Size Low Income Countries ,Volume (Number of Patients In Million)
2010-2020F
Figure 22: Global Dementia Disease Market Size Low Income Countries ,Volume (Number of Patients In Million)
2010-2020F
Figure 23: Global Dementia Disease Market Size in Top Ten Countries ,Volume (Number of Patients In Million)
2010-2020F
Figure 24: Australia Dementia Disease Market Size , By Volume (Number of Patients In Million) 2010-2020F
Figure 25: Australia Dementia Disease Market Size , By Volume (Number of Patients In Million) 2010-2020F
Figure 26: UK Dementia Market, By Type, 2014 (%)
Figure 27: UK Dementia Cost, By Type of Service, 2014 (%)
Figure 28: Number of Unpaid Caregivers (In Million)
Figure 29: Pfizer Revenue (USD Million) AY 2011-2014
Figure 30: Pfizer Percentage Revenue, By Business Segment (2014)
Figure 31: Pfizer Percentage Revenue, By Geography (2014)
6

7

(c) AZOTH Analytics
List of Figures
Figure No. Title Page No.
Figure 32: Novartis International AG Revenue (USD Million) AY 2011-2014
Figure 33: Novartis International AG Percentage Revenue, By Business Segment (2014)
Figure 34: Novartis International AG Percentage Revenue, By Geography (2014)
Figure 35: Axovant Services Ltd. Revenue (USD Million) FY 2011-2015
Figure 36: Axovant Services Ltd. Percentage Revenue, By Business Segment (2014)
Figure 37: Axovant Services Ltd. Percentage Revenue, By Geography (2014)
Figure 38: Acadia Pharmaceuticals Revenue (USD Million) AY 2011-2014
Figure 39: Acadia Pharmaceuticals Percentage Revenue, By Business Segment (2014)
Figure 40: Acadia Pharmaceuticals Percentage Revenue, By Geography (2014)
Figure 41: Biotie Therapies Revenue (USD Million) AY 2011-2014
Figure 42: Biotie Therapies Percentage Revenue, By Business Segment (2014)
Figure 43: Sales Comparatives, Top 5 Companies, 2011-2014
Figure 44: EBITDA Comparatives, Top 5 Companies, 2011-2015
Figure 45: EBIT Comparatives, Top 5 Companies, 2011-2015
Figure 46: PBT Comparatives, Top 5 Companies, 2011-2015
Figure 47: PAT Comparatives, Top 5 Companies, 2011-2015
Figure 48: Current Ratio Comparatives, Top 5 Companies, 2011-2015
Figure 49: Profit Margin Ratio Comparatives, Top 5 Companies, 2011-2015
Figure 50: Debt Equity Ratio Comparatives, Top 5 Companies, 2011-2015
7

8

(c) AZOTH Analytics
Research Methodology
Research Definition
•Global Alzheimer’s disease Market Report comprises of the study of various aspects of Alzheimer’s Market and
forecast until 2020. The Alzheimer Disease Market has been segmented on basis of type of disease and type of
medical ailment and on regional basis globally.
Data Analysis and Interpretation
•Our historic market trend has been figured out by various paid databases which was further triangulated with various
secondary research sources along with primary interviews with the industry professionals/experts. Back-of-the-
Envelope calculation for the market estimation has been made through proper understanding of the market as well
as future business strategies of the companies involved in the market.
Azoth Analytics has conducted quantitative as well as qualitative research to gather market insights such as market sizing, market
segmentation, recent trends and developments and competitive landscape. Our team has conducted extensive primary surveys by
reaching out industry experts across the Alzheimer’s disease market.
For Forecasting purposes, we have accessed some of the paid databases such as Bloomberg, Reuters, Factiva, and Hoovers.
Companies Contacted
Pfizer Inc., Novartis International AG, Axovant Sciences Ltd.,Acadia Pharmaceuticals, Biotie Therapies
8

9

(c) AZOTH Analytics
Alzheimer’s Disease Market Overview
9
xx
xx
xx xx xx xx xx xx xx xx xx xxxx xx xx xx xx xx xx xx xx xx xx xx
2010 2011 2012 2013 2014 2015E 2016F 2017F 2018F 2019F 2020F
Market Value Number of Patients
Figure 1: Global Alzheimer’s Disease Market Size ,By Value (USD Billion) and Volume (Number of Patients in
Million) 2010-2020F
xx xx xx xx xx xx xx xx xx xx xx
2010 2011 2012 2013 2014 2015E 2016F 2017F 2018F 2019F 2020F
Figure 2: Global Alzheimer’s Disease Market by Therapeutics ,By Value (USD Million) 2010-2020F

10

(c) AZOTH Analytics
Alzheimer’s Disease Market Overview
10
xx
xxxx
xx
Disease Modifying
Therapeutics
Diagonistics and Bio
Markers
Imaging Sector
Therapeutics for
treatment of symtoms
Figure 3: Global Alzheimer’s Market share, By
Therapeutics
xx xx xx xx xx xx xx xx xx xx xx
2010 2011 2012 2013 2014 2015 2016 2017 2018 2019 2020
Figure 9: Global Memantine (Nameda) Drug Market Size ,By Value (USD Billion) and Volume (Number of
Patients in Million) 2010-2020F
xx
xxxx
xx
xx
Asia Pacific America's Europe Africa Row
Figure 3: Global Alzheimer’s Market share, By Region,
2014(In %)

11

(c) AZOTH Analytics
Alzheimer’s Disease Market Overview
11
xx
xx
xx
xx
xx
xx
xx
xx
xx
xx
xx
xx
xx
xx
xx
xx
xx
xx
xx
xx
0%
2%
4%
6%
8%
10%
12%
14%
2010 2011 2012 2013 2014
Medicare Medicade Out of Pocket Other
Figure 11: Cost of Alzheimer Disease in United States, By Payer, By percentage, 2010-14
xx xx xx
xx xx xx xx xx xx Xx
0.00
10.00
20.00
30.00
40.00
50.00
60.00
Figure 15: U.S. Annual Alzheimer’s Death Rates ,By Age; 2006-2013

12

(c) AZOTH Analytics
Alzheimer’s Disease Market Overview
12
xx
xx
xx xx xx xx xx xx xx xx xxxx xx xx xx xx xx xx xx xx xx xx
2010 2011 2012 2013 2014 2015E 2016F 2017F 2018F 2019F 2020F
Number of Patients Value of the market
Figure 17: Global Dementia Disease Market Size ,By Value (USD Million) and Volume (Number of Patients In
Million) 2010-2020F
xx
xx
xx
xx
Asia
Pacific
Europe The
America's
Africa
Figure 17: Global Dementia Disease Market Size , By
Volume (Number of Patients In Million), By Region
2014
xx
xx
xx
xx
Asia
Pacific
Europe The
America's
Africa
Figure 18: Global Dementia Disease Market Size , By
Number of new cases, By Volume (Number of Patients
In Million), By Region 2014

13

(c) AZOTH Analytics
Alzheimer’s Disease Market Overview
13
xx xx xx xx xx xx xx xx xx xx xx
2010 2011 2012 2013 2014 2015E 2016F 2017F 2018F 2019F 2020F
Figure 22: Global Dementia Disease Market Size Low Income Countries ,Volume (Number of Patients In Million)
2010-2020F
xx xx xx xx xx xx xx xx xx xx xx
2010 2011 2012 2013 2014 2015E 2016F 2017F 2018F 2019F 2020F
Figure 22: Global Dementia Disease Market Size High Income Countries ,Volume (Number of Patients In Million)
2010-2020F

14

(c) AZOTH Analytics
Alzheimer’s Disease Market Overview
14
xx
xx xx xx
xx xx xx xx xx xx
China US India Japan Brazil Germany Russia Italy Indonesia France
Figure 23: Global Dementia Disease Market Size in Top Ten Countries ,Volume (Number of Patients In Million)
2010-2020F
xx
xx
xx xx xx xx xx xx xx xx xx
2010 2011 2012 2013 2014 2015E2016F2017F2018F2019F2020F
Figure 24: Australia Dementia Disease Market Size , By Volume
(Number of Patients In Million) 2010-2020F
Alzheimer's
Disease
Vascular
Dementia
Mixed
Dementia
Dementia
with Lewy
Bodies
Frontotemp
oral
DementiaSource: Azoth Analytics
Figure 26: UK Dementia Market, By
Type, 2014 (%)

15

(c) AZOTH Analytics
Global Alzheimer’s Drug Market: Trends, Opportunities and Forecasts (2015-2020)
(By Type - Imaging, Therapeutics, Diagnostics, Biomarkers; By Age: <65 years, >65 years age; By Region; Global Dementia Market)
Number of Pages: 106
Price: US$ 2000 (Single User)
Price: US$ 3000 (Multi-User)
Order Online:
http://www.azothanalytics.com/report/global-alzheimer%E2%80%99s-drug-market-trends-opportunities-and-forecasts-2015-2020-r4
Contact Details
Contact Person: Subhodeep Sen
E-mail: info@azothanalytics.com
Phone Number: Tel: +91 120 429 8235
24/7 Helpline Number: +91 9873 4262 88
About Azoth Analytics Pvt Ltd.
Our business research and market analysis helps organizations across different industry verticals solve their business problems. In our
reports, historic market trend is figured out by various paid databases which is further triangulated with inputs and insights from industry
experts through primary research. Back-of-the-Envelope calculation for the market estimation is being made through proper
understanding of the market as well as future business strategies of the companies engaged in the market. Our detailed research reports
help our clients and customers get clear understanding of a specific industry or vertical of a designated country or region and make
informed decision pertaining to market entry or expansion, strategic alliances or partnerships, product launch or brand positioning.
15

More Related Content

Global Alzheimer's Drug Market Trends Opportunities and Forecasts (2015-2020)

  • 1. (c) AZOTH Analytics December 2015 Global Alzheimer’s Drug Market: Trends, Opportunities and Forecasts (2015-2020) 1
  • 2. (c) AZOTH Analytics Table of Content Figure No. Title Page No. 1 Research Methodology 2 Alzheimer’s Disease Market Overview 3 Global Alzheimer’s Disease Market Outlook 4 Global Alzheimer’s Disease Market 4.1 By Therapeutics 4.2 By Diagnostics and Biomarkers 4.3 By Imaging Sector 4.4 By Disease Modifying Therapeutics 5 Global Alzheimer’s Disease Market Outlook-By Demographic (Age-Group) 6 Global Alzheimer’s Disease Market Outlook-By Drug 6 Global Alzheimer’s Disease Market Outlook-By Region 7 United States Alzheimer’s Disease Market Outlook 7.1 United States Dementia Market Outlook 8 Global Dementia Disease Market Outlook 9 Global Dementia Disease Market Outlook, 9.1 By Regional Break-Up 9.1.1 Asia-Pacific Dementia Market Outlook 9.1 By Countries 9.2.2 Low Income Country -wise Break up 9.2.3 Top Ten Country-wise Break-Up 2
  • 3. (c) AZOTH Analytics Table of Content Figure No. Title Page No. 9.3 Australia Dementia Market Outlook 9.4 UK Dementia Market Outlook 10 Market Dynamics 10.1 Drivers 10.2 Challenges 11 Market Trends & Developments 12 Competitive Landscape 12.2 Sales Comparatives, Top 5 Companies 12.3 EBITDA Comparatives, Top 5 Companies 12.4 EBIT Comparatives, Top 5 Companies 12.5 PBT Comparatives, Top 5 Companies 12.6 PAT Comparatives, Top 5 Companies 12.7 Current Ratio Comparatives, Top 5 Companies 12 Company Profiling Pfizer Inc. Novartis International AG Axovant Sciences Ltd. Acadia Pharmaceuticals Biotie Therapies 3
  • 4. (c) AZOTH Analytics Table of Content Figure No. Title Page No. 12.8 Profit Margin Ratio Comparatives, Top 5 Companies 12.9 Debt-Equity Ratio Comparatives, Top 5 Companies 13 About Us & Disclaimer 4
  • 5. (c) AZOTH Analytics List of Figures Figure No. Title Page No. Figure 1: Global Alzheimer’s Disease Market Size ,By Value (USD Billion) and Volume (Number of Patients in Million) 2010-2020F Figure 2: Global Alzheimer’s Disease Market by Therapeutics ,By Value (USD Million) 2010-2020F Figure 3: Global Alzheimer’s Market share, By Therapeutics Figure 4: Global Alzheimer’s Disease Market , By Diagnostics and Biomarkers ,By Value (USD Billion) Figure 5: Global Alzheimer’s Disease Market, By Imaging Sector, By Value (USD Million)x` Figure 6: Global Alzheimer’s Disease Market by Disease Modifying Therapeutics Market Size ,By Value (USD Million) Figure 7: Global Alzheimer’s Disease Market, By Demographics, By Age < 65, By Volume (Number of patients in million),2010-2020F Figure 8: Global Alzheimer’s Disease Market, By Demographics, By Age > 65, By Volume (Number of patients in million),2010-2020F Figure 9: Global Memantine (Nameda) Drug Market Size ,By Value (USD Billion) and Volume (Number of Patients in Million) 2010-2020F Figure 10: United States Dementia Disease Market Size ,By Value (USD Million) and Volume (Number of Patients In Million) 2010-2020F Figure 11: Cost of Alzheimer Disease in United States, By Payer, By percentage, 2010-14 Figure 12: U.S. Alzheimer’s Drug RTV-101 Market , By Value & Penetration Rate; 2019-2027 (USD Million) Figure 13: U.S. Alzheimer’s Drug Azeliragon Market, By Value & Penetration Rate, 2019-2027 (USD Million) Figure 14: U.S. Annual Alzheimer’s Death Rates ,By Age; 2006-2013 Figure 15: U.S. Annual Alzheimer’s Death Rates ,By Age; 2006-2013 5
  • 6. (c) AZOTH Analytics List of Figures Figure No. Title Page No. Figure 16: Global Dementia Disease Market Size ,By Value (USD Million) and Volume (Number of Patients In Million) 2010-2020F Figure 17: Global Dementia Disease Market Size , By Volume (Number of Patients In Million), By Region 2014 Figure 18: Global Dementia Disease Market Size , By Number of new cases, By Volume (Number of Patients In Million), By Region 2014 Figure 19: Asia-Pacific Dementia Disease Market Size , By Volume (Number of Patients In Million), By country 2015E,2030F,2050F Figure 20: Global Dementia Disease Market Size , By Volume (Number of Patients In Million), By Region 2014 Figure 21: Global Dementia Disease Market Size Low Income Countries ,Volume (Number of Patients In Million) 2010-2020F Figure 22: Global Dementia Disease Market Size Low Income Countries ,Volume (Number of Patients In Million) 2010-2020F Figure 23: Global Dementia Disease Market Size in Top Ten Countries ,Volume (Number of Patients In Million) 2010-2020F Figure 24: Australia Dementia Disease Market Size , By Volume (Number of Patients In Million) 2010-2020F Figure 25: Australia Dementia Disease Market Size , By Volume (Number of Patients In Million) 2010-2020F Figure 26: UK Dementia Market, By Type, 2014 (%) Figure 27: UK Dementia Cost, By Type of Service, 2014 (%) Figure 28: Number of Unpaid Caregivers (In Million) Figure 29: Pfizer Revenue (USD Million) AY 2011-2014 Figure 30: Pfizer Percentage Revenue, By Business Segment (2014) Figure 31: Pfizer Percentage Revenue, By Geography (2014) 6
  • 7. (c) AZOTH Analytics List of Figures Figure No. Title Page No. Figure 32: Novartis International AG Revenue (USD Million) AY 2011-2014 Figure 33: Novartis International AG Percentage Revenue, By Business Segment (2014) Figure 34: Novartis International AG Percentage Revenue, By Geography (2014) Figure 35: Axovant Services Ltd. Revenue (USD Million) FY 2011-2015 Figure 36: Axovant Services Ltd. Percentage Revenue, By Business Segment (2014) Figure 37: Axovant Services Ltd. Percentage Revenue, By Geography (2014) Figure 38: Acadia Pharmaceuticals Revenue (USD Million) AY 2011-2014 Figure 39: Acadia Pharmaceuticals Percentage Revenue, By Business Segment (2014) Figure 40: Acadia Pharmaceuticals Percentage Revenue, By Geography (2014) Figure 41: Biotie Therapies Revenue (USD Million) AY 2011-2014 Figure 42: Biotie Therapies Percentage Revenue, By Business Segment (2014) Figure 43: Sales Comparatives, Top 5 Companies, 2011-2014 Figure 44: EBITDA Comparatives, Top 5 Companies, 2011-2015 Figure 45: EBIT Comparatives, Top 5 Companies, 2011-2015 Figure 46: PBT Comparatives, Top 5 Companies, 2011-2015 Figure 47: PAT Comparatives, Top 5 Companies, 2011-2015 Figure 48: Current Ratio Comparatives, Top 5 Companies, 2011-2015 Figure 49: Profit Margin Ratio Comparatives, Top 5 Companies, 2011-2015 Figure 50: Debt Equity Ratio Comparatives, Top 5 Companies, 2011-2015 7
  • 8. (c) AZOTH Analytics Research Methodology Research Definition •Global Alzheimer’s disease Market Report comprises of the study of various aspects of Alzheimer’s Market and forecast until 2020. The Alzheimer Disease Market has been segmented on basis of type of disease and type of medical ailment and on regional basis globally. Data Analysis and Interpretation •Our historic market trend has been figured out by various paid databases which was further triangulated with various secondary research sources along with primary interviews with the industry professionals/experts. Back-of-the- Envelope calculation for the market estimation has been made through proper understanding of the market as well as future business strategies of the companies involved in the market. Azoth Analytics has conducted quantitative as well as qualitative research to gather market insights such as market sizing, market segmentation, recent trends and developments and competitive landscape. Our team has conducted extensive primary surveys by reaching out industry experts across the Alzheimer’s disease market. For Forecasting purposes, we have accessed some of the paid databases such as Bloomberg, Reuters, Factiva, and Hoovers. Companies Contacted Pfizer Inc., Novartis International AG, Axovant Sciences Ltd.,Acadia Pharmaceuticals, Biotie Therapies 8
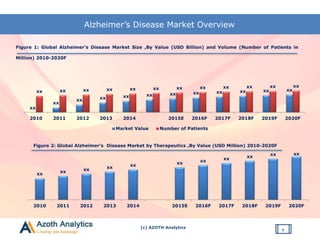
  • 9. (c) AZOTH Analytics Alzheimer’s Disease Market Overview 9 xx xx xx xx xx xx xx xx xx xx xx xxxx xx xx xx xx xx xx xx xx xx xx xx 2010 2011 2012 2013 2014 2015E 2016F 2017F 2018F 2019F 2020F Market Value Number of Patients Figure 1: Global Alzheimer’s Disease Market Size ,By Value (USD Billion) and Volume (Number of Patients in Million) 2010-2020F xx xx xx xx xx xx xx xx xx xx xx 2010 2011 2012 2013 2014 2015E 2016F 2017F 2018F 2019F 2020F Figure 2: Global Alzheimer’s Disease Market by Therapeutics ,By Value (USD Million) 2010-2020F
  • 10. (c) AZOTH Analytics Alzheimer’s Disease Market Overview 10 xx xxxx xx Disease Modifying Therapeutics Diagonistics and Bio Markers Imaging Sector Therapeutics for treatment of symtoms Figure 3: Global Alzheimer’s Market share, By Therapeutics xx xx xx xx xx xx xx xx xx xx xx 2010 2011 2012 2013 2014 2015 2016 2017 2018 2019 2020 Figure 9: Global Memantine (Nameda) Drug Market Size ,By Value (USD Billion) and Volume (Number of Patients in Million) 2010-2020F xx xxxx xx xx Asia Pacific America's Europe Africa Row Figure 3: Global Alzheimer’s Market share, By Region, 2014(In %)
  • 11. (c) AZOTH Analytics Alzheimer’s Disease Market Overview 11 xx xx xx xx xx xx xx xx xx xx xx xx xx xx xx xx xx xx xx xx 0% 2% 4% 6% 8% 10% 12% 14% 2010 2011 2012 2013 2014 Medicare Medicade Out of Pocket Other Figure 11: Cost of Alzheimer Disease in United States, By Payer, By percentage, 2010-14 xx xx xx xx xx xx xx xx xx Xx 0.00 10.00 20.00 30.00 40.00 50.00 60.00 Figure 15: U.S. Annual Alzheimer’s Death Rates ,By Age; 2006-2013
  • 12. (c) AZOTH Analytics Alzheimer’s Disease Market Overview 12 xx xx xx xx xx xx xx xx xx xx xxxx xx xx xx xx xx xx xx xx xx xx 2010 2011 2012 2013 2014 2015E 2016F 2017F 2018F 2019F 2020F Number of Patients Value of the market Figure 17: Global Dementia Disease Market Size ,By Value (USD Million) and Volume (Number of Patients In Million) 2010-2020F xx xx xx xx Asia Pacific Europe The America's Africa Figure 17: Global Dementia Disease Market Size , By Volume (Number of Patients In Million), By Region 2014 xx xx xx xx Asia Pacific Europe The America's Africa Figure 18: Global Dementia Disease Market Size , By Number of new cases, By Volume (Number of Patients In Million), By Region 2014
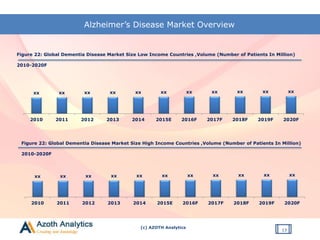
  • 13. (c) AZOTH Analytics Alzheimer’s Disease Market Overview 13 xx xx xx xx xx xx xx xx xx xx xx 2010 2011 2012 2013 2014 2015E 2016F 2017F 2018F 2019F 2020F Figure 22: Global Dementia Disease Market Size Low Income Countries ,Volume (Number of Patients In Million) 2010-2020F xx xx xx xx xx xx xx xx xx xx xx 2010 2011 2012 2013 2014 2015E 2016F 2017F 2018F 2019F 2020F Figure 22: Global Dementia Disease Market Size High Income Countries ,Volume (Number of Patients In Million) 2010-2020F
  • 14. (c) AZOTH Analytics Alzheimer’s Disease Market Overview 14 xx xx xx xx xx xx xx xx xx xx China US India Japan Brazil Germany Russia Italy Indonesia France Figure 23: Global Dementia Disease Market Size in Top Ten Countries ,Volume (Number of Patients In Million) 2010-2020F xx xx xx xx xx xx xx xx xx xx xx 2010 2011 2012 2013 2014 2015E2016F2017F2018F2019F2020F Figure 24: Australia Dementia Disease Market Size , By Volume (Number of Patients In Million) 2010-2020F Alzheimer's Disease Vascular Dementia Mixed Dementia Dementia with Lewy Bodies Frontotemp oral DementiaSource: Azoth Analytics Figure 26: UK Dementia Market, By Type, 2014 (%)
  • 15. (c) AZOTH Analytics Global Alzheimer’s Drug Market: Trends, Opportunities and Forecasts (2015-2020) (By Type - Imaging, Therapeutics, Diagnostics, Biomarkers; By Age: <65 years, >65 years age; By Region; Global Dementia Market) Number of Pages: 106 Price: US$ 2000 (Single User) Price: US$ 3000 (Multi-User) Order Online: http://www.azothanalytics.com/report/global-alzheimer%E2%80%99s-drug-market-trends-opportunities-and-forecasts-2015-2020-r4 Contact Details Contact Person: Subhodeep Sen E-mail: info@azothanalytics.com Phone Number: Tel: +91 120 429 8235 24/7 Helpline Number: +91 9873 4262 88 About Azoth Analytics Pvt Ltd. Our business research and market analysis helps organizations across different industry verticals solve their business problems. In our reports, historic market trend is figured out by various paid databases which is further triangulated with inputs and insights from industry experts through primary research. Back-of-the-Envelope calculation for the market estimation is being made through proper understanding of the market as well as future business strategies of the companies engaged in the market. Our detailed research reports help our clients and customers get clear understanding of a specific industry or vertical of a designated country or region and make informed decision pertaining to market entry or expansion, strategic alliances or partnerships, product launch or brand positioning. 15