Going Beyond the Device Heart Beat
- 1. Going Beyond the Device Heart Beat Balwinder Kaur, Principal Software Engineer OpenIoTSummit, San Diego, Apr 4, 2016
- 2. Agenda Copyright © 2015 AppDynamics. All rights reserved. 2 • Introduction • The Basics • An IoT World o Device Visibility o Application Visibility • Best Practices for End to End Performance Monitoring • Unique Challenges of IoT • Q&A • Summary Disclaimer "Opinions expressed are solely my own and do not express the views or opinions of my employer."
- 3. Introduction
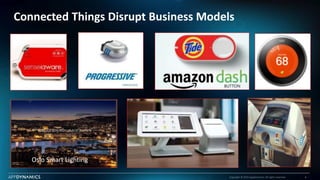
- 4. Connected Things Disrupt Business Models Copyright © 2015 AppDynamics. All rights reserved. 4 Oslo Smart Lighting
- 5. Copyright © 2015 AppDynamics. All rights reserved. 5 “IoT devices directly, or indirectly, impact the bottom line of a business."
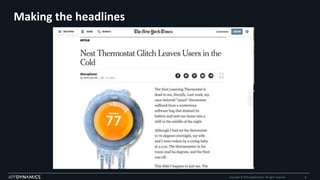
- 6. Making the headlines Copyright © 2015 AppDynamics. All rights reserved. 6
- 7. Copyright © 2015 AppDynamics. All rights reserved. 7 How do I prevent an NYT moment?
- 8. The Basics
- 9. The Device
- 10. What is an IoT Device? Copyright © 2015 AppDynamics. All rights reserved. 10 Traditional Embedded Device + Connectivity + Cloud Services
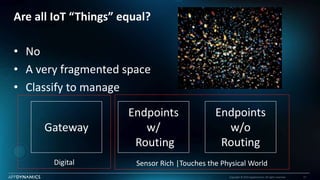
- 11. Are all IoT “Things” equal? Copyright © 2015 AppDynamics. All rights reserved. 11 • No • A very fragmented space • Classify to manage Gateway Endpoints w/ Routing Endpoints w/o Routing Sensor Rich |Touches the Physical WorldDigital
- 12. The Cloud
- 13. IT Teams Monitor Cloud Services Copyright © 2015 AppDynamics. All rights reserved. 13 Infrastructure Monitoring • Server Monitoring • Network Monitoring Application Performance Monitoring (APM) Systems • Web applications & containers • Database Performance • Byte Code Injection is popular Log Files Crash Reports
- 14. Application Performance Monitoring System Copyright © 2015 AppDynamics. All rights reserved. 14 “One of the most important steps in any application performance monitoring initiative is combining data from disparate monitoring "silos" into a correlation engine and dashboard. The dashboard makes data logs easier to read and saves IT staff from memory- dependent and error-prone manual correlation and analysis.” • Source: http://searchenterprisedesktop.techtarget.com/definition/Application- monitoring-app-monitoring
- 15. An IoT World
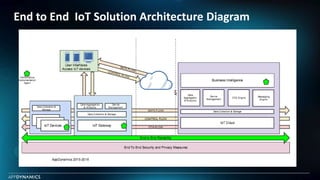
- 16. End to End IoT Solution Architecture Diagram
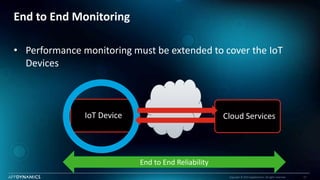
- 17. End to End Monitoring Copyright © 2015 AppDynamics. All rights reserved. 17 • Performance monitoring must be extended to cover the IoT Devices IoT Device Cloud Services End to End Reliability
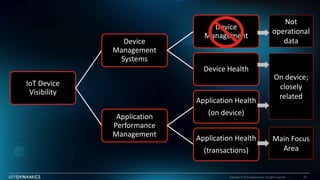
- 19. Copyright © 2015 AppDynamics. All rights reserved. 19 IoT Device Visibility Device Management Systems Device Management Device Health Application Performance Management Application Health (on device) Application Health (transactions) Not operational data On device; closely related Main Focus Area
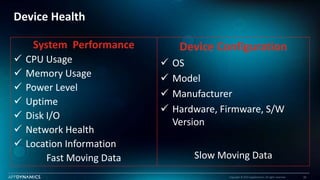
- 20. Device Health Copyright © 2015 AppDynamics. All rights reserved. 20 System Performance CPU Usage Memory Usage Power Level Uptime Disk I/O Network Health Location Information Fast Moving Data Device Configuration OS Model Manufacturer Hardware, Firmware, S/W Version Slow Moving Data
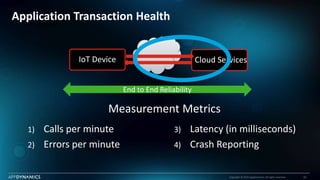
- 22. IoT Device Cloud Services End to End Reliability Application Transaction Health Copyright © 2015 AppDynamics. All rights reserved. 22 1) Calls per minute 2) Errors per minute 3) Latency (in milliseconds) 4) Crash Reporting Measurement Metrics
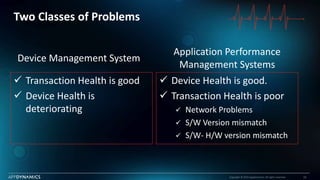
- 23. Two Classes of Problems Copyright © 2015 AppDynamics. All rights reserved. 23 Transaction Health is good Device Health is deteriorating Device Health is good. Transaction Health is poor Network Problems S/W Version mismatch S/W- H/W version mismatch Device Management System Application Performance Management Systems
- 24. Key Performance Indicator - MTTR 24 . Trapped Metrics Manual Correlation Manual Remediation Copyright © 2015 AppDynamics. All rights reserved. Major Reasons Contributing to a Poor MTTR (Mean-Time-to-Resolution) Gap between Operations and Engineering
- 25. Unified Dashboard Copyright © 2015 AppDynamics. All rights reserved. 25 Unified Monitoring Device Health Application Health Infrastructure Health IoT Device Cloud Services Device Management Systems APM Systems
- 26. End-to-End Performance Monitoring Best Practices for IoT
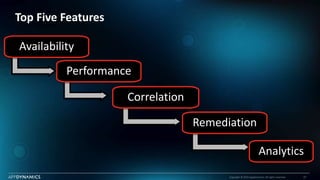
- 27. Top Five Features Copyright © 2015 AppDynamics. All rights reserved. 27 Performance Correlation Remediation Analytics Availability
- 28. Device Side Instrumentation Copyright © 2015 AppDynamics. All rights reserved. 28 Capture and report Device Metrics Capture and report Device Events
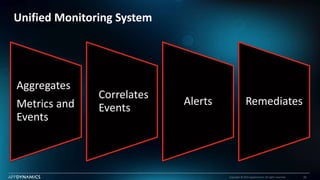
- 29. Unified Monitoring System Copyright © 2015 AppDynamics. All rights reserved. 29 Aggregates Metrics and Events Correlates Events Alerts Remediates
- 30. Unique Challenges that IoT brings (aka devil is in the details)
- 31. Choosing Instrumentation Agents for IoT Devices Copyright © 2015 AppDynamics. All rights reserved. 31 Web Agent Embedded Agent Message Payload Format JSON ProtoBuf, CBOR. BSON Application Layer HTTP/HTTPS MQTT/MQTT-SN, CoAP Security TLS DTLS Transport Layer TCP/UDP UDP Network Layer IPv4/IPv6 IPv6/ 6LowPAN Link Layer Ethernet, 802.11 802.15.4
- 32. Choosing Instrumentation Agents for IoT Devices (contd) Copyright © 2015 AppDynamics. All rights reserved. 32 • Small static and runtime memory footprint • Small disk usage. • Meets or exceeds security requirements of the IoT Device • Support for your favorite programming language.
- 33. Open Source Solutions Copyright © 2015 AppDynamics. All rights reserved. 33 • Prometheus.io :Open-source service monitoring system & time series database • Influxdata.com: Platform for managing, storing and visualizing time series data • Graphite : Real-time graphing system for numeric time-series data. • Graphana: Popular visualization library for multiple Time Series backends. • Plethora of open source tools to monitor performance or Device Health o top, vmstat, lsof, tcpdump , htop, iotop, monit, nagios, vmstat, perf_events • Tracing Tools like dtrace, LTTng (Open source tracing framework for Linux.)
- 34. Questions, Comments or Feedback
- 35. SUMMARY
- 36. Best Practices Monitor Device Health Understand what device data is important Understand what device applications are important Monitor End Devices and Gateways Monitor Application Transactions Health Monitor Cloud Services Embedded Agents should meet power, security and privacy requirements Unified View of the world reduces MTTR
- 37. Copyright © 2015 AppDynamics. All rights reserved. 37 A Heart Beat is Important. But do not be on Life Support. Stay IoT Healthy! balwinder.kaur@appdynamics.com
- 38. Thank You

