Google Data Studio - First impressions @ Measurecamp
- 1. Google Data Studio Special thanks to for these slides
- 2. 1. Role of visualiaation in decision-making 2. How to visualisation using Google Data Studio 3. Examples of Google Data Studio reports 4. Quiz Agenda
- 3. 1.Role of visualisation in decision-making
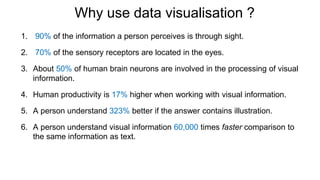
- 4. Why use data visualisation ? 1. 90% of the information a person perceives is through sight. 2. 70% of the sensory receptors are located in the eyes. 3. About 50% of human brain neurons are involved in the processing of visual information. 4. Human productivity is 17% higher when working with visual information. 5. A person understand 323% better if the answer contains illustration. 6. A person understand visual information 60,000 times faster comparison to the same information as text.
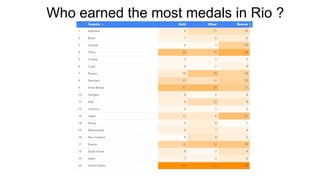
- 5. Who earned the most medals in Rio ?
- 6. Who earned the most medals in Rio ?
- 7. Who earned the most medals in Rio ?
- 8. Requirements for a visualization tool 1. Combining data from different sources 2. Data formulas & functions (computed metrics & parameters) 3. A wide selection of widgets & graphs 4. Style, design, interactive reports 5. Access to the record management 6. Simple intuitive interface
- 9. 2. Google Data Studio
- 10. Data Studio part of Google Analytics 360 Suite Tag Manager 360 - Data Collection Data Studio 360 Data Analysis and Visualization Analytics 360 Customer Insights Attribution 360 Marketing Measurement Optimize 360 Site Testing and Personalization Audience Center 360 Audience Management
- 11. What you need to know about Google Data Studio 1. 2nd June 2016 - US Public Beta 2. You can create reports and sources via a VPN 3. Five reports per account in free version. 4. Unlimited number of data sources. 5. Unlimited number of tabs in per report. 6. Ability to copy reports.
- 12. We need to learn three simple steps
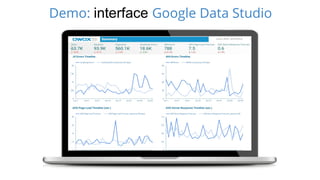
- 14. Demo: interface Google Data Studio
- 15. Access control Action Can view Can edit Is owner View data in the report x x x Copy the report and store on Google Drive x x x Share / stop sharing the report with others x x Modify the report x x Add and modify data from attached data sources x x Attach / remove data sources x x Create / delete the report x
- 16. Notes so far: 1. Beta-issues (fixed soon): - Currency defaults to USD - Sometimes see service error - Quality Score missing from Adwords integration - Must be loggedin to a google account to view report. 2. You can`t natively create a filter on a metric (unless you use an if statement calculated field) 3. Default date ranges are missing 4weekly & half year. 4. Only possible to join date using date field 5. Currently no ETL / transform function (but this can be done in BigQuery)
- 17. 3. Examples of reports in Google Data Studio
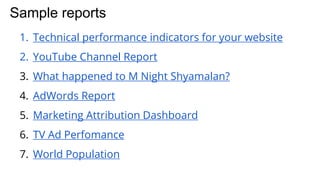
- 18. Sample reports 1. Technical performance indicators for your website 2. YouTube Channel Report 3. What happened to M Night Shyamalan? 4. AdWords Report 5. Marketing Attribution Dashboard 6. TV Ad Perfomance 7. World Population
- 19. 4. Quiz
- 21. Top members from Quiz
- 22. Thank you


