Location via proxy:   [ UP ]  
[Report a bug]   [Manage cookies]                
SlideShare a Scribd company logo
Barclays Capital
Industrial Select Conference

         Dave Anderson
     Senior Vice President and CFO


           February 9, 2009
Forward Looking Statements
    This report contains “forward-looking statements” within the meaning of Section
    21E of the Securities Exchange Act of 1934. All statements, other than
    statements of fact, that address activities, events or developments that we or
    our management intend, expect, project, believe or anticipate will or may occur
    in the future are forward-looking statements. Forward-looking statements are
    based on management’s assumptions and assessments in light of past
    experience and trends, current economic and industry conditions, expected
    future developments and other relevant factors. They are not guarantees of
    future performance, and actual results, developments and business decisions
    may differ from those envisaged by our forward-looking statements. Our
    forward-looking statements are also subject to risks and uncertainties, which
    can affect our performance in both the near- and long-term. We identify the
    principal risks and uncertainties that affect our performance in our Form 10-K
    and other filings with the Securities and Exchange Commission.


                                                                      Barclays Capital Industrial Select Conference
2
                                                                                                   February 9, 2009
Honeywell Overview
                         Segments                                             Geographic Mix
                 Specialty
                                                                        ROW
                   14%
                                                Aerospace               22%
                                                   35%
    Transportation                                                                                 US
         13%                                                                                      48%

                                                                     Europe
                                                                      30%
                 ACS
                 38%


                         Financials                                           Key Initiatives
         Sales ($B)     Segment Profit ($B)    FCF Conversion %
                                 129%
                                                                  • Velocity Product Development™
             119%
                                                      110%

                                                                  • Honeywell Operating System

                                                                  • Functional Transformation
                                                  $36.6
                              $34.6
         $31.4
                                                          $4.8
                                      $4.7
                                                                  • Acquisition and Divestiture Process
                 $4.1


            2006                  2007               2008


                                              The New Honeywell
                                                                                            Barclays Capital Industrial Select Conference
3
                                                                                                                         February 9, 2009
2008 Highlights
                                    • $40B+ Aerospace Programs
                                    • $0.4B+ Building Efficiency Projects
      Multi-Year Contract Wins
                                    • $4B+ Turbo Platforms

                                    • HTF 7500 Engine
       Attractive New Products      • Wireless Sensing Technology
                                    • UOP Heavy Oil Hydrocracking

                                    • Norcross, Metrologic Acquisitions
        Portfolio Management        • Consumable Solutions Divestiture

                                    • $1.2B Acquisitions / Divestitures, Net
                                    • $1.4B Share Repurchases
     Effective Capital Deployment
                                    • $0.8B Dividends

                                    • $0.4B Actions ($0.7B ‘06-’08)
       Proactive Repositioning      • Funded Through Operations / Gains

                                    • 70% Sites HOS Initiated
       Key Initiative Execution     • ERP Progress / FT Savings
                                    • VPDTM Contributions Increasing

                    Building Long-Term Value
                                                                 Barclays Capital Industrial Select Conference
4
                                                                                              February 9, 2009
Fourth Quarter 2008 Results

                                                                4Q07                  4Q08
     (M)


                                                                                               • 6% Decline
     Sales                                                      $9,275                $8,712
                                                                                                   (4)% Organic
                                                                                                   2% Acq. / Div.
                                                                                                   (4)% F/X

     Segment Profit                                             $1,274                $1,160   • 9% Decline
                                                                                                   ACS + 110 bps
         Margin %                                                 13.7%               13.3%
                                                                                                   TS (1030) bps


     Net Income                                                   $689                $707     • 3% Growth
                                                                                                   Repo. Offsets Taxes

     EPS                                                         $0.91                $0.97    • 7% Growth
                                                                                                   Lower Sharecount

     Free Cash Flow*                                            $1,130                $1,093   • 155% Conversion


                   Good Performance In Tough Environment
    *Excluding cash taxes relating to the sale of the Consumable Solutions business                        Barclays Capital Industrial Select Conference
5
                                                                                                                                        February 9, 2009
Full Year 2008 Results

                                                                FY07                  FY08
     (M)


                                                                                                • 6% Growth
     Sales                                                     $34,589                $36,556
                                                                                                    2% Organic
                                                                                                    3% Acq. / Div.
                                                                                                    1% F/X

     Segment Profit                                             $4,654                $4,845    • 4% Growth
                                                                                                    Margin Expansion
         Margin %                                                 13.5%                13.3%
                                                                                                    3 of 4 Segments


     Net Income                                                 $2,444                $2,792    • 14% Growth
                                                                                                    Including $424M Repo.

     EPS                                                         $3.16                 $3.76    • 19% Growth
                                                                                                    Lower Sharecount

     Free Cash Flow*                                            $3,144                $3,073    • 110% Conversion


                                                          Another Great Year
    *Excluding cash taxes relating to the sale of the Consumable Solutions business                         Barclays Capital Industrial Select Conference
6
                                                                                                                                         February 9, 2009
2009 Planning
                            • US GDP (3)% to (2)%
        Developed Markets   • EU GDP (2)% to (1)%
                                                         Global GDP
                                                          (1)% to 0%
                            • China GDP 5 to 6%
        Emerging Markets    • India GDP 4 to 5%


                            • EURO / USD $1.25
        Foreign Exchange    • GBP / USD $1.45


                            • Nickel Down 80%+ From Peak
          Commodities       • Natural Gas Down 55%+ From Peak

                            • + : Net Productivity, Repo Benefits
                            • - : Volume, FX
         Segment Margin
                            • 1H Comps Challenging

                            • 100%+ Conversion
         Free Cash Flow     • Working Capital Contribution
                            • High Quality Earnings Stream

        Macro Assumptions Supporting Outlook
                                                        Barclays Capital Industrial Select Conference
7
                                                                                     February 9, 2009
Key Market Assumptions
                                                     HON          2009                        2009
    Business
                                                     4Q08         Drivers                     Planning
                                                     AM: 0%       Flight Hours                (2)%
    AT&R
                                                    OE: 13%*      OE Deliveries               0% to 5%
                                                    AM: 3%        TFE Flight Hours            (15)%
    B&GA
                                                    OE: 16%       OE Deliveries               (5)% to 0%
    Defense                                            4%         DOD Budget                  3%
                                                                  US/EU Housing Sales         No Recovery
                                                                  US/EU Non-Res               Downturn
    ACS – Developed                                    2%
                                                                  Retrofit / Regulation       Stable
                                                                  Industrial Cap/Op Ex        Cautious
    ACS – Emerging                                    16%         New Construction            Moderating
                                                                  Europe Auto Production      (20)% to (15)%
    Turbocharging                                    (44)%        Europe Diesel Penetration   (1) pts
                                                                  Small Engine Shift          (4) pts
    UOP                                           $1.6B Backlog   Refining / Gas / Petrochem Slowing

                                        Challenging Market Conditions
                                                                                                Barclays Capital Industrial Select Conference
8   *Excluding CS Divestiture and Boeing Strike
                                                                                                                             February 9, 2009
2009 Financial Guidance Update
                                    Consolidated                          2009                Growth
                                                                    Financial Outlook     2009E vs. 2008E
                                    ($B)
                                    Sales                       $     33.6 - 35.3           (8)% -     (4)%
                                                                                             (4)% -
                                       Organic (LCE)                                                    1%

                                    Segment Profit                     4.4 - 4.8            (8)% -      0%
                                       Segment Margin                13.2% - 13.7%        (10) bps -   40 bps

                                    Net Income                         2.4 - 2.7           (14)% -     (4)%
                                    EPS                             $3.20 - 3.55           (15)% -     (6)%
                                    Free Cash Flow              >100% Conversion

                                                  Status Since December 15 Guidance
                                                                                   – Pension Discount Rate 6.95% vs. 7.5%
      + Pension Plan Returns -29% vs. -33%

                                                                                   – China and India Slow-Down
      + Euro ~$1.30 Spot vs. $1.25 Plan

                                                                                   – Commercial Aerospace Weakness
      + ACS Performance

                                                                                   – Electronic Materials Demand
      + Commodity Costs

                                                                                   – Earnings and Cash Non-Linearity
      + Productivity Savings

                                          Fluid Economic Environment
                                                                                                                Barclays Capital Industrial Select Conference
9   Excludes impact of acquisition related costs (FAS 141(R))                                                                                February 9, 2009
Restructuring Benefits
        $M              Restructuring Charges (’06-’08)

      $600              Projected Benefits


                                         Reported EPS Growth
      $300
                  31%                             25%          19%


         $-


      $(300)


      $(600)
                 2006                           2007           2008    2009


               Funded Through Operations / Gains
                                                                      Barclays Capital Industrial Select Conference
10
                                                                                                   February 9, 2009
2009 Productivity Actions
                          Functional Transformation
        ~$0.8B Savings
                          • Targeting Functional Cost at 5.3% of Sales
                            – 60% Total Sales on SAP
            AERO            – 40% Reduction in Supplier Base
                            – Consolidating 75 Rooftops
                          Honeywell Operating System
                          • 80% Manufacturing Cost Base Initiated (~160 Sites)
                            – 40 Sites Attain Bronze Certification
             ACS
                                     >95% Delivery to Customer Request
                                     >15% Improvement in Inventory
                                     >25% Reduction in Defects
                                     Improved Safety Maturity
             TS
                          Repositioning Savings
                          • Benefits from $0.7B Proactive Actions ’06-’08
             SM
                            – $0.5B+ Savings in 2009
                            – Fixed Costs Aligned With Slow Growth Environment

                  Projects Identified And Actionable
                                                                         Barclays Capital Industrial Select Conference
11
                                                                                                      February 9, 2009
1Q09 Preview
                        Sales       Comments
     ($B)

                                    • Acq. / Div. -4% Estimated Impact
                                    • OE Deliveries Decline
     Aerospace         ~2.6 – 2.8
                                    • ATR Flight Hours -4%, TFE Hours -25%

                                    • FX -12%, Acq. +8% Estimated Impact
                                    • Contribution from Acquisitions
     ACS               ~3.0 – 3.2
                                    • Conversion of Solutions Backlog


                                    • FX -8% Estimated Impact
     Transportation    ~0.7 – 0.8   • Continued Automotive Weakness


                                    • FX -2% Estimated Impact
     Specialty         ~0.9 – 1.0   • UOP Catalysts Decline, Negative Mix
                                    • Continued R&C, EM Weakness


                      1Q09 Sales ~$7.4B - $8.0B
                         EPS $0.50 – $0.60
                                                             Barclays Capital Industrial Select Conference
12
                                                                                          February 9, 2009
Honeywell Playbook - Sales

      • Delivery & Quality             HOS Toolkit


      • Pricing                        Advanced Analytics


      • New Products                   VPD™ Leverage


      • Emerging Market Growth         Design / Source Locally


      • Acquisition Leverage           Synergy Benefits


                  Grow Faster Than Served Markets
                                                     Barclays Capital Industrial Select Conference
13
                                                                                  February 9, 2009
Honeywell Playbook – Segment Profit

      • FT / ERP                           Project Execution


      • HOS Deployment                     Deliver Benefits


      • Cost Management                    Specific Accountability


      • Direct Materials                   Strategic Sourcing


      • Census / Restructuring             Deliver Savings


                           Protect Bottom Line
                                                        Barclays Capital Industrial Select Conference
14
                                                                                     February 9, 2009
Summary


      • Strong 2008 Finish in Tough Environment


      • Anticipating Challenging 1H 2009


      • Comparisons More Favorable in 2H 2009


      • Reaffirming 2009 EPS Guidance


              Investor Meeting February 23rd
                                                Barclays Capital Industrial Select Conference
15
                                                                             February 9, 2009
Appendix
     Reconciliation of non-GAAP Measures
              to GAAP Measures


                                   Barclays Capital Industrial Select Conference
16
                                                                February 9, 2009
Reconciliation of Segment Profit to Operating Income and
     Calculation of Segment Profit and Operating Income Margin

                                                                                                   4Q07               4Q08
            ($M )

               Sales                                                                                $9,275            $8,712
               Cost of Products and Services Sold                                                   (7,013)           (6,523)
               Selling, General and Administrative Expenses                                         (1,205)           (1,179)
               Operating Income                                                                     $1,057            $1,010

               Stock Based Compensation (1)                                                            11              21
               Repositioning and Other (1, 2)                                                         135              105
                                                             (1)
               Pension and OPEB Expense                                                              71                24
               Segment Profit                                                                       $1,274            $1,160

               Operating Income                                                                     $1,057            $1,010
               ÷ Sales                                                                              $9,275            $8,712
               Operating Income Margin %                                                             11.4%             11.6%

               Segment Profit                                                                       $1,274            $1,160
               ÷ Sales                                                                              $9,275            $8,712
               Segment Profit Margin %                                                               13.7%             13.3%

            (1 Included in co st o f pro ducts and services so ld and selling, general and administrative expenses
              )
            (2) Includes repo sitio ning, asbesto s, enviro nmental expenses and equity inco me (beginning 1 /2008)
                                                                                                            /1


                                                                                                                        Barclays Capital Industrial Select Conference
17
                                                                                                                                                     February 9, 2009
Reconciliation of Free Cash Flow to Cash Provided by Operating
     Activities and Calculation of Cash Flow Conversion

                                                                               4Q07                4Q08
      ($M )
        Cash Provided by Operating Activities                                  $1,440               $1,259
        Expenditures for Property, Plant and Equipment                          (310)                 (332)
        Free Cash Flow                                                         1,130                   927
        Cash taxes relating to the sale of the Consumable Solutions business      -                    166
        Free Cash Flow excluding cash taxes relating to the sale
          of the Consumables Solution business                                 1,130                 1,093

        Cash Provided by Operating Activities                                  $1,440               $1,259
        ÷ Net Income                                                           689                    707
        Operating Cash Flow Conversion %                                       209%                   178%

        Free Cash Flow excluding cash taxes relating to the sale
           of the Consumables Solution business                                $1,130               $1,093
        ÷ Net Income                                                            689                  707
        Free Cash Flow excluding cash taxes relating to the sale
           of the Consumables Solution business Conversion %                   164%                   155%


                                                                                        Barclays Capital Industrial Select Conference
18
                                                                                                                     February 9, 2009
Reconciliation of Segment Profit to Operating Income and
     Calculation of Segment Profit and Operating Income Margin

                                                                                              2006             2007                2008
     ($B)

        Sales                                                                                   $31.4          $34.6                 $36.6
        Cost of Products and Services Sold                                                      (24.1)         (26.3)                 (28.0)
        Selling, General and Administrative Expenses                                             (4.2)          (4.6)                  (5.0)
        Operating Income                                                                         $3.1           $3.7                   $3.6

        Stock Based Compensation (1)                                                              0.1           0.1                     0.1
        Repositioning and Other (1, 2)                                                            0.5           0.6                     1.0
        Pension and OPEB Expense (1)                                                              0.4           0.3                     0.1
        Segment Profit                                                                           $4.1           $4.7                    $4.8

        Operating Income                                                                        $3.1            $3.7                  $3.6
        ÷ Sales                                                                                 $31.4          $34.6                 $36.6
        Operating Income Margin %                                                                9.9%          10.7%                  9.8%

        Segment Profit                                                                          $4.1            $4.7                  $4.8
        ÷ Sales                                                                                 $31.4          $34.6                 $36.6
        Segment Profit Margin %                                                                 13.0%          13.5%                 13.3%

     (1 Included in co st o f pro ducts and services so ld and selling, general and administrative expenses
       )
     (2) Includes repo sitio ning, asbesto s, enviro nmental expenses and equity inco me (beginning 1 /2008)
                                                                                                     /1


                                                                                                                        Barclays Capital Industrial Select Conference
19
                                                                                                                                                     February 9, 2009
Reconciliation of Segment Profit to Operating Income and
     Calculation of Segment Profit and Operating Income Margin

                                                                                                  2008                 2009E
           ($B)

              Sales                                                                                $36.6             $33.6 - $35.3
              Cost of Products and Services Sold                                                    (28.0)           (25.2) - (26.5)
              Selling, General and Administrative Expenses                                           (5.0)            (4.6) - (4.8)
              Operating Income                                                                       $3.6              $3.8 - $4.0

              Stock Based Compensation (1)                                                           0.1                 ~0.1
              Repositioning and Other (1, 2)                                                         1.0               0.3 - 0.4
              Pension and OPEB Expense (1)                                                           0.1               0.2 - 0.3
              Segment Profit                                                                         $4.8              $4.4 - 4.8

              Operating Income                                                                      $3.6              $3.8 - $4.0
              ÷ Sales                                                                              $36.6             $33.6 - $35.3
              Operating Income Margin %                                                             9.8%               ~11.3%

              Segment Profit                                                                        $4.8               $4.4 - 4.8
              ÷ Sales                                                                              $36.6             $33.6 - $35.3
              Segment Profit Margin %                                                              13.3%             13.2 - 13.7%

           (1 Included in co st o f pro ducts and services so ld and selling, general and administrative expenses
             )
           (2) Includes repo sitio ning, asbesto s, enviro nmental expenses and equity inco me (beginning 1 /2008)
                                                                                                           /1


                                                                                                                            Barclays Capital Industrial Select Conference
20
                                                                                                                                                         February 9, 2009
Reconciliation of Free Cash Flow to Cash Provided by Operating
     Activities and Calculation of Cash Flow Conversion

                                                                              2006     2007                          2008
     ($B)
       Cash Provided by Operating Activities                                  $3.2      $3.9                            $3.8
       Expenditures for Property, Plant and Equipment                          (0.7)    (0.8)                            (0.9)
       Free Cash Flow                                                          2.5      3.1                              2.9
       Cash taxes relating to the sale of the Consumables Solution business      -        -                              0.2
       Free Cash Flow excluding cash taxes relating to the sale
        of the Consumables Solution business                                  $2.5      $3.1                             $3.1

       Cash Provided by Operating Activities                                  $3.2      $3.9                             $3.8
       ÷ Net Income                                                           $2.4     $2.4                              2.8
       Operating Cash Flow Conversion %                                       154%     160%                             136%

       Free Cash Flow excluding cash taxes relating to the sale
        of the Consumables Solution business                                  $2.5      $3.1                             $3.1
       ÷ Net Income                                                           $2.1      $2.4                             $2.8
       Free Cash Flow excluding cash taxes relating to the sale
        of the Consumables Solution business Conversion %                     119%     129%                             110%


                                                                                              Barclays Capital Industrial Select Conference
21
                                                                                                                           February 9, 2009
Barclays Capital Industrial Select Conference
22
                                  February 9, 2009

More Related Content

Honeywell Barclays Capital Industrial Select Conference Presentation

  • 1. Barclays Capital Industrial Select Conference Dave Anderson Senior Vice President and CFO February 9, 2009
  • 2. Forward Looking Statements This report contains “forward-looking statements” within the meaning of Section 21E of the Securities Exchange Act of 1934. All statements, other than statements of fact, that address activities, events or developments that we or our management intend, expect, project, believe or anticipate will or may occur in the future are forward-looking statements. Forward-looking statements are based on management’s assumptions and assessments in light of past experience and trends, current economic and industry conditions, expected future developments and other relevant factors. They are not guarantees of future performance, and actual results, developments and business decisions may differ from those envisaged by our forward-looking statements. Our forward-looking statements are also subject to risks and uncertainties, which can affect our performance in both the near- and long-term. We identify the principal risks and uncertainties that affect our performance in our Form 10-K and other filings with the Securities and Exchange Commission. Barclays Capital Industrial Select Conference 2 February 9, 2009
  • 3. Honeywell Overview Segments Geographic Mix Specialty ROW 14% Aerospace 22% 35% Transportation US 13% 48% Europe 30% ACS 38% Financials Key Initiatives Sales ($B) Segment Profit ($B) FCF Conversion % 129% • Velocity Product Development™ 119% 110% • Honeywell Operating System • Functional Transformation $36.6 $34.6 $31.4 $4.8 $4.7 • Acquisition and Divestiture Process $4.1 2006 2007 2008 The New Honeywell Barclays Capital Industrial Select Conference 3 February 9, 2009
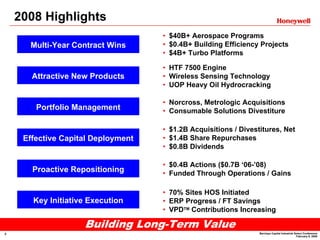
  • 4. 2008 Highlights • $40B+ Aerospace Programs • $0.4B+ Building Efficiency Projects Multi-Year Contract Wins • $4B+ Turbo Platforms • HTF 7500 Engine Attractive New Products • Wireless Sensing Technology • UOP Heavy Oil Hydrocracking • Norcross, Metrologic Acquisitions Portfolio Management • Consumable Solutions Divestiture • $1.2B Acquisitions / Divestitures, Net • $1.4B Share Repurchases Effective Capital Deployment • $0.8B Dividends • $0.4B Actions ($0.7B ‘06-’08) Proactive Repositioning • Funded Through Operations / Gains • 70% Sites HOS Initiated Key Initiative Execution • ERP Progress / FT Savings • VPDTM Contributions Increasing Building Long-Term Value Barclays Capital Industrial Select Conference 4 February 9, 2009
  • 5. Fourth Quarter 2008 Results 4Q07 4Q08 (M) • 6% Decline Sales $9,275 $8,712 (4)% Organic 2% Acq. / Div. (4)% F/X Segment Profit $1,274 $1,160 • 9% Decline ACS + 110 bps Margin % 13.7% 13.3% TS (1030) bps Net Income $689 $707 • 3% Growth Repo. Offsets Taxes EPS $0.91 $0.97 • 7% Growth Lower Sharecount Free Cash Flow* $1,130 $1,093 • 155% Conversion Good Performance In Tough Environment *Excluding cash taxes relating to the sale of the Consumable Solutions business Barclays Capital Industrial Select Conference 5 February 9, 2009
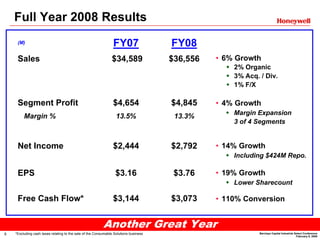
  • 6. Full Year 2008 Results FY07 FY08 (M) • 6% Growth Sales $34,589 $36,556 2% Organic 3% Acq. / Div. 1% F/X Segment Profit $4,654 $4,845 • 4% Growth Margin Expansion Margin % 13.5% 13.3% 3 of 4 Segments Net Income $2,444 $2,792 • 14% Growth Including $424M Repo. EPS $3.16 $3.76 • 19% Growth Lower Sharecount Free Cash Flow* $3,144 $3,073 • 110% Conversion Another Great Year *Excluding cash taxes relating to the sale of the Consumable Solutions business Barclays Capital Industrial Select Conference 6 February 9, 2009
  • 7. 2009 Planning • US GDP (3)% to (2)% Developed Markets • EU GDP (2)% to (1)% Global GDP (1)% to 0% • China GDP 5 to 6% Emerging Markets • India GDP 4 to 5% • EURO / USD $1.25 Foreign Exchange • GBP / USD $1.45 • Nickel Down 80%+ From Peak Commodities • Natural Gas Down 55%+ From Peak • + : Net Productivity, Repo Benefits • - : Volume, FX Segment Margin • 1H Comps Challenging • 100%+ Conversion Free Cash Flow • Working Capital Contribution • High Quality Earnings Stream Macro Assumptions Supporting Outlook Barclays Capital Industrial Select Conference 7 February 9, 2009
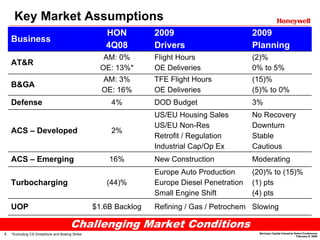
  • 8. Key Market Assumptions HON 2009 2009 Business 4Q08 Drivers Planning AM: 0% Flight Hours (2)% AT&R OE: 13%* OE Deliveries 0% to 5% AM: 3% TFE Flight Hours (15)% B&GA OE: 16% OE Deliveries (5)% to 0% Defense 4% DOD Budget 3% US/EU Housing Sales No Recovery US/EU Non-Res Downturn ACS – Developed 2% Retrofit / Regulation Stable Industrial Cap/Op Ex Cautious ACS – Emerging 16% New Construction Moderating Europe Auto Production (20)% to (15)% Turbocharging (44)% Europe Diesel Penetration (1) pts Small Engine Shift (4) pts UOP $1.6B Backlog Refining / Gas / Petrochem Slowing Challenging Market Conditions Barclays Capital Industrial Select Conference 8 *Excluding CS Divestiture and Boeing Strike February 9, 2009
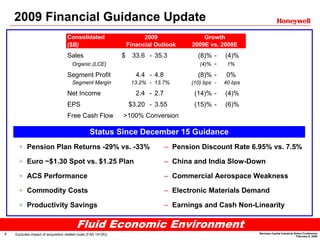
  • 9. 2009 Financial Guidance Update Consolidated 2009 Growth Financial Outlook 2009E vs. 2008E ($B) Sales $ 33.6 - 35.3 (8)% - (4)% (4)% - Organic (LCE) 1% Segment Profit 4.4 - 4.8 (8)% - 0% Segment Margin 13.2% - 13.7% (10) bps - 40 bps Net Income 2.4 - 2.7 (14)% - (4)% EPS $3.20 - 3.55 (15)% - (6)% Free Cash Flow >100% Conversion Status Since December 15 Guidance – Pension Discount Rate 6.95% vs. 7.5% + Pension Plan Returns -29% vs. -33% – China and India Slow-Down + Euro ~$1.30 Spot vs. $1.25 Plan – Commercial Aerospace Weakness + ACS Performance – Electronic Materials Demand + Commodity Costs – Earnings and Cash Non-Linearity + Productivity Savings Fluid Economic Environment Barclays Capital Industrial Select Conference 9 Excludes impact of acquisition related costs (FAS 141(R)) February 9, 2009
  • 10. Restructuring Benefits $M Restructuring Charges (’06-’08) $600 Projected Benefits Reported EPS Growth $300 31% 25% 19% $- $(300) $(600) 2006 2007 2008 2009 Funded Through Operations / Gains Barclays Capital Industrial Select Conference 10 February 9, 2009
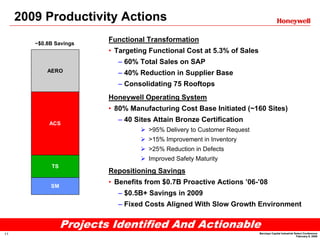
  • 11. 2009 Productivity Actions Functional Transformation ~$0.8B Savings • Targeting Functional Cost at 5.3% of Sales – 60% Total Sales on SAP AERO – 40% Reduction in Supplier Base – Consolidating 75 Rooftops Honeywell Operating System • 80% Manufacturing Cost Base Initiated (~160 Sites) – 40 Sites Attain Bronze Certification ACS >95% Delivery to Customer Request >15% Improvement in Inventory >25% Reduction in Defects Improved Safety Maturity TS Repositioning Savings • Benefits from $0.7B Proactive Actions ’06-’08 SM – $0.5B+ Savings in 2009 – Fixed Costs Aligned With Slow Growth Environment Projects Identified And Actionable Barclays Capital Industrial Select Conference 11 February 9, 2009
  • 12. 1Q09 Preview Sales Comments ($B) • Acq. / Div. -4% Estimated Impact • OE Deliveries Decline Aerospace ~2.6 – 2.8 • ATR Flight Hours -4%, TFE Hours -25% • FX -12%, Acq. +8% Estimated Impact • Contribution from Acquisitions ACS ~3.0 – 3.2 • Conversion of Solutions Backlog • FX -8% Estimated Impact Transportation ~0.7 – 0.8 • Continued Automotive Weakness • FX -2% Estimated Impact Specialty ~0.9 – 1.0 • UOP Catalysts Decline, Negative Mix • Continued R&C, EM Weakness 1Q09 Sales ~$7.4B - $8.0B EPS $0.50 – $0.60 Barclays Capital Industrial Select Conference 12 February 9, 2009
  • 13. Honeywell Playbook - Sales • Delivery & Quality HOS Toolkit • Pricing Advanced Analytics • New Products VPD™ Leverage • Emerging Market Growth Design / Source Locally • Acquisition Leverage Synergy Benefits Grow Faster Than Served Markets Barclays Capital Industrial Select Conference 13 February 9, 2009
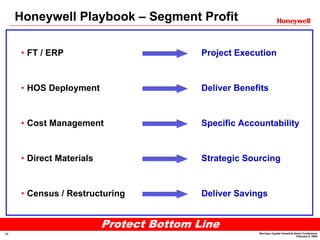
  • 14. Honeywell Playbook – Segment Profit • FT / ERP Project Execution • HOS Deployment Deliver Benefits • Cost Management Specific Accountability • Direct Materials Strategic Sourcing • Census / Restructuring Deliver Savings Protect Bottom Line Barclays Capital Industrial Select Conference 14 February 9, 2009
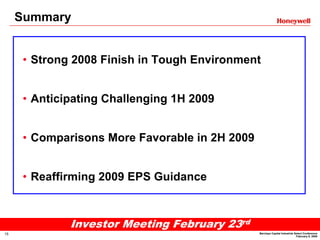
  • 15. Summary • Strong 2008 Finish in Tough Environment • Anticipating Challenging 1H 2009 • Comparisons More Favorable in 2H 2009 • Reaffirming 2009 EPS Guidance Investor Meeting February 23rd Barclays Capital Industrial Select Conference 15 February 9, 2009
  • 16. Appendix Reconciliation of non-GAAP Measures to GAAP Measures Barclays Capital Industrial Select Conference 16 February 9, 2009
  • 17. Reconciliation of Segment Profit to Operating Income and Calculation of Segment Profit and Operating Income Margin 4Q07 4Q08 ($M ) Sales $9,275 $8,712 Cost of Products and Services Sold (7,013) (6,523) Selling, General and Administrative Expenses (1,205) (1,179) Operating Income $1,057 $1,010 Stock Based Compensation (1) 11 21 Repositioning and Other (1, 2) 135 105 (1) Pension and OPEB Expense 71 24 Segment Profit $1,274 $1,160 Operating Income $1,057 $1,010 ÷ Sales $9,275 $8,712 Operating Income Margin % 11.4% 11.6% Segment Profit $1,274 $1,160 ÷ Sales $9,275 $8,712 Segment Profit Margin % 13.7% 13.3% (1 Included in co st o f pro ducts and services so ld and selling, general and administrative expenses ) (2) Includes repo sitio ning, asbesto s, enviro nmental expenses and equity inco me (beginning 1 /2008) /1 Barclays Capital Industrial Select Conference 17 February 9, 2009
  • 18. Reconciliation of Free Cash Flow to Cash Provided by Operating Activities and Calculation of Cash Flow Conversion 4Q07 4Q08 ($M ) Cash Provided by Operating Activities $1,440 $1,259 Expenditures for Property, Plant and Equipment (310) (332) Free Cash Flow 1,130 927 Cash taxes relating to the sale of the Consumable Solutions business - 166 Free Cash Flow excluding cash taxes relating to the sale of the Consumables Solution business 1,130 1,093 Cash Provided by Operating Activities $1,440 $1,259 ÷ Net Income 689 707 Operating Cash Flow Conversion % 209% 178% Free Cash Flow excluding cash taxes relating to the sale of the Consumables Solution business $1,130 $1,093 ÷ Net Income 689 707 Free Cash Flow excluding cash taxes relating to the sale of the Consumables Solution business Conversion % 164% 155% Barclays Capital Industrial Select Conference 18 February 9, 2009
  • 19. Reconciliation of Segment Profit to Operating Income and Calculation of Segment Profit and Operating Income Margin 2006 2007 2008 ($B) Sales $31.4 $34.6 $36.6 Cost of Products and Services Sold (24.1) (26.3) (28.0) Selling, General and Administrative Expenses (4.2) (4.6) (5.0) Operating Income $3.1 $3.7 $3.6 Stock Based Compensation (1) 0.1 0.1 0.1 Repositioning and Other (1, 2) 0.5 0.6 1.0 Pension and OPEB Expense (1) 0.4 0.3 0.1 Segment Profit $4.1 $4.7 $4.8 Operating Income $3.1 $3.7 $3.6 ÷ Sales $31.4 $34.6 $36.6 Operating Income Margin % 9.9% 10.7% 9.8% Segment Profit $4.1 $4.7 $4.8 ÷ Sales $31.4 $34.6 $36.6 Segment Profit Margin % 13.0% 13.5% 13.3% (1 Included in co st o f pro ducts and services so ld and selling, general and administrative expenses ) (2) Includes repo sitio ning, asbesto s, enviro nmental expenses and equity inco me (beginning 1 /2008) /1 Barclays Capital Industrial Select Conference 19 February 9, 2009
  • 20. Reconciliation of Segment Profit to Operating Income and Calculation of Segment Profit and Operating Income Margin 2008 2009E ($B) Sales $36.6 $33.6 - $35.3 Cost of Products and Services Sold (28.0) (25.2) - (26.5) Selling, General and Administrative Expenses (5.0) (4.6) - (4.8) Operating Income $3.6 $3.8 - $4.0 Stock Based Compensation (1) 0.1 ~0.1 Repositioning and Other (1, 2) 1.0 0.3 - 0.4 Pension and OPEB Expense (1) 0.1 0.2 - 0.3 Segment Profit $4.8 $4.4 - 4.8 Operating Income $3.6 $3.8 - $4.0 ÷ Sales $36.6 $33.6 - $35.3 Operating Income Margin % 9.8% ~11.3% Segment Profit $4.8 $4.4 - 4.8 ÷ Sales $36.6 $33.6 - $35.3 Segment Profit Margin % 13.3% 13.2 - 13.7% (1 Included in co st o f pro ducts and services so ld and selling, general and administrative expenses ) (2) Includes repo sitio ning, asbesto s, enviro nmental expenses and equity inco me (beginning 1 /2008) /1 Barclays Capital Industrial Select Conference 20 February 9, 2009
  • 21. Reconciliation of Free Cash Flow to Cash Provided by Operating Activities and Calculation of Cash Flow Conversion 2006 2007 2008 ($B) Cash Provided by Operating Activities $3.2 $3.9 $3.8 Expenditures for Property, Plant and Equipment (0.7) (0.8) (0.9) Free Cash Flow 2.5 3.1 2.9 Cash taxes relating to the sale of the Consumables Solution business - - 0.2 Free Cash Flow excluding cash taxes relating to the sale of the Consumables Solution business $2.5 $3.1 $3.1 Cash Provided by Operating Activities $3.2 $3.9 $3.8 ÷ Net Income $2.4 $2.4 2.8 Operating Cash Flow Conversion % 154% 160% 136% Free Cash Flow excluding cash taxes relating to the sale of the Consumables Solution business $2.5 $3.1 $3.1 ÷ Net Income $2.1 $2.4 $2.8 Free Cash Flow excluding cash taxes relating to the sale of the Consumables Solution business Conversion % 119% 129% 110% Barclays Capital Industrial Select Conference 21 February 9, 2009
  • 22. Barclays Capital Industrial Select Conference 22 February 9, 2009