Location via proxy:   [ UP ]  
[Report a bug]   [Manage cookies]                
SlideShare a Scribd company logo
Fourth Quarter / Full Year 2008
Earnings Release
January 30, 2009
Forward Looking Statements
    This report contains “forward-looking statements” within the meaning of Section
    21E of the Securities Exchange Act of 1934. All statements, other than
    statements of fact, that address activities, events or developments that we or
    our management intend, expect, project, believe or anticipate will or may occur
    in the future are forward-looking statements. Forward-looking statements are
    based on management’s assumptions and assessments in light of past
    experience and trends, current economic and industry conditions, expected
    future developments and other relevant factors. They are not guarantees of
    future performance, and actual results, developments and business decisions
    may differ from those envisaged by our forward-looking statements. Our
    forward-looking statements are also subject to risks and uncertainties, which
    can affect our performance in both the near- and long-term. We identify the
    principal risks and uncertainties that affect our performance in our Form 10-K
    and other filings with the Securities and Exchange Commission.


                                                                            4Q 2008 Earnings Release
2
                                                                                    January 30, 2009
2008 Summary
    • Strong Financial Performance
         – 6% Sales Growth
         – 19% EPS Growth
         – 110% Free Cash Flow Conversion*
         – 10% Dividend Increase

    • Portfolio Management
         – Attractive Norcross, Metrologic, Callidus and IAC Acquisitions
         – $1B+ Consumable Solutions Proceeds

    • Key Initiatives Driving Growth / Productivity
         – HOS, FT, VPD™

    • Prepared For Challenging 2009
         – $424M Repositioning Actions in 2008

                                               Strong 2008 Performance
    *Excluding cash taxes relating to the sale of the Consumable Solutions business   4Q 2008 Earnings Release
3
                                                                                              January 30, 2009
Fourth Quarter 2008 Results

                                                                4Q07                  4Q08
     (M)


                                                                                               • 6% Decline
     Sales                                                      $9,275                $8,712
                                                                                                   (4)% Organic
                                                                                                   2% Acq. / Div.
                                                                                                   (4)% F/X

     Segment Profit                                             $1,274                $1,160   • 9% Decline
                                                                                                   ACS + 110 bps
         Margin %                                                13.7%                13.3%
                                                                                                   TS (1030) bps


     Net Income                                                   $689                $707     • 3% Growth
                                                                                                   Repo. Offsets Taxes

     EPS                                                         $0.91                $0.97    • 7% Growth
                                                                                                   Lower Sharecount

     Free Cash Flow*                                            $1,130                $1,093   • 155% Conversion


                   Good Performance In Tough Environment
    *Excluding cash taxes relating to the sale of the Consumable Solutions business                                 4Q 2008 Earnings Release
4
                                                                                                                            January 30, 2009
Full Year 2008 Results

                                                                FY07                  FY08
     (M)


                                                                                                • 6% Growth
     Sales                                                     $34,589                $36,556
                                                                                                    2% Organic
                                                                                                    3% Acq. / Div.
                                                                                                    1% F/X

     Segment Profit                                             $4,654                $4,845    • 4% Growth
                                                                                                    Margin Expansion
         Margin %                                                 13.5%                13.3%
                                                                                                    3 of 4 Segments


     Net Income                                                 $2,444                $2,792    • 14% Growth
                                                                                                    Including $424M Repo.

     EPS                                                         $3.16                 $3.76    • 19% Growth
                                                                                                    Lower Sharecount

     Free Cash Flow*                                            $3,144                $3,073    • 110% Conversion


                                                          Another Great Year
    *Excluding cash taxes relating to the sale of the Consumable Solutions business                                  4Q 2008 Earnings Release
5
                                                                                                                             January 30, 2009
Aerospace
                                       4Q                                           FY
    ($M)
                           2007       2008             V               2007        2008            V
    Sales                 $ 3,267    $ 3,229         (1)%            $ 12,236    $ 12,650         3%

    Segment Profit            614          619        1%                2,197       2,300       5%
     Margin                 18.8%        19.2%      +40 bps             18.0%       18.2%     +20 bps


    4Q and FY Sales Walks                               4Q and FY Highlights
                                                        • Air Transport and Regional (Organic)
     ($B)
                                                              4Q: OE -12%, AM +0% (Flight Hours -1.6%)
                4Q08       V'07    FY08      V'07
     2007      $ 3.3              $ 12.2
                                                              FY: OE +3%, AM +4% (Flight Hours +3.4%)
      AT&R        (0.0)    (3)%       0.2    4%
      B&GA         0.1     10%        0.1    5%         • Business and General Aviation
      D&S          0.0     3%         0.2    3%
                                                              4Q: OE +16%, AM +3% (TFE Hours -22%)
     Organic       0.1     2%         0.5    4%
     FX             -      0%          -     0%               FY: OE +5%, AM +6% (TFE Hours -12%)
     Acq/Div      (0.1)    (3)%      (0.1)   (1)%
                                                        • Defense and Space
     2008      $ 3.2       (1)%   $ 12.7     3%
                                                              Logistics and Services, Orion and Tiger


                           Strong 4Q And 2008 Results
                                                                                                 4Q 2008 Earnings Release
6
                                                                                                         January 30, 2009
Automation And Control Solutions
                                          4Q                                            FY
    ($M)
                              2007       2008             V                2007        2008          V
    Sales                    $ 3,442    $ 3,534          3%              $ 12,478    $ 14,018       12%

    Segment Profit               425            474      12%                1,405       1,622      15%
     Margin                    12.3%          13.4%    +110 bps             11.3%       11.6%     +30 bps


    4Q and FY Sales Walks                                   4Q Highlights
                                                           • Products
     ($B)
                                                                  ECC and Life Safety Organic Growth
                   4Q08       V'07    FY08      V'07
     2007         $ 3.4              $ 12.5                       Wireless and Energy Efficient Controls
      Products       (0.0)    (1)%      0.0     0%
                                                                  Weakness in Security and Sensing
      Solutions       0.1     7%        0.3     6%
                                                           • Solutions
     Organic          0.1     2%        0.3     2%
     FX              (0.3)    (9)%      0.0     0%                Continued Energy Retrofit and Process
     Acq/Div          0.3     10%       1.2     10%               Optimization Demand
     2008         $ 3.5        3%    $ 14.0     12%
                                                                  Backlog and Service Bank Robust
                                                                  Organic Orders -1% (FY +4%)


                  Strengthened Portfolio Performing Well
                                                                                                    4Q 2008 Earnings Release
7
                                                                                                            January 30, 2009
Transportation Systems
                                        4Q                                         FY
    ($M)
                           2007        2008            V             2007         2008          V
    Sales                 $ 1,326    $    863        (35)%          $ 5,009      $ 4,622      (8)%

    Segment Profit            146               6   (96)%                583          406   (30)%
     Margin                 11.0%            0.7% (1030) bps           11.6%         8.8% (280) bps


    4Q and FY Sales Walks                               4Q Highlights
                                                        • Turbo Technologies
     ($B)
                                                             EU Passenger Vehicle Sales -25%, Diesel
                4Q08       V'07    FY08       V'07
     2007      $ 1.3              $ 5.0                      Penetration -5 points
      Turbo       (0.3)   (40)%      (0.4)   (14)%
                                                             NA Class 8 Truck Volumes -46%, US Light
      CPG/FM      (0.1)   (17)%      (0.2)    (9)%
                                                             Truck -73%
     Organic      (0.4)   (31)%      (0.6)   (12)%
     FX           (0.1)    (4)%       0.2     4%
                                                        • CPG / Friction Materials
     Acq/Div        -      0%          -      0%
     2008      $ 0.9      (35)%   $ 4.6       (8)%           Consumer Confidence, Miles Driven Down
                                                             OE and Aftermarket Declines


           Industry Challenges; Turbo LT Outlook Positive
                                                                                             4Q 2008 Earnings Release
8
                                                                                                     January 30, 2009
Specialty Materials
                                         4Q                                           FY
    ($M)
                             2007       2008             V              2007         2008           V
    Sales                   $ 1,240    $ 1,086         (12)%           $ 4,866      $ 5,266        8%

    Segment Profit              134          112       (16)%                658          721     10%
     Margin                   10.8%        10.3%      (50) bps            13.5%        13.7%    +20 bps


    4Q and FY Sales Walks                                  4Q Highlights
                                                          • UOP
     ($B)
                                                                 Catalysts +7% Offset By Project Timing
                  4Q08       V'07    FY08      V'07
     2007        $ 1.2              $ 4.9                 • Other SM
      UOP            0.0     2%         0.1    8%
                                                                 Fluorines +7%; Regulation and Strong
      Other SM      (0.1)   (17)%       0.3    9%
                                                                 Technology Position
     Organic        (0.1)   (10)%       0.4    9%
     FX             (0.0)    (2)%       0.0    0%                Resins & Chemicals -40%; Weak Demand
     Acq/Div        (0.0)    (0)%      (0.1)   (1)%              and Formula Pricing Deflation
     2008        $ 1.1      (12)%   $ 5.3      8%
                                                                 Specialty Products -14%; Semiconductor
                                                                 Industry Declines, Hurricane Impacts


                      Difficult 4Q; Strong 2008 Overall
                                                                                                  4Q 2008 Earnings Release
9
                                                                                                          January 30, 2009
2009 Financial Guidance Update
                                     Consolidated                          2009                Growth
                                                                     Financial Outlook     2009E vs. 2008E
                                     ($B)
                                     Sales                       $     33.6 - 35.3           (8)% -     (4)%
                                                                                              (4)% -
                                        Organic (LCE)                                                    1%

                                     Segment Profit                     4.4 - 4.8            (8)% -      0%
                                        Segment Margin                13.2% - 13.7%        (10) bps -   40 bps

                                     Net Income                         2.4 - 2.7           (14)% -     (4)%
                                     EPS                             $3.20 - 3.55           (15)% -     (6)%
                                     Free Cash Flow              >100% Conversion

                                                   Status Since December 15 Guidance
       + Pension Plan Returns -29% vs. -33%                                         – Pension Discount Rate 6.95% vs. 7.5%

       + Euro $1.31 Spot vs. $1.25 Plan                                             – China and India Slow-Down

       + ACS Performance                                                            – Commercial Aerospace Weakness

       + Commodity Costs                                                            – Electronic Materials Demand

       + Productivity Savings                                                       – Earnings and Cash Non-Linearity

                                           Fluid Economic Environment
                                                                                                                    4Q 2008 Earnings Release
10   Excludes impact of acquisition related costs (FAS 141(R))                                                              January 30, 2009
1Q09 Preview
                        Sales       Comments
     ($B)

                                    • Acq. / Div. -4% Estimated Impact
                                    • OE Deliveries Decline
     Aerospace         ~2.6 – 2.8
                                    • ATR Flight Hours -4%, TFE Hours -25%

                                    • FX -12%, Acq. +8% Estimated Impact
                                    • Contribution from Acquisitions
     ACS               ~3.0 – 3.2
                                    • Conversion of Solutions Backlog


                                    • FX -8% Estimated Impact
     Transportation    ~0.7 – 0.8   • Continued Automotive Weakness


                                    • FX -2% Estimated Impact
     Specialty         ~0.9 – 1.0   • UOP Catalysts Decline, Negative Mix
                                    • Continued R&C, EM Weakness


                      1Q09 Sales ~$7.4B - $8.0B
                         EPS $0.50 – $0.60
                                                                    4Q 2008 Earnings Release
11
                                                                            January 30, 2009
Summary


      • Strong 2008 Finish in Tough Environment


      • Anticipating Challenging 1H 2009


      • Comparisons More Favorable in 2H 2009


      • Reaffirming 2009 EPS Guidance


              Investor Meeting February 23rd
                                                  4Q 2008 Earnings Release
12
                                                          January 30, 2009
Appendix
     Reconciliation of non-GAAP Measures
              to GAAP Measures


                                       4Q 2008 Earnings Release
13
                                               January 30, 2009
Reconciliation of Segment Profit to Operating Income and
     Calculation of Segment Profit and Operating Income Margin

                                                                                                   4Q07               4Q08
            ($M )

               Sales                                                                                $9,275            $8,712
               Cost of Products and Services Sold                                                   (7,013)           (6,523)
               Selling, General and Administrative Expenses                                         (1,205)           (1,179)
               Operating Income                                                                     $1,057            $1,010

               Stock Based Compensation (1)                                                            11              21
                                                       (1, 2)
               Repositioning and Other                                                                135              105
                                                                (1)
               Pension and OPEB Expense                                                              71                24
               Segment Profit                                                                       $1,274            $1,160

               Operating Income                                                                     $1,057            $1,010
               ÷ Sales                                                                              $9,275            $8,712
               Operating Income Margin %                                                             11.4%             11.6%

               Segment Profit                                                                       $1,274            $1,160
               ÷ Sales                                                                              $9,275            $8,712
               Segment Profit Margin %                                                               13.7%             13.3%

            (1 Included in co st o f pro ducts and services so ld and selling, general and administrative expenses
              )
            (2) Includes repo sitio ning, asbesto s, enviro nmental expenses and equity inco me (beginning 1 /2008)
                                                                                                            /1


                                                                                                                                4Q 2008 Earnings Release
14
                                                                                                                                        January 30, 2009
Reconciliation of Free Cash Flow to Cash Provided by Operating
     Activities and Calculation of Cash Flow Conversion

                                                                               4Q07     4Q08
      ($M )
        Cash Provided by Operating Activities                                  $1,440   $1,259
        Expenditures for Property, Plant and Equipment                          (310)    (332)
        Free Cash Flow                                                         1,130     927
        Cash taxes relating to the sale of the Consumable Solutions business      -      166
        Free Cash Flow excluding cash taxes relating to the sale
          of the Consumables Solution business                                 1,130    1,093

        Cash Provided by Operating Activities                                  $1,440   $1,259
        ÷ Net Income                                                           689      707
        Operating Cash Flow Conversion %                                       209%     178%

        Free Cash Flow excluding cash taxes relating to the sale
           of the Consumables Solution business                                $1,130   $1,093
        ÷ Net Income                                                            689      707
        Free Cash Flow excluding cash taxes relating to the sale
           of the Consumables Solution business Conversion %                   164%     155%


                                                                                           4Q 2008 Earnings Release
15
                                                                                                   January 30, 2009
Reconciliation of Segment Profit to Operating Income and
     Calculation of Segment Profit and Operating Income Margin

                                                                                                  2007               2008
           ($B)

              Sales                                                                                $34.6             $36.6
              Cost of Products and Services Sold                                                    (26.3)           (28.0)
              Selling, General and Administrative Expenses                                           (4.6)            (5.0)
              Operating Income                                                                       $3.7             $3.6

              Stock Based Compensation (1)                                                           0.1              0.1
              Repositioning and Other (1, 2)                                                         0.6              1.0
              Pension and OPEB Expense (1)                                                           0.3              0.1
              Segment Profit                                                                         $4.7             $4.8

              Operating Income                                                                      $3.7              $3.6
              ÷ Sales                                                                              $34.6             $36.6
              Operating Income Margin %                                                            10.7%              9.8%

              Segment Profit                                                                        $4.7              $4.8
              ÷ Sales                                                                              $34.6             $36.6
              Segment Profit Margin %                                                              13.5%             13.3%

           (1 Included in co st o f pro ducts and services so ld and selling, general and administrative expenses
             )
           (2) Includes repo sitio ning, asbesto s, enviro nmental expenses and equity inco me (beginning 1 /2008)
                                                                                                           /1


                                                                                                                              4Q 2008 Earnings Release
16
                                                                                                                                      January 30, 2009
Reconciliation of Free Cash Flow to Cash Provided by Operating
     Activities and Calculation of Cash Flow Conversion

                                                                              2007     2008
     ($B)
       Cash Provided by Operating Activities                                   $3.9     $3.8
       Expenditures for Property, Plant and Equipment                          (0.8)    (0.9)
       Free Cash Flow                                                          3.1      2.9
       Cash taxes relating to the sale of the Consumables Solution business      -      0.2
       Free Cash Flow excluding cash taxes relating to the sale
        of the Consumables Solution business                                   $3.1     $3.1

       Cash Provided by Operating Activities                                   $3.9     $3.8
       ÷ Net Income                                                           $2.4      2.8
       Operating Cash Flow Conversion %                                       160%     136%

       Free Cash Flow excluding cash taxes relating to the sale
        of the Consumables Solution business                                   $3.1     $3.1
       ÷ Net Income                                                            $2.4     $2.8
       Free Cash Flow excluding cash taxes relating to the sale
        of the Consumables Solution business Conversion %                     129%     110%


                                                                                         4Q 2008 Earnings Release
17
                                                                                                 January 30, 2009
Reconciliation of Segment Profit to Operating Income and
     Calculation of Segment Profit and Operating Income Margin

                                                                                                  2008                 2009E
           ($B)

              Sales                                                                                $36.6             $33.6 - $35.3
              Cost of Products and Services Sold                                                    (28.0)           (25.2) - (26.5)
              Selling, General and Administrative Expenses                                           (5.0)            (4.6) - (4.8)
              Operating Income                                                                       $3.6              $3.8 - $4.0

              Stock Based Compensation (1)                                                           0.1                 ~0.1
              Repositioning and Other (1, 2)                                                         1.0               0.3 - 0.4
              Pension and OPEB Expense (1)                                                           0.1               0.2 - 0.3
              Segment Profit                                                                         $4.8              $4.4 - 4.8

              Operating Income                                                                      $3.6              $3.8 - $4.0
              ÷ Sales                                                                              $36.6             $33.6 - $35.3
              Operating Income Margin %                                                             9.8%               ~11.3%

              Segment Profit                                                                        $4.8               $4.4 - 4.8
              ÷ Sales                                                                              $36.6             $33.6 - $35.3
              Segment Profit Margin %                                                              13.3%             13.2 - 13.7%

           (1 Included in co st o f pro ducts and services so ld and selling, general and administrative expenses
             )
           (2) Includes repo sitio ning, asbesto s, enviro nmental expenses and equity inco me (beginning 1 /2008)
                                                                                                           /1


                                                                                                                                       4Q 2008 Earnings Release
18
                                                                                                                                               January 30, 2009
4Q 2008 Earnings Release
19
             January 30, 2009

More Related Content

Honeywell Download Documentation Q4 2008 Earnings Conference Call Presentation

  • 1. Fourth Quarter / Full Year 2008 Earnings Release January 30, 2009
  • 2. Forward Looking Statements This report contains “forward-looking statements” within the meaning of Section 21E of the Securities Exchange Act of 1934. All statements, other than statements of fact, that address activities, events or developments that we or our management intend, expect, project, believe or anticipate will or may occur in the future are forward-looking statements. Forward-looking statements are based on management’s assumptions and assessments in light of past experience and trends, current economic and industry conditions, expected future developments and other relevant factors. They are not guarantees of future performance, and actual results, developments and business decisions may differ from those envisaged by our forward-looking statements. Our forward-looking statements are also subject to risks and uncertainties, which can affect our performance in both the near- and long-term. We identify the principal risks and uncertainties that affect our performance in our Form 10-K and other filings with the Securities and Exchange Commission. 4Q 2008 Earnings Release 2 January 30, 2009
  • 3. 2008 Summary • Strong Financial Performance – 6% Sales Growth – 19% EPS Growth – 110% Free Cash Flow Conversion* – 10% Dividend Increase • Portfolio Management – Attractive Norcross, Metrologic, Callidus and IAC Acquisitions – $1B+ Consumable Solutions Proceeds • Key Initiatives Driving Growth / Productivity – HOS, FT, VPD™ • Prepared For Challenging 2009 – $424M Repositioning Actions in 2008 Strong 2008 Performance *Excluding cash taxes relating to the sale of the Consumable Solutions business 4Q 2008 Earnings Release 3 January 30, 2009
  • 4. Fourth Quarter 2008 Results 4Q07 4Q08 (M) • 6% Decline Sales $9,275 $8,712 (4)% Organic 2% Acq. / Div. (4)% F/X Segment Profit $1,274 $1,160 • 9% Decline ACS + 110 bps Margin % 13.7% 13.3% TS (1030) bps Net Income $689 $707 • 3% Growth Repo. Offsets Taxes EPS $0.91 $0.97 • 7% Growth Lower Sharecount Free Cash Flow* $1,130 $1,093 • 155% Conversion Good Performance In Tough Environment *Excluding cash taxes relating to the sale of the Consumable Solutions business 4Q 2008 Earnings Release 4 January 30, 2009
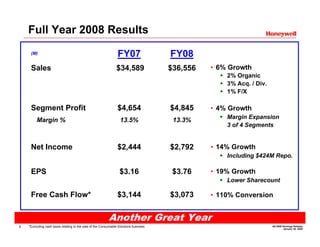
  • 5. Full Year 2008 Results FY07 FY08 (M) • 6% Growth Sales $34,589 $36,556 2% Organic 3% Acq. / Div. 1% F/X Segment Profit $4,654 $4,845 • 4% Growth Margin Expansion Margin % 13.5% 13.3% 3 of 4 Segments Net Income $2,444 $2,792 • 14% Growth Including $424M Repo. EPS $3.16 $3.76 • 19% Growth Lower Sharecount Free Cash Flow* $3,144 $3,073 • 110% Conversion Another Great Year *Excluding cash taxes relating to the sale of the Consumable Solutions business 4Q 2008 Earnings Release 5 January 30, 2009
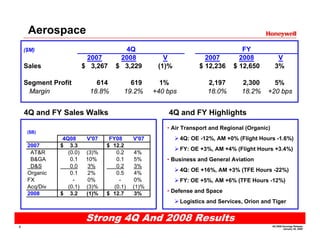
  • 6. Aerospace 4Q FY ($M) 2007 2008 V 2007 2008 V Sales $ 3,267 $ 3,229 (1)% $ 12,236 $ 12,650 3% Segment Profit 614 619 1% 2,197 2,300 5% Margin 18.8% 19.2% +40 bps 18.0% 18.2% +20 bps 4Q and FY Sales Walks 4Q and FY Highlights • Air Transport and Regional (Organic) ($B) 4Q: OE -12%, AM +0% (Flight Hours -1.6%) 4Q08 V'07 FY08 V'07 2007 $ 3.3 $ 12.2 FY: OE +3%, AM +4% (Flight Hours +3.4%) AT&R (0.0) (3)% 0.2 4% B&GA 0.1 10% 0.1 5% • Business and General Aviation D&S 0.0 3% 0.2 3% 4Q: OE +16%, AM +3% (TFE Hours -22%) Organic 0.1 2% 0.5 4% FX - 0% - 0% FY: OE +5%, AM +6% (TFE Hours -12%) Acq/Div (0.1) (3)% (0.1) (1)% • Defense and Space 2008 $ 3.2 (1)% $ 12.7 3% Logistics and Services, Orion and Tiger Strong 4Q And 2008 Results 4Q 2008 Earnings Release 6 January 30, 2009
  • 7. Automation And Control Solutions 4Q FY ($M) 2007 2008 V 2007 2008 V Sales $ 3,442 $ 3,534 3% $ 12,478 $ 14,018 12% Segment Profit 425 474 12% 1,405 1,622 15% Margin 12.3% 13.4% +110 bps 11.3% 11.6% +30 bps 4Q and FY Sales Walks 4Q Highlights • Products ($B) ECC and Life Safety Organic Growth 4Q08 V'07 FY08 V'07 2007 $ 3.4 $ 12.5 Wireless and Energy Efficient Controls Products (0.0) (1)% 0.0 0% Weakness in Security and Sensing Solutions 0.1 7% 0.3 6% • Solutions Organic 0.1 2% 0.3 2% FX (0.3) (9)% 0.0 0% Continued Energy Retrofit and Process Acq/Div 0.3 10% 1.2 10% Optimization Demand 2008 $ 3.5 3% $ 14.0 12% Backlog and Service Bank Robust Organic Orders -1% (FY +4%) Strengthened Portfolio Performing Well 4Q 2008 Earnings Release 7 January 30, 2009
  • 8. Transportation Systems 4Q FY ($M) 2007 2008 V 2007 2008 V Sales $ 1,326 $ 863 (35)% $ 5,009 $ 4,622 (8)% Segment Profit 146 6 (96)% 583 406 (30)% Margin 11.0% 0.7% (1030) bps 11.6% 8.8% (280) bps 4Q and FY Sales Walks 4Q Highlights • Turbo Technologies ($B) EU Passenger Vehicle Sales -25%, Diesel 4Q08 V'07 FY08 V'07 2007 $ 1.3 $ 5.0 Penetration -5 points Turbo (0.3) (40)% (0.4) (14)% NA Class 8 Truck Volumes -46%, US Light CPG/FM (0.1) (17)% (0.2) (9)% Truck -73% Organic (0.4) (31)% (0.6) (12)% FX (0.1) (4)% 0.2 4% • CPG / Friction Materials Acq/Div - 0% - 0% 2008 $ 0.9 (35)% $ 4.6 (8)% Consumer Confidence, Miles Driven Down OE and Aftermarket Declines Industry Challenges; Turbo LT Outlook Positive 4Q 2008 Earnings Release 8 January 30, 2009
  • 9. Specialty Materials 4Q FY ($M) 2007 2008 V 2007 2008 V Sales $ 1,240 $ 1,086 (12)% $ 4,866 $ 5,266 8% Segment Profit 134 112 (16)% 658 721 10% Margin 10.8% 10.3% (50) bps 13.5% 13.7% +20 bps 4Q and FY Sales Walks 4Q Highlights • UOP ($B) Catalysts +7% Offset By Project Timing 4Q08 V'07 FY08 V'07 2007 $ 1.2 $ 4.9 • Other SM UOP 0.0 2% 0.1 8% Fluorines +7%; Regulation and Strong Other SM (0.1) (17)% 0.3 9% Technology Position Organic (0.1) (10)% 0.4 9% FX (0.0) (2)% 0.0 0% Resins & Chemicals -40%; Weak Demand Acq/Div (0.0) (0)% (0.1) (1)% and Formula Pricing Deflation 2008 $ 1.1 (12)% $ 5.3 8% Specialty Products -14%; Semiconductor Industry Declines, Hurricane Impacts Difficult 4Q; Strong 2008 Overall 4Q 2008 Earnings Release 9 January 30, 2009
  • 10. 2009 Financial Guidance Update Consolidated 2009 Growth Financial Outlook 2009E vs. 2008E ($B) Sales $ 33.6 - 35.3 (8)% - (4)% (4)% - Organic (LCE) 1% Segment Profit 4.4 - 4.8 (8)% - 0% Segment Margin 13.2% - 13.7% (10) bps - 40 bps Net Income 2.4 - 2.7 (14)% - (4)% EPS $3.20 - 3.55 (15)% - (6)% Free Cash Flow >100% Conversion Status Since December 15 Guidance + Pension Plan Returns -29% vs. -33% – Pension Discount Rate 6.95% vs. 7.5% + Euro $1.31 Spot vs. $1.25 Plan – China and India Slow-Down + ACS Performance – Commercial Aerospace Weakness + Commodity Costs – Electronic Materials Demand + Productivity Savings – Earnings and Cash Non-Linearity Fluid Economic Environment 4Q 2008 Earnings Release 10 Excludes impact of acquisition related costs (FAS 141(R)) January 30, 2009
  • 11. 1Q09 Preview Sales Comments ($B) • Acq. / Div. -4% Estimated Impact • OE Deliveries Decline Aerospace ~2.6 – 2.8 • ATR Flight Hours -4%, TFE Hours -25% • FX -12%, Acq. +8% Estimated Impact • Contribution from Acquisitions ACS ~3.0 – 3.2 • Conversion of Solutions Backlog • FX -8% Estimated Impact Transportation ~0.7 – 0.8 • Continued Automotive Weakness • FX -2% Estimated Impact Specialty ~0.9 – 1.0 • UOP Catalysts Decline, Negative Mix • Continued R&C, EM Weakness 1Q09 Sales ~$7.4B - $8.0B EPS $0.50 – $0.60 4Q 2008 Earnings Release 11 January 30, 2009
  • 12. Summary • Strong 2008 Finish in Tough Environment • Anticipating Challenging 1H 2009 • Comparisons More Favorable in 2H 2009 • Reaffirming 2009 EPS Guidance Investor Meeting February 23rd 4Q 2008 Earnings Release 12 January 30, 2009
  • 13. Appendix Reconciliation of non-GAAP Measures to GAAP Measures 4Q 2008 Earnings Release 13 January 30, 2009
  • 14. Reconciliation of Segment Profit to Operating Income and Calculation of Segment Profit and Operating Income Margin 4Q07 4Q08 ($M ) Sales $9,275 $8,712 Cost of Products and Services Sold (7,013) (6,523) Selling, General and Administrative Expenses (1,205) (1,179) Operating Income $1,057 $1,010 Stock Based Compensation (1) 11 21 (1, 2) Repositioning and Other 135 105 (1) Pension and OPEB Expense 71 24 Segment Profit $1,274 $1,160 Operating Income $1,057 $1,010 ÷ Sales $9,275 $8,712 Operating Income Margin % 11.4% 11.6% Segment Profit $1,274 $1,160 ÷ Sales $9,275 $8,712 Segment Profit Margin % 13.7% 13.3% (1 Included in co st o f pro ducts and services so ld and selling, general and administrative expenses ) (2) Includes repo sitio ning, asbesto s, enviro nmental expenses and equity inco me (beginning 1 /2008) /1 4Q 2008 Earnings Release 14 January 30, 2009
  • 15. Reconciliation of Free Cash Flow to Cash Provided by Operating Activities and Calculation of Cash Flow Conversion 4Q07 4Q08 ($M ) Cash Provided by Operating Activities $1,440 $1,259 Expenditures for Property, Plant and Equipment (310) (332) Free Cash Flow 1,130 927 Cash taxes relating to the sale of the Consumable Solutions business - 166 Free Cash Flow excluding cash taxes relating to the sale of the Consumables Solution business 1,130 1,093 Cash Provided by Operating Activities $1,440 $1,259 ÷ Net Income 689 707 Operating Cash Flow Conversion % 209% 178% Free Cash Flow excluding cash taxes relating to the sale of the Consumables Solution business $1,130 $1,093 ÷ Net Income 689 707 Free Cash Flow excluding cash taxes relating to the sale of the Consumables Solution business Conversion % 164% 155% 4Q 2008 Earnings Release 15 January 30, 2009
  • 16. Reconciliation of Segment Profit to Operating Income and Calculation of Segment Profit and Operating Income Margin 2007 2008 ($B) Sales $34.6 $36.6 Cost of Products and Services Sold (26.3) (28.0) Selling, General and Administrative Expenses (4.6) (5.0) Operating Income $3.7 $3.6 Stock Based Compensation (1) 0.1 0.1 Repositioning and Other (1, 2) 0.6 1.0 Pension and OPEB Expense (1) 0.3 0.1 Segment Profit $4.7 $4.8 Operating Income $3.7 $3.6 ÷ Sales $34.6 $36.6 Operating Income Margin % 10.7% 9.8% Segment Profit $4.7 $4.8 ÷ Sales $34.6 $36.6 Segment Profit Margin % 13.5% 13.3% (1 Included in co st o f pro ducts and services so ld and selling, general and administrative expenses ) (2) Includes repo sitio ning, asbesto s, enviro nmental expenses and equity inco me (beginning 1 /2008) /1 4Q 2008 Earnings Release 16 January 30, 2009
  • 17. Reconciliation of Free Cash Flow to Cash Provided by Operating Activities and Calculation of Cash Flow Conversion 2007 2008 ($B) Cash Provided by Operating Activities $3.9 $3.8 Expenditures for Property, Plant and Equipment (0.8) (0.9) Free Cash Flow 3.1 2.9 Cash taxes relating to the sale of the Consumables Solution business - 0.2 Free Cash Flow excluding cash taxes relating to the sale of the Consumables Solution business $3.1 $3.1 Cash Provided by Operating Activities $3.9 $3.8 ÷ Net Income $2.4 2.8 Operating Cash Flow Conversion % 160% 136% Free Cash Flow excluding cash taxes relating to the sale of the Consumables Solution business $3.1 $3.1 ÷ Net Income $2.4 $2.8 Free Cash Flow excluding cash taxes relating to the sale of the Consumables Solution business Conversion % 129% 110% 4Q 2008 Earnings Release 17 January 30, 2009
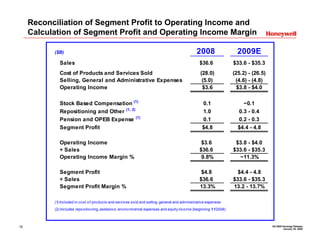
  • 18. Reconciliation of Segment Profit to Operating Income and Calculation of Segment Profit and Operating Income Margin 2008 2009E ($B) Sales $36.6 $33.6 - $35.3 Cost of Products and Services Sold (28.0) (25.2) - (26.5) Selling, General and Administrative Expenses (5.0) (4.6) - (4.8) Operating Income $3.6 $3.8 - $4.0 Stock Based Compensation (1) 0.1 ~0.1 Repositioning and Other (1, 2) 1.0 0.3 - 0.4 Pension and OPEB Expense (1) 0.1 0.2 - 0.3 Segment Profit $4.8 $4.4 - 4.8 Operating Income $3.6 $3.8 - $4.0 ÷ Sales $36.6 $33.6 - $35.3 Operating Income Margin % 9.8% ~11.3% Segment Profit $4.8 $4.4 - 4.8 ÷ Sales $36.6 $33.6 - $35.3 Segment Profit Margin % 13.3% 13.2 - 13.7% (1 Included in co st o f pro ducts and services so ld and selling, general and administrative expenses ) (2) Includes repo sitio ning, asbesto s, enviro nmental expenses and equity inco me (beginning 1 /2008) /1 4Q 2008 Earnings Release 18 January 30, 2009
  • 19. 4Q 2008 Earnings Release 19 January 30, 2009