


Honeywell Q4 2007 Earnings Conference Call Presentation
- 1. Fourth Quarter / Full Year 2007 Earnings Release January 25, 2008
- 2. Forward Looking Statements This report contains “forward-looking statements” within the meaning of Section 21E of the Securities Exchange Act of 1934. All statements, other than statements of fact, that address activities, events or developments that we or our management intend, expect, project, believe or anticipate will or may occur in the future are forward-looking statements. Forward-looking statements are based on management’s assumptions and assessments in light of past experience and trends, current conditions, expected future developments and other relevant factors. They are not guarantees of future performance, and actual results, developments and business decisions may differ from those envisaged by our forward-looking statements. Our forward-looking statements are also subject to risks and uncertainties, which can affect our performance in both the near- and long-term. We identify the principal risks and uncertainties that affect our performance in our Form 10-K and other filings with the Securities and Exchange Commission. 4Q 2007 Earnings Release 2 January 25, 2008
- 3. 2007 Summary • Strong Financial Performance – 10% Sales Growth – 25% EPS Growth – 129% Free Cash Flow Conversion • Effective Capital Allocation – $1.2B Acquisitions, $4.0B Repurchases, 10% Dividend Increase • Gaining Traction on Key Initiatives – HOS, FT, VPD™ • Confident in Outlook for 2008 Strong 2007 Performance; Well Positioned For 2008 4Q 2007 Earnings Release 3 January 25, 2008
- 4. 2007 Financial Summary 4Q FY ($M) 2006 2007 V 2006 2007 V Sales $ 8,276 $ 9,275 12% $ 31,367 $ 34,589 10% Segment Profit 1,097 1,274 16% 4,080 4,654 14% Margin 13.2% 13.7% +50 bps 13.0% 13.5% +50 bps EPS $ 0.72 $ 0.91 26% $ 2.52 $ 3.16 25% Free Cash Flow $ 941 $ 1,130 20% $ 2,478 $ 3,144 27% Conversion 161% 164% 119% 129% 4Q Financial Highlights 2007 Summary • Sales up 12% (Acq. / Div. +1%, FX +3%) • Sales up 10% (Acq. / Div. +1%, FX +2%) • Repositioning: $41M • Repositioning: $191M • Shares Repurchased: 3.5M • Shares Repurchased: 74.2M • Effective Tax Rate: 26.5% • Effective Tax Rate: 26.4% Another Terrific Year 4Q 2007 Earnings Release 4 January 25, 2008
- 5. Aerospace 4Q FY ($M) 2006 2007 V 2006 2007 V Sales $ 2,955 $ 3,267 11% $ 11,124 $ 12,236 10% Segment Profit 538 614 14% 1,892 2,197 16% Margin 18.2% 18.8% +60 bps 17.0% 18.0% +100 bps 4Q Financial Highlights 2007 Summary • Sales up 11% (Acq. +2%) • Sales up 10% (Acq. +1%) – Air Transport and Regional up 7% – Air Transport and Regional up 9% OE +4%, AM +8% OE +10%, AM +8% – Business and General Aviation up 23% – Business and General Aviation up 16% OE +31%, AM +15% OE +16%, AM +16% – Defense and Space up 9% – Defense and Space up 8% • Segment Profit up 14% • Segment Profit up 16% – Productivity + Price > Inflation – Productivity + Price > Inflation Strong 4Q And 2007 Results 4Q 2007 Earnings Release 5 January 25, 2008
- 6. Automation And Control Solutions 4Q FY ($M) 2006 2007 V 2006 2007 V Sales $ 3,045 $ 3,442 13% $ 11,020 $ 12,478 13% Segment Profit 385 425 10% 1,223 1,405 15% Margin 12.6% 12.4% (20) bps 11.1% 11.3% +20 bps 4Q Financial Highlights 2007 Summary • Sales up 13% (Acq. / Div. +2%, FX +6%) • Sales up 13% (Acq. / Div. +2%, FX +4%) – Products +9%, Growth in Environmental – Products +11%, New Products and Controls, Security and Life Safety Emerging Region Strength – Solutions +20%, Continued Emerging – Solutions +17%, Global Infrastructure and Region Strength Refining Growth Orders +30% Orders +13% • Segment Profit up 10% • Segment Profit up 15% – Productivity and Price More Than Offset – Productivity and Price Offset Inflation, Mix by Inflation, ERP and Mix Impact and Acquisition Impact Continued Good Momentum 4Q 2007 Earnings Release 6 January 25, 2008
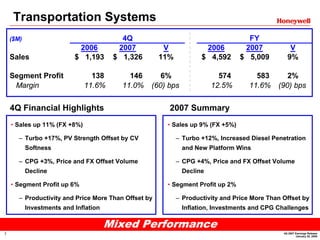
- 7. Transportation Systems 4Q FY ($M) 2006 2007 V 2006 2007 V Sales $ 1,193 $ 1,326 11% $ 4,592 $ 5,009 9% Segment Profit 138 146 6% 574 583 2% Margin 11.6% 11.0% (60) bps 12.5% 11.6% (90) bps 4Q Financial Highlights 2007 Summary • Sales up 11% (FX +8%) • Sales up 9% (FX +5%) – Turbo +17%, PV Strength Offset by CV – Turbo +12%, Increased Diesel Penetration Softness and New Platform Wins – CPG +3%, Price and FX Offset Volume – CPG +4%, Price and FX Offset Volume Decline Decline • Segment Profit up 6% • Segment Profit up 2% – Productivity and Price More Than Offset by – Productivity and Price More Than Offset by Investments and Inflation Inflation, Investments and CPG Challenges Mixed Performance 4Q 2007 Earnings Release 7 January 25, 2008
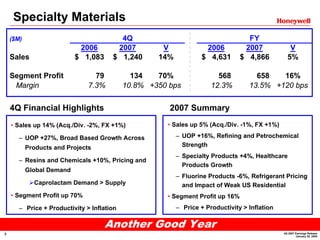
- 8. Specialty Materials 4Q FY ($M) 2006 2007 V 2006 2007 V Sales $ 1,083 $ 1,240 14% $ 4,631 $ 4,866 5% Segment Profit 79 134 70% 568 658 16% Margin 7.3% 10.8% +350 bps 12.3% 13.5% +120 bps 4Q Financial Highlights 2007 Summary • Sales up 5% (Acq./Div. -1%, FX +1%) • Sales up 14% (Acq./Div. -2%, FX +1%) – UOP +16%, Refining and Petrochemical – UOP +27%, Broad Based Growth Across Strength Products and Projects – Specialty Products +4%, Healthcare – Resins and Chemicals +10%, Pricing and Products Growth Global Demand – Fluorine Products -6%, Refrigerant Pricing Caprolactam Demand > Supply and Impact of Weak US Residential • Segment Profit up 70% • Segment Profit up 16% – Price + Productivity > Inflation – Price + Productivity > Inflation Another Good Year 4Q 2007 Earnings Release 8 January 25, 2008
- 9. 2008 Financial Guidance Summary Consolidated 2008 Growth Financial Outlook 2008E vs. 2007A ($B) Revenues $ 36.1 - 36.7 4% - 6% Segment Profit 5.0 - 5.2 8% - 13% Segment Margin 14.0% - 14.3% 50 bps - 80 bps Net Income 2.8 - 2.9 14% - 18% EPS $ 3.65 - 3.80 16% - 21% Free Cash Flow $ 3.2 - 3.4 2% - 8% Low End High End – Lower Global Growth + Stronger Global Growth – Unfavorable Mix - Aero OE / AM, + Favorable Mix - Aero OE / AM, ACS ACS Products / Solutions Products / Solutions – Inflation / Productivity Worse + Inflation / Productivity Better – Lower Pension Discount Rate + Higher Pension Discount Rate – Euro < $1.40 + Euro > $1.40 Maintaining Guidance For 2008 4Q 2007 Earnings Release 9 January 25, 2008
- 10. 1Q08 Preview ($B) Sales Comments • Growth in AT&R, B&GA, and D&S Aerospace ~$3.0 • Flight Hours +5% • Products and Solutions Growth Automation & Control ~3.1 • Continued Mix Impact • Turbo Growth Transportation ~1.3 • Some CPG Improvement • Broad Based Growth, UOP Strong Specialty Materials ~1.3 • Continued Global Demand 1Q08 Sales ~$8.7B EPS $0.80 – 0.83, Up 21 – 26% 4Q 2007 Earnings Release 10 January 25, 2008
- 11. Summary • Strong Finish to 2007 • Continuing to Build Performance Track Record • Company Well Positioned for 2008 • Investor Meeting February 25th Delivering In A Tougher Environment 4Q 2007 Earnings Release 11 January 25, 2008
- 12. Appendix Reconciliation of non-GAAP Measures to GAAP Measures 4Q 2007 Earnings Release 12 January 25, 2008
- 13. Reconciliation of Segment Profit to Operating Income and Calculation of Segment Profit and Operating Income Margin 4Q06 4Q07 ($M ) Sales $8,276 $9,275 Cost of Products and Services Sold (6,358) (7,013) Selling, General and Administrative Expenses (1,085) (1,205) Operating Income $833 $1,057 (1) Stock Based Compensation $16 $11 Repositioning and Other Charges (1) 133 135 Pension and OPEB Expense(1) 115 71 Segment Profit $1,097 $1,274 Operating Income $833 $1,057 ÷ Sales $8,276 $9,275 Operating Income Margin % 10.1% 11.4% Segment Profit $1,097 $1,274 ÷ Sales $8,276 $9,275 Segment Profit Margin % 13.2% 13.7% (1) Included in cost of products and services sold and selling, general and administrative expenses 4Q 2007 Earnings Release 13 January 25, 2008
- 14. Reconciliation of Free Cash Flow to Cash Provided by Operating Activities and Calculation of Cash Flow Conversion 4Q06 4Q07 ($M ) Cash Provided by Operating Activities $1,241 $1,440 Expenditures for Property, Plant and Equipment (300) (310) Free Cash Flow $941 $1,130 Cash Provided by Operating Activities $1,241 $1,440 ÷ Net Income $585 $689 Operating Cash Flow Conversion % 212% 209% Free Cash Flow $941 $1,130 ÷ Net Income $585 $689 Free Cash Flow Conversion % 161% 164% 4Q 2007 Earnings Release 14 January 25, 2008
- 15. Reconciliation of Segment Profit to Operating Income and Calculation of Segment Profit and Operating Income Margin 2006 2007 ($B) Sales $31.4 $34.6 Cost of Products and Services Sold (24.1) (26.3) Selling, General and Administrative Expenses (4.2) (4.6) Operating Income $3.1 $3.7 (1) Stock Based Compensation $0.1 $0.1 (1) Repositioning and Other Charges 0.5 0.6 Pension and OPEB Expense (1) 0.4 0.3 Segment Profit $4.1 $4.7 Operating Income $3.1 $3.7 ÷ Sales $31.4 $34.6 Operating Income Margin % 9.9% 10.7% Segment Profit $4.1 $4.7 ÷ Sales $31.4 $34.6 Segment Profit Margin % 13.0% 13.5% (1) Included in cost of products and services sold and selling, general and administrative expenses 4Q 2007 Earnings Release 15 January 25, 2008
- 16. Reconciliation of Free Cash Flow to Cash Provided by Operating Activities and Calculation of Cash Flow Conversion 2006 2007 ($B) Cash Provided by Operating Activities $3.2 $3.9 Expenditures for Property, Plant and Equipment (0.7) (0.8) Free Cash Flow $2.5 $3.1 Cash Provided by Operating Activities $3.2 $3.9 ÷ Net Income $2.1 $2.4 Operating Cash Flow Conversion % 154% 160% Free Cash Flow $2.5 $3.1 ÷ Net Income $2.1 $2.4 Free Cash Flow Conversion % 119% 129% 4Q 2007 Earnings Release 16 January 25, 2008
- 17. Reconciliation of Segment Profit to Operating Income and Calculation of Segment Profit and Operating Income Margin 2007 2008E ($B) Sales $34.6 $36.1 - 36.7 Cost of Products and Services Sold (26.3) (27.2) - (27.5) Selling, General and Administrative Expenses (4.6) (4.7) - (4.9) Operating Income $3.7 $4.2 - 4.3 (1) Stock Based Compensation $0.1 ~0.1 (1) Repositioning and Other Charges 0.6 0.5 - 0.6 Pension and OPEB Expense (1) 0.3 ~0.2 Segment Profit $4.7 $5.0 - 5.2 Operating Income $3.7 $4.2 - 4.3 ÷ Sales $34.6 $36.1 - 36.7 Operating Income Margin % 10.7% 11.6 - 11.7% Segment Profit $4.7 $5.0 - 5.2 ÷ Sales $34.6 $36.1 - 36.7 Segment Profit Margin % 13.5% 14.0 - 14.3% (1) Included in costs of products and services sold and selling, general and administrative expenses 4Q 2007 Earnings Release 17 January 25, 2008
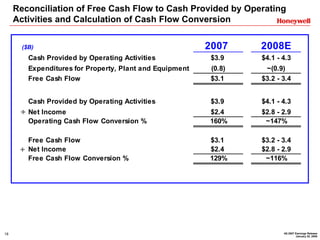
- 18. Reconciliation of Free Cash Flow to Cash Provided by Operating Activities and Calculation of Cash Flow Conversion 2007 2008E ($B) Cash Provided by Operating Activities $3.9 $4.1 - 4.3 Expenditures for Property, Plant and Equipment (0.8) ~(0.9) Free Cash Flow $3.1 $3.2 - 3.4 Cash Provided by Operating Activities $3.9 $4.1 - 4.3 ÷ Net Income $2.4 $2.8 - 2.9 Operating Cash Flow Conversion % 160% ~147% Free Cash Flow $3.1 $3.2 - 3.4 ÷ Net Income $2.4 $2.8 - 2.9 Free Cash Flow Conversion % 129% ~116% 4Q 2007 Earnings Release 18 January 25, 2008
- 19. 4Q 2007 Earnings Release 19 January 25, 2008