


hurricanes-math
- 1. Learning about hurricanes: Parabolas, Spirals, and Trochoides D. Quesada School of Science, Technology and Engineering Management St. Thomas University, Miami Gardens, FL 33054
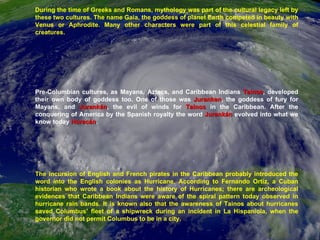
- 3. During the time of Greeks and Romans, mythology was part of the cultural legacy left by these two cultures. The name Gaia, the goddess of planet Earth competed in beauty with Venus or Aphrodite. Many other characters were part of this celestial family of creatures. Pre-Columbian cultures, as Mayans, Aztecs, and Caribbean Indians Tainos , developed their own body of goddess too. One of those was Juranken , the goddess of fury for Mayans, and Jurankán , the evil of winds for Tainos in the Caribbean. After the conquering of America by the Spanish royalty the word Jurankán evolved into what we know today Huracán . The incursion of English and French pirates in the Caribbean probably introduced the word into the English colonies as Hurricane. According to Fernando Ortiz, a Cuban historian who wrote a book about the history of Hurricanes; there are archeological evidences that Caribbean Indians were aware of the spiral pattern today observed in hurricane rain bands. It is known also that the awareness of Tainos about hurricanes saved Columbus’ fleet of a shipwreck during an incident in La Hispaniola, when the governor did not permit Columbus to be in a city.
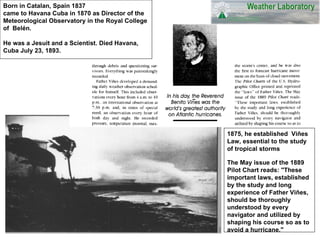
- 4. Born in Catalan, Spain 1837 came to Havana Cuba in 1870 as Director of the Meteorological Observatory in the Royal College of Belén. He was a Jesuit and a Scientist. Died Havana, Cuba July 23, 1893. 1875, he established Viñes Law, essential to the study of tropical storms The May issue of the 1889 Pilot Chart reads: "These important laws, established by the study and long experience of Father Viñes, should be thoroughly understood by every navigator and utilized by shaping his course so as to avoid a hurricane."
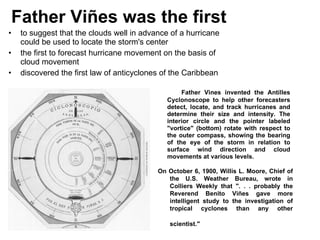
- 5. Father Viñes was the first to suggest that the clouds well in advance of a hurricane could be used to locate the storm's center the first to forecast hurricane movement on the basis of cloud movement discovered the first law of anticyclones of the Caribbean Father Vines invented the Antilles Cyclonoscope to help other forecasters detect, locate, and track hurricanes and determine their size and intensity. The interior circle and the pointer labeled "vortice" (bottom) rotate with respect to the outer compass, showing the bearing of the eye of the storm in relation to surface wind direction and cloud movements at various levels. On October 6, 1900, Willis L. Moore, Chief of the U.S. Weather Bureau, wrote in Colliers Weekly that ". . . probably the Reverend Benito Viñes gave more intelligent study to the investigation of tropical cyclones than any other scientist."
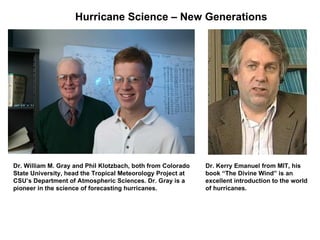
- 6. Dr. William M. Gray and Phil Klotzbach, both from Colorado State University, head the Tropical Meteorology Project at CSU’s Department of Atmospheric Sciences. Dr. Gray is a pioneer in the science of forecasting hurricanes. Dr. Kerry Emanuel from MIT, his book “The Divine Wind” is an excellent introduction to the world of hurricanes. Hurricane Science – New Generations
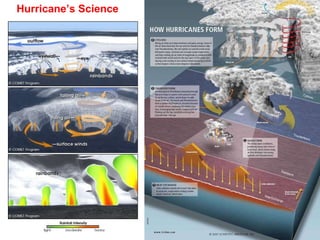
- 8. A Simple Model of the Anatomy of a Hurricane How tall is a hurricane? Let keep in mind that most of the clouds and storms will be located within the troposphere . Thus, in a first approximation the top edge for a hurricane might be considered the upper boundary of the troposphere, a number around 10 km . Therefore, hurricanes are more or less 10 km tall . How wide they are? Typical hurricanes are considered those for which the distance from their center of circulation to their outermost closed isobar ranges between 3 and 6 latitude degrees, in other words, hurricanes with a radius between 333 and 666 kilometers (look at these numbers, interesting!!!). With this information in mind, which picture illustrates better this situation? The eye is normally circular in shape, and may range in size from 3 to 370 km (2 – 230 miles) in diameter. Size of a hurricane Eye of a hurricane A = π (R 2 – r 2 ) Area covered by rain bands A B
- 9. Hurricane sizes are estimated by measuring the distance from their center of circulation to their outermost closed isobar. If the radius (R) is: Less than two degrees latitude, then the cyclone is “very small” or a midget . Radii of 2 – 3 degrees are considered “small”. Radii between 3 and 6 latitude degrees are considered “average size”. Tropical cyclones are considered “large” when the closed isobar radius is 6 – 8 degrees of latitude. “ Very large” tropical cyclones have a radius of greater than 8 degrees. A Simple Model of the Anatomy of a Hurricane The full circumference equals 360 o . In order to convert degrees into units of distance a simple proportion is used: Greater than 8 Very Large Between 6 and 8 Large Between 3 and 6 Average size Between 2 and 3 Small Less than 2 Very Small or midget Radius in Km Radius in Degrees Latitude Hurricane size classification
- 10. A Simple Model of the Anatomy of a Hurricane Hurricanes in a first approximation can be seen as hollow cylinders, where the inner core would represent the so called eye of the hurricane, and the outer cylindrical shell contains all rain bands. By using this simple model of a hurricane, 1. Find the volume occupied by rain bands (Hint: the volume of a cylinder is given by V = π R 2 H, where R is the radius, and H the height). For typical hurricanes (average size), the size of the inner core (eye of the hurricane) is around 50 mi . 2. By using the table provided in the Introduction, find out the approximate values for volumes of water contained in all of these three basins: Pacific Ocean, Atlantic Ocean, Caribbean and Gulf of Mexico. Once you have gotten these numbers, compare them with the volume occupied by rain bands found in the previous point (a). How many hurricanes these sizes are needed to fill out each one of these basins? H A = π (R 2 – r 2 ) Area covered by rain bands # of hurricanes needed Volume Caribbean and Gulf of Mexico Atlantic Ocean Pacific Ocean 329 1,370 139.4 361.1 12,430 3790 World Ocean 1 4.2 1.1 3.0 4,690 1430 Mediterranean and Black Sea 0.005 0.02 0.2 0.4 180 55 Baltic Sea 0.04 0.16 0.5 1.2 331 101 Hudson Bay 4.1 17 5.4 14.1 4,300 1,300 Artic Ocean 2.3 9.6 1.7 4.3 7,300 2,200 Gulf of Mexico and Caribbean Sea 64.7 269.3 26.5 68.5 12,800 3,900 Indian Ocean 75.2 313.4 30 76.8 12,900 3,900 Atlantic Ocean 163.1 679.6 60.1 155.6 14,000 4,300 Pacific Ocean 10 6 mi 3 10 6 km 3 10 6 mi 2 10 6 km 2 ft m Ocean or Sea Volume Area Depth Average
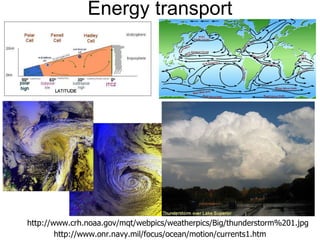
- 11. Energy transport http://www.onr.navy.mil/focus/ocean/motion/currents1.htm http://www.crh.noaa.gov/mqt/webpics/weatherpics/Big/thunderstorm%201.jpg
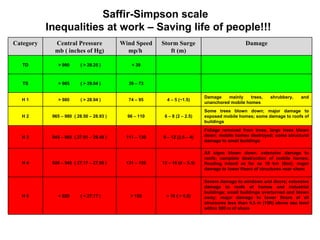
- 12. Saffir-Simpson scale Inequalities at work – Saving life of people!!! Severe damage to windows and doors; extensive damage to roofs of homes and industrial buildings; small buildings overturned and blown away; major damage to lower floors of all structures less than 4.5 m (15ft) above sea level within 500 m of shore > 18 ( > 5.5) > 155 < 920 ( < 27.17 ) H 5 All signs blown down; extensive damage to roofs; complete destruction of mobile homes; flooding inland as far as 10 km (6mi); major damage to lower floors of structures near shore 13 – 18 (4 – 5.5) 131 – 155 920 – 945 ( 27.17 – 27.90 ) H 4 Foliage removed from trees, large trees blown down; mobile homes destroyed; some structural damage to small buildings 9 – 12 (2.5 – 4) 111 – 130 945 – 965 ( 27.91 – 28.49 ) H 3 Some trees blown down; major damage to exposed mobile homes; some damage to roofs of buildings 6 – 8 (2 – 2.5) 96 – 110 965 – 980 ( 28.50 – 28.93 ) H 2 Damage mainly trees, shrubbery, and unanchored mobile homes 4 – 5 (~1.5) 74 – 95 > 980 ( > 28.94 ) H 1 39 – 73 > 985 ( > 29.04 ) TS < 39 > 990 ( > 29.25 ) TD Damage Storm Surge ft (m) Wind Speed mp/h Central Pressure mb ( inches of Hg) Category
- 13. Wind Hazards
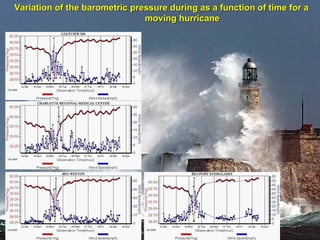
- 14. Variation of the barometric pressure during as a function of time for a moving hurricane
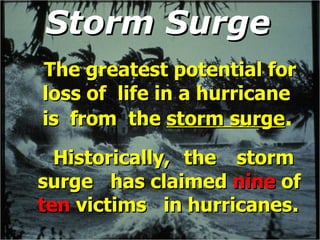
- 15. Storm Surge The greatest potential for loss of life in a hurricane is from the storm surge . Historically, the storm surge has claimed nine of ten victims in hurricanes .
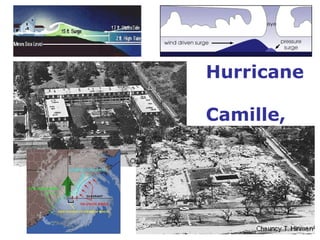
- 16. Hurricane Camille, 1969
- 17. AP Photo FLEEING HURRICANE GEORGES IN KEY WEST
- 18. How to estimate the force exerted by the mass of water in the storm surge? Height above sea level = h Direction of motion of the mass of water h Width of the storm surge area = w Depth of the storm surge area = d Speed of motion of sea water – v Volume of the mass of sea water = V V = w d h The net force produced by this Mass of water equals: Urban areas located near the coast will Suffer the impact of the storm surge forces. If building are not made such that, they may afford a high load on their walls, then, they will collapse after the impact.
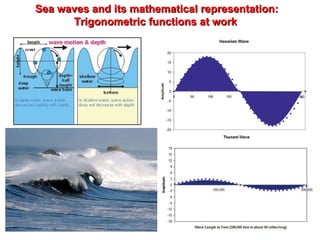
- 19. Sea waves and its mathematical representation: Trigonometric functions at work
- 20. Building a family of trigonometric functions
- 21. Conditions Necessary for a Fully Developed Sea at Given Winds Speeds 14.3 sec 212.2 m 696 ft 14.8 m 48.7 ft 69 hr 2627 km 1633 mi 92 km/hr 58 mi/hr 11.4 sec 136 m 446 ft 8.5 m 27.9 ft 42 hr 1313 km 816 mi 74 km/hr 46 mi/hr 8.6 sec 76.5 m 251 ft 4.1 m 13.6 ft 23 hr 518 km 322 mi 56 km/hr 35 mi/hr 5.7 sec 33.8 m 111 ft 1.5 m 4.9 ft 10 hr 139 km 86 mi 37 km/hr 23 mi/hr 3.0 sec 8.5 m 28 ft 0.27 m 0.9 ft 2 hr 19 km 12 mi 19 km/hr 12 mi/hr Average Period Average Wavelength Average Height Wind Duration Fetch Wind Speed in One Direction Wave Size Wind Conditions
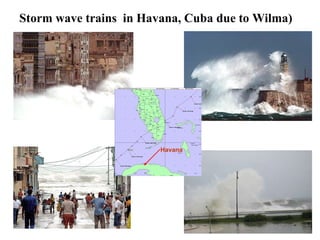
- 22. Storm wave trains in Havana, Cuba due to Wilma) Havana
- 23. Atlantic Hurricane Basin Climatology : Mean, Median, Mode A distribution function – The Number of counts per item Peak of the Season – Mean value of the distribution
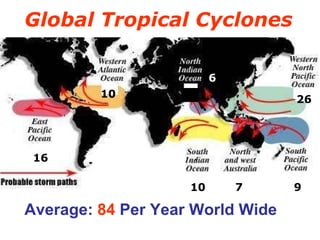
- 24. Global Tropical Cyclones 10 26 16 10 7 9 6 Average: 84 Per Year World Wide
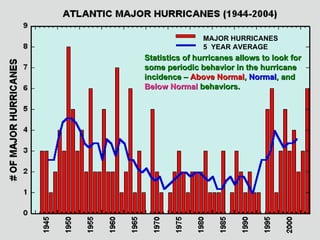
- 25. MAJOR HURRICANES 5 YEAR AVERAGE Statistics of hurricanes allows to look for some periodic behavior in the hurricane incidence – Above Normal , Normal , and Below Normal behaviors.
- 26. Ocean impacts The hurricane brings colder ocean water into the box (both from below, and from upstream) Before After Imagery courtesy of GSFC/NASA: http://svs.gsfc.nasa.gov/vis/a000000/a001000/a001066/ Atmosphere impacts Example: The week after hurricane Gloria (1985) impacted New England, it arrived as an intense fall storm in Europe. The 4 th of October, 1985 was the warmest day in the 20 th century in Switzerland (NHC)
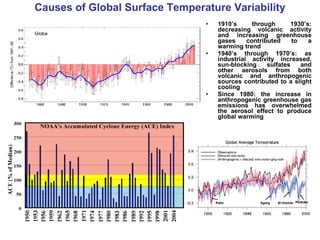
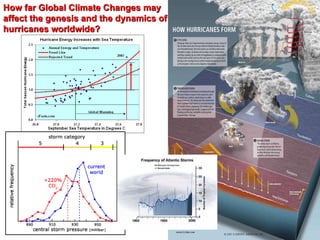
- 27. Causes of Global Surface Temperature Variability 1910’s through 1930’s: decreasing volcanic activity and increasing greenhouse gases contributed to a warming trend 1940’s through 1970’s: as industrial activity increased, sun-blocking sulfates and other aerosols from both volcanic and anthropogenic sources contributed to a slight cooling Since 1980: the increase in anthropogenic greenhouse gas emissions has overwhelmed the aerosol effect to produce global warming
- 28. How far Global Climate Changes may affect the genesis and the dynamics of hurricanes worldwide?
- 29. Climatological Tracks of Atlantic Basin Tropical Cyclones Most of the Hurricanes follow a parabolic path that can be a motivation for Algebra
- 30. Tracking a Hurricane: Domain and Range A point with coordinates (x,y) where X is the Longitude and Y the Latitude The domain of the hurricane’s track Is the collection of all longitudes , while The range is the collection of latitudes .
- 31. Hurricane’s Tracks Possible tracks: A line – y = mx + b A parabola – x =ay 2 + by + c A cubic curve A curve with a loop Is there any correlation between the kind of a curve a hurricane’s track will follow and the weather or season?
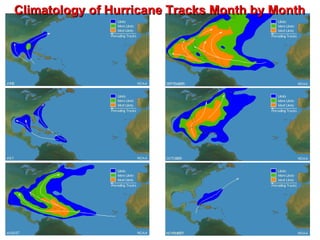
- 32. Climatology of Hurricane Tracks Month by Month
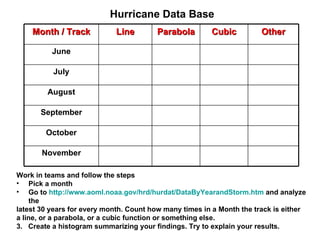
- 33. Hurricane Data Base Work in teams and follow the steps Pick a month Go to http://www.aoml.noaa.gov/hrd/hurdat/DataByYearandStorm.htm and analyze the latest 30 years for every month. Count how many times in a Month the track is either a line, or a parabola, or a cubic function or something else. 3. Create a histogram summarizing your findings. Try to explain your results. November October September August July June Other Cubic Parabola Line Month / Track
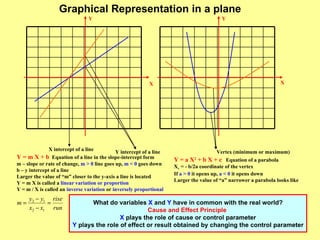
- 36. X intercept of a line Y intercept of a line X X Y Y Y = m X + b Equation of a line in the slope-intercept form m – slope or rate of change, m > 0 line goes up, m < 0 goes down b – y intercept of a line Larger the value of “m” closer to the y-axis a line is located Y = m X is called a linear variation or proportion Y = m / X is called an inverse variation or inversely proportional Vertex (minimum or maximum) Y = a X 2 + b X + c Equation of a parabola X v = - b/2a coordinate of the vertex If a > 0 it opens up, a < 0 it opens down Larger the value of “a” narrower a parabola looks like Graphical Representation in a plane What do variables X and Y have in common with the real world? Cause and Effect Principle X plays the role of cause or control parameter Y plays the role of effect or result obtained by changing the control parameter
- 37. Vertex X Y Points of the parabola X = aY 2 + bY + c 1. Substitute (X,Y) into the equation of the Parabola. 2. Set the system of linear equations: X 1 = a(Y 1 ) 2 + bY 1 + c X 2 = a(Y 2 ) 2 + bY 2 + c X 3 = a(Y 3 ) 2 + bY 3 + c 3. Solve the system in order to obtain the coefficients a, b, and c. 4. Once coefficients are obtained, then find the vertex according to:
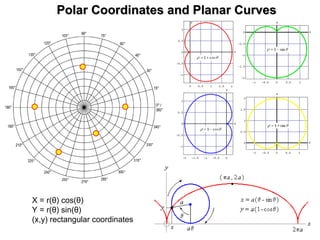
- 38. Polar Coordinates and Planar Curves X = r( θ ) cos( θ ) Y = r( θ ) sin( θ ) (x,y) rectangular coordinates
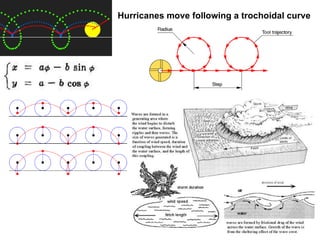
- 39. Hurricanes move following a trochoidal curve
- 40. Spiral patterns in hurricanes
- 41. Logarithmic Spirals – The preferred spirals of Nature
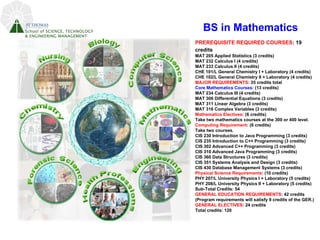
- 42. BS in Mathematics PREREQUISITE REQUIRED COURSES : 19 credits MAT 205 Applied Statistics (3 credits) MAT 232 Calculus I (4 credits) MAT 233 Calculus II (4 credits) CHE 101/L General Chemistry I + Laboratory (4 credits) CHE 102/L General Chemistry II + Laboratory (4 credits) MAJOR REQUIREMENTS : 35 credits total Core Mathematics Courses : (13 credits) MAT 234 Calculus III (4 credits) MAT 306 Differential Equations (3 credits) MAT 311 Linear Algebra (3 credits) MAT 316 Complex Variables (3 credits) Mathematics Electives : (6 credits) Take two mathematics courses at the 300 or 400 level. Computing Requirement : (6 credits) Take two courses. CIS 230 Introduction to Java Programming (3 credits) CIS 235 Introduction to C++ Programming (3 credits) CIS 302 Advanced C++ Programming (3 credits) CIS 310 Advanced Java Programming (3 credits) CIS 360 Data Structures (3 credits) CIS 351 Systems Analysis and Design (3 credits) CIS 430 Database Management Systems (3 credits) Physical Science Requirements : (10 credits) PHY 207/L University Physics I + Laboratory (5 credits) PHY 208/L University Physics II + Laboratory (5 credits) Sub-Total Credits: 54 GENERAL EDUCATION REQUIREMENTS : 42 credits (Program requirements will satisfy 9 credits of the GER.) GENERAL ELECTIVES : 24 credits Total credits: 120
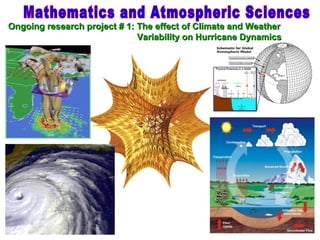
- 43. Mathematics and Atmospheric Sciences Ongoing research project # 1: The effect of Climate and Weather Variability on Hurricane Dynamics
- 44. Ongoing research project # 2: Asthma – Weather connection Air Quality and Respiratory disorders: Modeling asthma attacks considering the environmental triggers, the mechanics of lung functioning, immune response and genetic factors. Asthma Statistics Worldwide: A brief overview # of people diagnosed: more than 150 M Europe: the # of cases has doubled USA: the # of cases has increased more than 60% India: between 15 and 20 M Africa: between 11 and 18% population # of deaths yearly: around 180,000 Miami Dade County – 7.1% Middle and HS children were reported with asthma The # of hospitalizations due to asthma has doubled. The # 1 cause of school absences and 35 % of parents missed work Urban Heat Island Effect Man is likely playing a role in climate change through urbanization and land use changes competing with greenhouse Gases and cycles of Nature In cities, vertical walls, steel and concrete absorb the sun’s heat and are slow to cool at night Nights may be 10 or more degrees warmer in and near cities than in rural areas some nights Temperatures measured in cities increase as they grow.
- 45. Science & Mathematics Fellows Program Start Date: August 2008 - 30 freshmen & 30 juniors who transfer with an AA. Qualified students may receive financial aid and academic scholarships. Research based in state of the art Science & Technology facility.
- 46. The question is… Can we cross the bridge?
Editor's Notes
- Slides 41-46 are from the upcoming IPCC report, due out on February, 2007. THESE MUST NOT BE PUBLISHED IN ANY FORM PRIOR TO THAT TIME. They were not included on the CD-ROM and will be blocked from the webcast.
- Track chart of the storms of the 2004 Atlantic hurricane season