


Hypothesis testing
- 1. Hypothesis Testing The Basics Advanced Statistics SRSTHS Mrs. Ma. Cristina C. Pegollo
- 2. What is Hypothesis? in statistics, is a claim or statement about a property of a population an educated guess about the population parameter
- 3. What is hypothesis testing? This is the process of making an inference or generalization on population parameters based on the results of the study on samples.
- 4. What is statistical hypothesis? It is a guess or prediction made by the researcher regarding the possible outcome of the study.
- 6. Central Limit Theorem If n (the sample size) is large, the theoretical sampling distribution of the mean can be approximated closely with a normal distribution. If researchers increase the samples to a considerable number, the shape of the distribution approximates a normal curve.
- 7. Central Limit Theorem The Expected Distribution of Sample Means Assuming that = 98.6 Likely sample means µx = 98.6
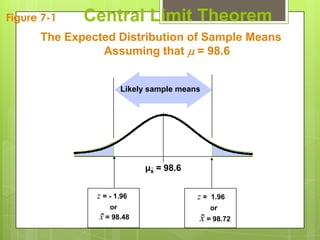
- 8. Figure 7-1 Central Limit Theorem The Expected Distribution of Sample Means Assuming that = 98.6 Likely sample means µx = 98.6 z = - 1.96 z= 1.96 or or x = 98.48 x = 98.72
- 9. Components of a Formal Hypothesis Test
- 10. Null Hypothesis: H0 This is the statement that is under investigation or being tested. It is always hoped to be rejected. Usually the null hypothesis represents a statement of “no effect”, “no difference”, or , put another way, “things haven’t changed.” Must contain condition of equality =, , or Reject H0 or fail to reject H0
- 11. Alternative Hypothesis: H1 This is the statement you will adopt in the situation in which the evidence (data) is so strong that you reject H0 „opposite‟ of H0 , <, > generally represents the idea which the researcher wants to prove.
- 12. Example1: Null and Alternate Hypothesis
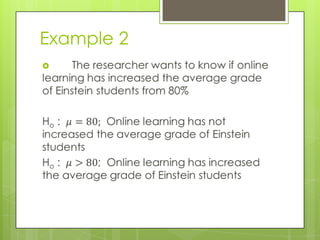
- 13. Example 2
- 14. Example 3
- 15. Example 4
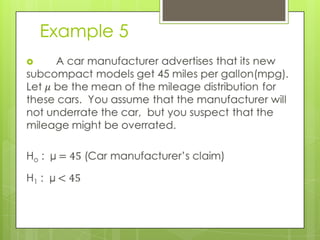
- 16. Example 5
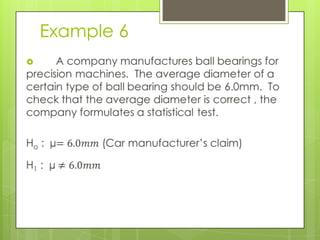
- 17. Example 6
- 18. Note about Forming Your Own Claims (Hypotheses) If you are conducting a study and want to use a hypothesis test to support your claim, the claim must be worded so that it becomes the alternative hypothesis.
- 19. Note about Testing the Validity of Someone Else’s Claim Someone else’s claim may become the null hypothesis (because it contains equality), and it sometimes becomes the alternative hypothesis (because it does not contain equality).
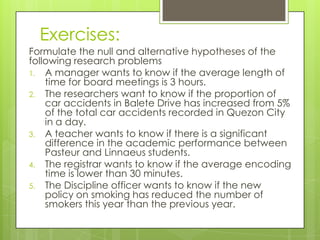
- 20. Exercises: Formulate the null and alternative hypotheses of the following research problems 1. A manager wants to know if the average length of time for board meetings is 3 hours. 2. The researchers want to know if the proportion of car accidents in Balete Drive has increased from 5% of the total car accidents recorded in Quezon City in a day. 3. A teacher wants to know if there is a significant difference in the academic performance between Pasteur and Linnaeus students. 4. The registrar wants to know if the average encoding time is lower than 30 minutes. 5. The Discipline officer wants to know if the new policy on smoking has reduced the number of smokers this year than the previous year.
- 21. Test Statistic a value computed from the sample data that is used in making the decision about the rejection of the null hypothesis
- 22. Test Statistic a value computed from the sample data that is used in making the decision about the rejection of the null hypothesis For large samples, testing claims about population means x - µx z= n
- 23. Critical Region Set of all values of the test statistic that would cause a rejection of the null hypothesis
- 24. Critical Region Set of all values of the test statistic that would cause a rejection of the null hypothesis Critical Region
- 25. Critical Region Set of all values of the test statistic that would cause a rejection of the null hypothesis Critical Region
- 26. Critical Region Set of all values of the test statistic that would cause a rejection of the null hypothesis Critical Regions
- 27. Significance Level denoted by the probability that the test statistic will fall in the critical region when the null hypothesis is actually true. common choices are 0.05, 0.01, and 0.10
- 28. Critical Value Value or values that separate the critical region (where we reject the null hypothesis) from the values of the test statistics that do not lead to a rejection of the null hypothesis
- 29. Critical Value Value or values that separate the critical region (where we reject the null hypothesis) from the values of the test statistics that do not lead to a rejection of the null hypothesis Critical Value ( z score )
- 30. Critical Value Value or values that separate the critical region (where we reject the null hypothesis) from the values of the test statistics that do not lead to a rejection of the null hypothesis Reject H0 Fail to reject H0 Critical Value ( z score )
- 31. Two-tailed,Right-tailed, Left-tailed Tests The tails in a distribution are the extreme regions bounded by critical values.
- 32. Two-tailed Test H0: µ = 100 H1: µ 100
- 33. Two-tailed Test H0: µ = 100 is divided equally between H1: µ 100 the two tails of the critical region
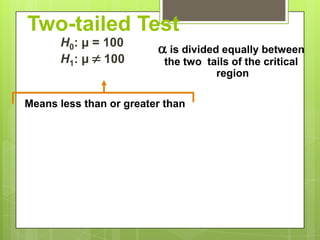
- 34. Two-tailed Test H0: µ = 100 is divided equally between H1: µ 100 the two tails of the critical region Means less than or greater than
- 35. Two-tailed Test H0: µ = 100 is divided equally between H1: µ 100 the two tails of the critical region Means less than or greater than Reject H0 Fail to reject H0 Reject H0 100 Values that differ significantly from 100
- 36. Right-tailed Test H0: µ 100 H1: µ > 100
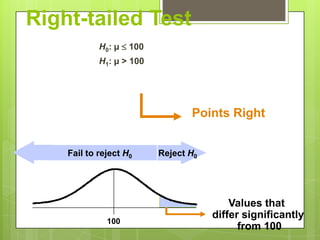
- 37. Right-tailed Test H0: µ 100 H1: µ > 100 Points Right
- 38. Right-tailed Test H0: µ 100 H1: µ > 100 Points Right Fail to reject H0 Reject H0 Values that differ significantly 100 from 100
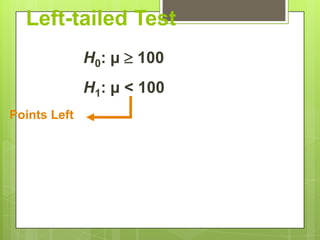
- 39. Left-tailed Test H0: µ 100 H1: µ < 100
- 40. Left-tailed Test H0: µ 100 H1: µ < 100 Points Left
- 41. Left-tailed Test H0: µ 100 H1: µ < 100 Points Left Reject H0 Fail to reject H0 Values that differ significantly 100 from 100
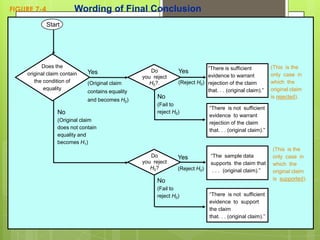
- 42. Conclusions in Hypothesis Testing always test the null hypothesis 1. Reject the H0 2. Fail to reject the H0 need to formulate correct wording of final conclusion See Figure 7-4
- 43. FIGURE 7-4 Wording of Final Conclusion Start Does the “There is sufficient (This is the original claim contain Yes Do Yes you reject evidence to warrant only case in the condition of (Original claim H0?. (Reject H0) rejection of the claim which the equality that. . . (original claim).” original claim contains equality and becomes H0) No is rejected). (Fail to “There is not sufficient No reject H0) evidence to warrant (Original claim rejection of the claim does not contain that. . . (original claim).” equality and becomes H1) (This is the Do Yes “The sample data only case in you reject supports the claim that which the H0? (Reject H0) . . . (original claim).” original claim No is supported). (Fail to reject H0) “There is not sufficient evidence to support the claim that. . . (original claim).”
- 44. Accept versus Fail to Reject some texts use “accept the null hypothesis we are not proving the null hypothesis sample evidence is not strong enough to warrant rejection (such as not enough evidence to convict a suspect) If you reject Ho, iit means it is wrong! Ifyou fail to reject Ho , it doesn’t mean it is correct – you simply do not have enough evidence to reject it!
- 45. Type I Error The mistake of rejecting the null hypothesis when it is true. (alpha) is used to represent the probability of a type I error Example:Rejecting a claim that the mean body temperature is 98.6 degrees when the mean really does equal 98.6
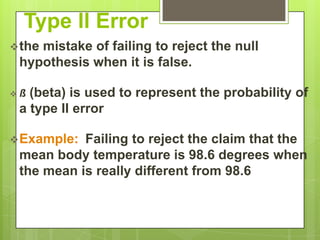
- 46. Type II Error the mistake of failing to reject the null hypothesis when it is false. ß (beta) is used to represent the probability of a type II error Example: Failing to reject the claim that the mean body temperature is 98.6 degrees when the mean is really different from 98.6
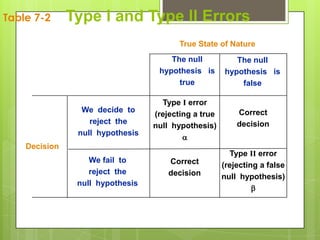
- 47. Table 7-2 Type I and Type II Errors True State of Nature The null The null hypothesis is hypothesis is true false Type I error We decide to Correct (rejecting a true reject the decision null hypothesis) null hypothesis Decision Type II error We fail to Correct (rejecting a false reject the decision null hypothesis) null hypothesis
- 48. Controlling Type I and Type II Errors Forany fixed , an increase in the sample size n will cause a decrease in For any fixed sample size n , a decrease in will cause an increase in . Conversely, an increase in will cause a decrease in . Todecrease both and , increase the sample size.
- 49. Approaches in Hypothesis Testing 1. Critical Value Approach 2. P-value Approach
- 51. Example: The average score in the final examination in College Algebra at ABC University is known to be 80 with a standard deviation of 10. A random sample of 39 students was taken from this year’s batch and it was found that they have a mean score of 84. Test at 0.05 level of significance.