Location via proxy:   [ UP ]  
[Report a bug]   [Manage cookies]                
SlideShare a Scribd company logo
Indian Economic & Trade Policy Session-1 MBA (IB) – 2006-09
Course Structure & Evaluation 1. Structure of Indian Economy   2. Policy & Execution   3. Sector-specific Issues & Development   (Agriculture, Industry & Service) 4. Social Sector Development  & Poverty 5. Overview of External Sector   6. Trade Policy   7. FDI – An Indian Perspective   8. Review of the Course
Economic Planning Key Objectives – Growth, Equity & Social Justice Other objectives – Economic Growth Reduction of Inequality Employment  Economic Self-Reliance Modernisation of various sectors Redressing regional imbalances  How these objectives  are related to business?
GROWTH PERFORMANCE IN THE FIVE YEAR PLAN PERIOD 5.54 5.2 Sixth 5.35 6.5 Ninth 6.0 5.6 Eighth 6.02 5.0 Seventh 4.83 4.4 Fifth 2.05 5.7 Fourth 2.72 5.6 Third 4.21 4.5 Second 3.6 2.1 First Actual Target Plan
Indian Economy –  Policy & Challenges Post-Independence Focus on large scale industrialization Hindu growth rate Green Revolution (self-sufficiency in food) Anti-poverty development programme Policy shift from control to gradual decontrol Post-1990 Period Broad based reforms & SAP Demand driven growth supported by investment & private consumption Capital inflows & business environment Inclusive growth, sustainable business, CSR
Performance of Indian Economy: Four Phases: I (1951-65), II (1965-81), III(1981-88), IV (1989-2006) Phase-I: 1951-65 (growth 4.1%) Coherent Dev. Strategy – institution building Relatively liberal policy: free import regime,  liberal investment licensing,  Open to direct foreign investment
Performance of Indian Economy: Phase-II: 1965-81 (growth 3.2%) – darkest period Foreign exchange budgeting – tight imports and investments Major policy shift towards state control Nationalization of banks, oil companies, coal mines Restriction on foreign company operation Investment  by large firms to core sectors Ceiling on urban land holding Labour laws – firms with more than 100 employees Growth rate declined 2.6% (1966-75) Many restrictions imposed during this period proved politically difficult to undo later
Performance of Indian Economy: Phase-II: 1965-81 contd… Growth rate declined to 2.6 (1965-75) – it was clear that govt. strategy did not work. Strategy to easy up on state controls  Administrative measures, capacity expansion, de-licensing select sectors,  Import liberalization – open general licensing (1977) & further expansion Major depreciation of rupee to expand exports Expansionary fiscal policy & external borrowing
Performance of Indian Economy: Phase-III: 1981-88 (growth 4.2%) Acceleration of liberalization and expansionary fiscal policy financed by external borrowing It improved growth up to 7.6% (1988-89) BoP crisis –Gulf war - jump in in Oil prices  Growth declined to 1.2% (1991-92)
Performance of Indian Economy: Phase-IV: 1989- 2006 Policy shift from piecemeal reform to more systematic reforms Dismantle licensing on machinery & raw material imports, lower industrial tariffs,  open to foreign investment,  Reform in direct & indirect taxes, financial sector Trimming of fiscal deficit Open select sector to private sector – telecom, civil aviation Growth rate up 7.1% (1993-97) Reforms became slow during 1996-1999 - political factor  New initiatives in 1999 - Foreign & domestic competition, focus on infrastructure, import licensing on consumer goods,  Reduction in tariffs, pvt of public sector, insurance sector, liberal interest rate, freed up several external capital A/c Urban land ceiling Act replaced, Huge highway construction Electricity Act 2003, Amendment of company Act 1956
GDP Growth (at factor cost)
 
Sectoral Growth Performance  (%) 6.3 7.8 6.8 6.5 3.4 1988-06 4.8 6.5 7.1 6.3 2.1 1981-88 3.2 4.3 3.9 4.0 2.1 1965-81 4.1 4.7 6.6 6.7 2.9 1951-65 Total GDP Service Manf. Industry Agrl &  Allied Period
Sectoral Growth – Recent Trend
Sectoral Composition of GDP   (%) 100 52 17 27 21 2004-05 100 41 16 26 33 1987-88 100 36 14 24 40 1980-81 100 31 12 21 49 1964-65 100 28 9 15 57 1950-51 Total GDP Service Manf. Industry Agrl &  Allied Period
Structural Transformation in India Agrarian rural economy to modern one – by passed industrial growth to service sector growth 90 % workforce in informal sector outside Agr. Slow industrial (Manf.) growth – loss of comp. advantage Stagnation/slow growth of unskilled labour-intensive sectors – apparel, textile, footwear,  Organized sector growth limited to capital based (steel, auto) or service based (software, pharma) Trade sector – trade facilitation, high tariffs, export subsidy
ECONOMIC CRISIS, GROWTH &  REFORMS Macro Economic Crisis of 1990s – three aspects  Fragile BoP situation Inflationary Pressure Fiscal Imbalance
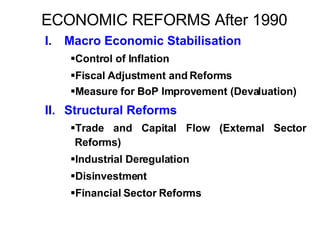
ECONOMIC REFORMS After 1990 I. Macro Economic Stabilisation Control of Inflation Fiscal Adjustment and Reforms Measure for BoP Improvement (Devaluation) II. Structural Reforms Trade and Capital Flow (External Sector Reforms) Industrial Deregulation Disinvestment Financial Sector Reforms
Reforms for Growth Forex-Market Reforms  (Full current A/c convertibility) Reforms in Foreign Investment Regime  (Liberalising rules for FDI and allowing FII) Reforms in Infrastructure (PPP) Reforms in the form of EXIM policy  (Tariff Rate reduction, QR removal, etc) Allowing Indian companies to invest abroad Challenges and Opportunities ( Threat to SSIs?) Joint Ventures with Foreign Companies in India and Abroad Compatibles with WTO Framework
Emerging India– in Trade Perspective (Faster Integrating to World Economy)   GDP Growth  13.8% (in real $ terms) 2003-07 Merchandise Export  (in current $) 18.1 billion in (1991) doubled in 1999-00 & 102.7 billion in 2005-06 Service Exports  increased from 26.9 billion in 2003-4 to 60.6 billion In 2005-06 Trade constitutes 43% of GDP:   Export as % of GDP  – 7.2% (1991), 11.6% (1999-00) 20.5% (2005-06) FDI - $7.8 billion (2005-6) 16.4 (2006-7) 25 (2007-8) Remittance  (Abroad)– highest in in world $17.2 billon (2002-03 to 24.6 billion (2005-06), 27 billion 2007-08
Investment Scenarios
Growth of Capital Formation
Sectoral Employment Shares   by Current Daily Status (CDS Basis)
Employment and Unemployment  in million person (by CDS basis)
Employment Growth
Social Sector Issues- Poverty
Growth of MPCEs  (monthly per-capita consumption expenditure)
Public Delivery of Social Services Failure of public delivery: health, water, education, social security Health care – 80% of outpatient & 55% of inpatient care provided by private sector –Absenteeism of govt. health workers- 40% Education– high absenteeism, dropout, poor quality,  highly govt. controlled higher education  Social Security-
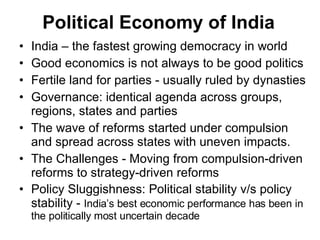
Political Economy of India India – the fastest growing democracy in world Good economics is not always to be good politics  Fertile land for parties - usually ruled by dynasties Governance: identical agenda across groups, regions, states and parties The wave of reforms started under compulsion and spread across states with uneven impacts. The Challenges - Moving from compulsion-driven reforms to strategy-driven reforms  Policy Sluggishness: Political stability v/s policy stability -  India’s best economic performance has been in the politically most uncertain decade
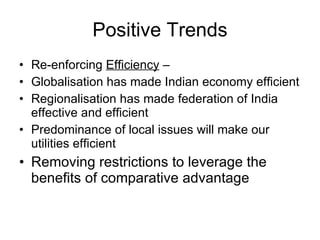
Positive Trends Re-enforcing  Efficiency  –  Globalisation has made Indian economy efficient Regionalisation has made federation of India effective and efficient Predominance of local issues will make our utilities efficient Removing restrictions to leverage the benefits of comparative advantage
Positive Trends Driving Forces: Market & Technology Economic openness, reduction and uniform tariff levels  Movement of capital & investment. Strategy of Go Global, Grow Global -  grow beyond national boundaries
Challenges Ahead GLOBALISING Indian Economy  REGIONALISING Indian Governance  LOCALISING Indian Society  Supply side challenges Effective Centre-State partnership Dismantling of unproductive and regressive state functionary Nationally Acceptable Common Minimum Programme (NACMP) for all

More Related Content

Ietp Session 2 June 28

  • 1. Indian Economic & Trade Policy Session-1 MBA (IB) – 2006-09
  • 2. Course Structure & Evaluation 1. Structure of Indian Economy 2. Policy & Execution 3. Sector-specific Issues & Development (Agriculture, Industry & Service) 4. Social Sector Development & Poverty 5. Overview of External Sector 6. Trade Policy 7. FDI – An Indian Perspective 8. Review of the Course
  • 3. Economic Planning Key Objectives – Growth, Equity & Social Justice Other objectives – Economic Growth Reduction of Inequality Employment Economic Self-Reliance Modernisation of various sectors Redressing regional imbalances How these objectives are related to business?
  • 4. GROWTH PERFORMANCE IN THE FIVE YEAR PLAN PERIOD 5.54 5.2 Sixth 5.35 6.5 Ninth 6.0 5.6 Eighth 6.02 5.0 Seventh 4.83 4.4 Fifth 2.05 5.7 Fourth 2.72 5.6 Third 4.21 4.5 Second 3.6 2.1 First Actual Target Plan
  • 5. Indian Economy – Policy & Challenges Post-Independence Focus on large scale industrialization Hindu growth rate Green Revolution (self-sufficiency in food) Anti-poverty development programme Policy shift from control to gradual decontrol Post-1990 Period Broad based reforms & SAP Demand driven growth supported by investment & private consumption Capital inflows & business environment Inclusive growth, sustainable business, CSR
  • 6. Performance of Indian Economy: Four Phases: I (1951-65), II (1965-81), III(1981-88), IV (1989-2006) Phase-I: 1951-65 (growth 4.1%) Coherent Dev. Strategy – institution building Relatively liberal policy: free import regime, liberal investment licensing, Open to direct foreign investment
  • 7. Performance of Indian Economy: Phase-II: 1965-81 (growth 3.2%) – darkest period Foreign exchange budgeting – tight imports and investments Major policy shift towards state control Nationalization of banks, oil companies, coal mines Restriction on foreign company operation Investment by large firms to core sectors Ceiling on urban land holding Labour laws – firms with more than 100 employees Growth rate declined 2.6% (1966-75) Many restrictions imposed during this period proved politically difficult to undo later
  • 8. Performance of Indian Economy: Phase-II: 1965-81 contd… Growth rate declined to 2.6 (1965-75) – it was clear that govt. strategy did not work. Strategy to easy up on state controls Administrative measures, capacity expansion, de-licensing select sectors, Import liberalization – open general licensing (1977) & further expansion Major depreciation of rupee to expand exports Expansionary fiscal policy & external borrowing
  • 9. Performance of Indian Economy: Phase-III: 1981-88 (growth 4.2%) Acceleration of liberalization and expansionary fiscal policy financed by external borrowing It improved growth up to 7.6% (1988-89) BoP crisis –Gulf war - jump in in Oil prices Growth declined to 1.2% (1991-92)
  • 10. Performance of Indian Economy: Phase-IV: 1989- 2006 Policy shift from piecemeal reform to more systematic reforms Dismantle licensing on machinery & raw material imports, lower industrial tariffs, open to foreign investment, Reform in direct & indirect taxes, financial sector Trimming of fiscal deficit Open select sector to private sector – telecom, civil aviation Growth rate up 7.1% (1993-97) Reforms became slow during 1996-1999 - political factor New initiatives in 1999 - Foreign & domestic competition, focus on infrastructure, import licensing on consumer goods, Reduction in tariffs, pvt of public sector, insurance sector, liberal interest rate, freed up several external capital A/c Urban land ceiling Act replaced, Huge highway construction Electricity Act 2003, Amendment of company Act 1956
  • 11. GDP Growth (at factor cost)
  • 12.  
  • 13. Sectoral Growth Performance (%) 6.3 7.8 6.8 6.5 3.4 1988-06 4.8 6.5 7.1 6.3 2.1 1981-88 3.2 4.3 3.9 4.0 2.1 1965-81 4.1 4.7 6.6 6.7 2.9 1951-65 Total GDP Service Manf. Industry Agrl & Allied Period
  • 14. Sectoral Growth – Recent Trend
  • 15. Sectoral Composition of GDP (%) 100 52 17 27 21 2004-05 100 41 16 26 33 1987-88 100 36 14 24 40 1980-81 100 31 12 21 49 1964-65 100 28 9 15 57 1950-51 Total GDP Service Manf. Industry Agrl & Allied Period
  • 16. Structural Transformation in India Agrarian rural economy to modern one – by passed industrial growth to service sector growth 90 % workforce in informal sector outside Agr. Slow industrial (Manf.) growth – loss of comp. advantage Stagnation/slow growth of unskilled labour-intensive sectors – apparel, textile, footwear, Organized sector growth limited to capital based (steel, auto) or service based (software, pharma) Trade sector – trade facilitation, high tariffs, export subsidy
  • 17. ECONOMIC CRISIS, GROWTH & REFORMS Macro Economic Crisis of 1990s – three aspects Fragile BoP situation Inflationary Pressure Fiscal Imbalance
  • 18. ECONOMIC REFORMS After 1990 I. Macro Economic Stabilisation Control of Inflation Fiscal Adjustment and Reforms Measure for BoP Improvement (Devaluation) II. Structural Reforms Trade and Capital Flow (External Sector Reforms) Industrial Deregulation Disinvestment Financial Sector Reforms
  • 19. Reforms for Growth Forex-Market Reforms (Full current A/c convertibility) Reforms in Foreign Investment Regime (Liberalising rules for FDI and allowing FII) Reforms in Infrastructure (PPP) Reforms in the form of EXIM policy (Tariff Rate reduction, QR removal, etc) Allowing Indian companies to invest abroad Challenges and Opportunities ( Threat to SSIs?) Joint Ventures with Foreign Companies in India and Abroad Compatibles with WTO Framework
  • 20. Emerging India– in Trade Perspective (Faster Integrating to World Economy) GDP Growth 13.8% (in real $ terms) 2003-07 Merchandise Export (in current $) 18.1 billion in (1991) doubled in 1999-00 & 102.7 billion in 2005-06 Service Exports increased from 26.9 billion in 2003-4 to 60.6 billion In 2005-06 Trade constitutes 43% of GDP: Export as % of GDP – 7.2% (1991), 11.6% (1999-00) 20.5% (2005-06) FDI - $7.8 billion (2005-6) 16.4 (2006-7) 25 (2007-8) Remittance (Abroad)– highest in in world $17.2 billon (2002-03 to 24.6 billion (2005-06), 27 billion 2007-08
  • 22. Growth of Capital Formation
  • 23. Sectoral Employment Shares by Current Daily Status (CDS Basis)
  • 24. Employment and Unemployment in million person (by CDS basis)
  • 27. Growth of MPCEs (monthly per-capita consumption expenditure)
  • 28. Public Delivery of Social Services Failure of public delivery: health, water, education, social security Health care – 80% of outpatient & 55% of inpatient care provided by private sector –Absenteeism of govt. health workers- 40% Education– high absenteeism, dropout, poor quality, highly govt. controlled higher education Social Security-
  • 29. Political Economy of India India – the fastest growing democracy in world Good economics is not always to be good politics Fertile land for parties - usually ruled by dynasties Governance: identical agenda across groups, regions, states and parties The wave of reforms started under compulsion and spread across states with uneven impacts. The Challenges - Moving from compulsion-driven reforms to strategy-driven reforms Policy Sluggishness: Political stability v/s policy stability - India’s best economic performance has been in the politically most uncertain decade
  • 30. Positive Trends Re-enforcing Efficiency – Globalisation has made Indian economy efficient Regionalisation has made federation of India effective and efficient Predominance of local issues will make our utilities efficient Removing restrictions to leverage the benefits of comparative advantage
  • 31. Positive Trends Driving Forces: Market & Technology Economic openness, reduction and uniform tariff levels Movement of capital & investment. Strategy of Go Global, Grow Global - grow beyond national boundaries
  • 32. Challenges Ahead GLOBALISING Indian Economy REGIONALISING Indian Governance LOCALISING Indian Society Supply side challenges Effective Centre-State partnership Dismantling of unproductive and regressive state functionary Nationally Acceptable Common Minimum Programme (NACMP) for all