Location via proxy:   [ UP ]  
[Report a bug]   [Manage cookies]                
SlideShare a Scribd company logo
Analysis of Markets and Household Specific      
                                                  Transaction Cost Factors in Livestock Input          
                                                              Markets in Ethiopia  
                                                                                                Berhanu Gebremedhin, Moti Jaleta, Samson Jemaneh and Aklilu Bogale 
                                                                                                                           
                                                             Improving Productivity and Market Success (IPMS) Project, International Livestock Research Institute (ILRI), P.O. Box 5689,                                                                                                                                                                                                        Bonn, 2011 
                                                                                                            Addis Ababa, Ethiopia 
                                                                                                                           
                                                                                                                                                                                                           FARMER PERCEPTIONS OF CHANCE OF CHEATING ON                                                                    FARMER PERCEPTIONS OF CHANCE OF CHEATING ON 
                                                                               Background                                                                                                                        QUALITY AND WEIGHTS OF INPUTS*                                                                                       QUALITY OF INPUTS*  
     •     Ethiopia has the largest livestock population in Africa. Yet, livestock productivity is among the lowest in 
                                                                                                                                                                                                                •Farmers see problem of cheating on weights 
           the region.  
                                                                                                                                                                                                                of inputs by traders.                                                                                           Farmers perceive higher danger of cheating on 
     •     Several factors contribute to the low productivity, including inefficient input and output markets,                                                                                                  •Farmers seem confident of the AI service pro‐                                                                  quality of input by traders irrespective of the 
           diseases and traditional management practices.                                                                                                                                                       vided by the OoA. Interestingly, participation in                                                               input type. 
     •     High transaction costs is a major contributor to inefficiency of livestock input markets in Ethiopia.                                                                                                AI service is, however,  very low.                                                                                Input type                Input source            Prob. Of cheating on
                                                                                                                                                                                                                                                                                                                                                                                    Quality (0=no,
                                                                                                                                                                                                                                                                                                                                                                                        1=yes)
     •     Hence, analysis of the determinants of feed market participation and transaction cost factors can                                                                                                 Input type         Input                 Prob. Of                Prob. Of cheating
                                                                                                                                                                                                                                source                cheating on             On weighing scale
           provide important insights to the development of strategies to improve the efficiency of livestock                                                                                                                                         Quality                 (0=no, 1=yes)                                                                                         Mean
                                                                                                                                                                                                                                                      (0=no, 1=yes)
           input markets.                                                                                                                                                                                                                                                                                                         Drug                      Trader (PIS)            0.47 (0.02)a
                                                                                                                                                                                                                                                      Mean                    Mean
                                                                                                                                                                                                                                                                    a                       a                                                               WoARD                   0.03 (0.01)b
                                                                                                                                                                                                             Feed               Farmer                0.07 (0.01)             0.05 (0.01)
                                                                                                                                                                                                                                                                    b                       b                                                               Cooperatives            0.15 (0.04)c
                                                                                                                                                                                                                                Trader                0.32 (0.02)             0.29 (0.02)
                                 Objectives                                                                                                Method                                                                               (PIS)                                                                                             Veterinary ser-
                                                                                                                                                                                                                                                                                                                                      vice
                                                                                                                                                                                                                                                                                                                                                            Farmer                  0.09 (0.03)a
                                                                                                                                                                                                                                WoARD                 0.05 (0.02)a            0.03 (0.01)a                                                                  Trader (PSP)            0.40 (0.04)b
                                                                                                                                                                                                                                Cooperatives          0.14 (0.05)a            0.06 (0.03)a
                •Characterize livestock input markets and                                                             •Results are based on data collected                                                                                                                                                                                                  WoARD                   0.02 (0.01)c
                                                                                                                                                                                                             AI Service         OoA                   0.02 (0.01)
                household input market participation.                                                                 from 1200 households in 10 districts in                                                                                                                                                                                               Cooperatives            0.10 (0.05)a
                                                                                                                      4 regions of Ethiopia in 2007.                                                                                                                                      * Different letters show statistical significance. 

                •Characterize the household specific 
                transaction cost factors in livestock input                                                           •Analysis of descriptive information                                                                      Marginal effects of Probit regression for determinants of household participation 
                markets.                                                                                              and econometric analysis are used.                                                                                               in roughages and oil cakes markets 
                                                                                                                                                                                                                                                                                                              Explanatory variables for roughage                                         Marg. Effect      Std. Err.

                •Analyze the determinants of household                                                                                                                                                                                                                                     Age of household head (year)                                                                   -0.00385**       0.00542

                feed market participation.                                                                                                                                                                                                                                                 Sex of household head (male=1, female=0)                                                        -0.10206*       0.14431


                                                                                                                                                                                                                                                                                           Education of household head (literate=1, illiterate=0)                                           -0.01004       0.13388

                                                                                                                                                                                                                                                                                           Operating land (ha)                                                                              -0.01599       0.03293
                                                                                                                                                                                                            • Older and male heads who live in ar‐
                                                                                                                                                                                                                                                                                           Household assets value (Birr)                                                                     0.00000       0.00000
                                                                                                                                                                                                            eas of relatively larger communal graz‐
                                                                                                                                                                                                                                                                                           Cattle & equine owned (TLU)                                                                       0.00290       0.01431
                                                                                                                                                                                                            ing lands, are less likely to participate 
                                                                                          Results                                                                                                           in roughage markets.                                                           Pasture land (ha)                                                                                -0.03262       0.13445

                                                                                                                                                                                                                                                                                           Area covered by communal grazing land per TLU                                                  -0.06998**       0.08007
                   HOUSEHOLD ACCESS TO INPUT MARKETS                                                   HOUSEHOLD PARTICIPATION IN LIVESTOCK INPUT MARKETS 
                                                                                                                                                                                                            • On the other hand, households who                                            Distance from settlement center to nearest market place (km)                                    -0.00820*       0.01348

                                           Market                  Input type            Proportion
                                                                                                                                                                                                            live closer to markets, and are en‐                                            Number of local organization involved                                                         -0.06258***       0.06356
•Highest market ac‐                                                                                                                                   Input type                     Proportion of
                                            type                                             of                                                                                      households who         gaged in market oriented livestock                                             Involvement in extension program (yes=1, no=0)                                                0.11563***        0.11141
cess is observed for                                                                       Farmers
                                                                                                        •Highest input market                                                        purchased the
                                                                                          reporting                                                                                  input (N=1192)         production and have contact with ex‐
roughages                                                                                 access (N=    participation is ob‐                                                                                                                                                               Access to credit (yes=1, no=0)                                                                   -0.02251       0.13067
(fodder/forage/straw),                                                                      1192)                                                                                                           tension are more likely to participate 
                                                                                                        served in veterinary                          Roughage                       0.30 (0.01)                                                                                           Engagement in dairy farm (yes=1, no=0)                                                        0.28771***        0.23308
salt‐bar, veterinary                                                                                                                                                                                        in roughage markets.  
                                        Feed Market Roughages                            0.86 (0.01)    service, drugs and                                                                                                                                                                 Engagement in fattening (yes=1, no=0)                                                         0.18022***        0.15049
                                                                                                                                                      Concentrate                    0.06 (.01)
service and drugs.                                          Concentrate                  0.19 (0.11)    slat‐bar. 
                                                                                                                                                      Oil seed cakes                 0.18 (0.01)                                                                                           Crop livestock farming system (yes=1, no=0)                                                   0.33737***        0.20284
•Interestingly,                                             Cakes from oil               0.48 (0.02)    •Modest market partici‐
                                                            refineries                                                                                                                                                                                                                     Perennial crop and livestock system (yes=1, no=0)                                             0.71277***        0.24471
reported access to AI                                                                                   pation is observed in                         Bran                           0.24 (0.01)
                                                            Bran                         0.57 (0.02)    roughage feed, oil seed 
is high.                                                                                                                                              Urea molasses block            0.03 (0.01)
                                                                                                                                                                                                                                                                                           Constant                                                                                      -1.48405***       0.38288
                                                            Urea Molasses Block          0.06 (0.01)    cakes and bran. 
•Access to oil seed                                                                                                                                   Salt – bar                     0.62 (0.01)
                                                                                                                                                                                                                                                                                           Number of observations                                                                                  699

cakes and bran is                                           Salt – bar                   0.89 (0.01)    •Lowest market partici‐
                                                                                                                                                      Veterinary service             0.79 (0.01)                                                                                           Wald Chi2 (16)                                                                                     149.64
modest.                                 Health              Veterinary service           0.98 (0.00)    pation is observed in 
                                        service                                                                                                                                                                                                                                            Prob > Chi2                                                                                        0.0000
                                                            Drugs                        0.99 (0.00)    concentrates, AI and                          Drugs                          0.82 (0.01)
•Access to concentrate                                                                                  UMB.                                                                                                                                                                               Pseudo R-squared                                                                                   0.1927
                                        Artificial   Artificial insemination 0.67 (0.02)                                                              Artificial insemination        0.09 (0.01)
and UMB is lowest.                      insemination for heifers/cows                                                                                 for heifers/cows
                                                                                                                                                                                                                                                                                          Note: ***, **, and * show significance at 1%, 5%, and 10% significance levels, respectively.


                                                                                                                                                                                                                         Explanatory variables for oil cakes                                    Marg. Effect            Std. Err.
                  SUPPLIERS OF LIVESTOCK INPUTS                                                                  SUPPLIERS OF LIVESTOCK INPUTS (2)
                                                                                                                                                                                                       Age of household head (year)                                                                    0.00163           0.00779
                                                                                                                                                                                                        
                                                                                                                                                                                                       Sex of household head (yes=1, no=0)                                                            -0.07288           0.23794
•Farmers are the                                                                                        •The Office of Agriculture (OoA) is the major sup‐                                             Education of household head (literate=1, illiterate=0)                                          0.06882           0.22196
most important                   Input type                  % of buyers by types of sellers            plier of veterinary services,  with some involve‐
sellers of rough‐                                                                                                                                                                                      Operating land (ha)                                                                            0.02250*           0.03282
                                                  Farmers Trad-          OoA     Coop-      Others
                                                                                                        ment of the private sector. 
age feed.                                                 ers                    era-
                                                                                                                                                                                                       Household assets value (Birr)                                                                   0.00000           0.00000
                                                                                 tives                  •The office of agriculture is almost the exclusive 
                                                                                                                                                                                                       Cattle & equine owned (TLU)                                                              0.02565***               0.02143
                                 Roughages 0.89                0.08      0       0          0.02        supplier of AI. 
                                           (0.02)              (0.01)                                                                                                                                  Pasture land (ha)                                                                               0.00665           0.07281
•Traders are the                                                                                        •Drugs are supplied by the office of agriculture and                                                                                                                                                                                   Households who operate larger size of 
                                 Concen-          0.01         0.87      0.03   0.02        0.05
                                                                                                                                                                                                       Area covered by communal grazing land per TLU                                              0.07710**              0.09453
most important                       trate        (0.01)       (0.04)    (0.02) (0.02)      (0.03)
                                                                                                        traders.                                                                                                                                                                                                                               crop land, who have more livestock,  
sellers of con‐                  Cakes from 0.01               0.95      0.02   0.01        0.01
                                                                                                                                                                                                       Distance from settlement center to nearest market place (km)                                    0.00141           0.01563               who live in areas with larger communal 
                                 oil refiner- (0.01)           (0.02)    (0.01) (0.01)
centrates, oil                         ies                                                               Input                                  % of buyers by type of seller                          Number of local organization involved                                                           0.04882           0.08571               grazing land, and are engaged in fatten‐
                                                                                                         type
cakes, bran, and                                                                                                                                                                                       Involvement in extension program (yes=1, no=0)                                           0.18743***               0.18707               ing business are more likely to partici‐
                                 Bran             0.01         0.97      0       0          0.01                        Farmers          Private        OoA         Cooperatives              Others
salt bar.                                         (0.01)       (0.01)                       (0.01)                                                                                                     Access to credit (yes=1, no=0)                                                                 -0.06132           0.17419               pate in oil cake markets.  
                                                                                                          Veterinary           0.02          0.08         0.89                0                   0
                                 Urea             0.09         0.41      0.15   0           0.35           service            (0.00)        (0.01)       (0.01)
                                                                                                                                                                                                       Engagement in dairy farm (yes=1, no=0)                                                          0.08135           0.26261
                                 molasses         (0.05)       (0.09)    (0.06)             (0.08)
•The office of                   block                                                                      Drugs              0.01          0.34         0.64                0                   0    Engagement in fattening (yes=1, no=0)                                                          0.15228*           0.21061
                                                                                                                              (0.00)        (0.01)       (0.01)
Agriculture                      Salt – bar       0.02         0.96      0.01   0           0                                                                                                          Crop livestock farming system (yes=1, no=0)                                                    -0.25899           0.62240
                                                  (0.00)       (0.01)    (0.00)
(OoA) is a minor                                                                                                                                                                                       Perennial crop and livestock system (yes=1, no=0)                                          -0.35745*              0.67877
                                                                                                            AI for             0.00          0.02         0.97               0.01                 0                                                                                                                
player in the                                                                                              heifers/           (0.01)        (0.01)       (0.02)             (0.01)                     Constant                                                                                       -0.94785           0.79410
                                                                                                            cows

                                                                                                                                                                                                       Number of observations                                                                             309

                MARKET PLACES FOR LIVESTOCK INPUTS                                                         MARKET PLACES FOR LIVESTOCK INPUTS (2)                                                      Wald Chi2 (16)                                                                                    60.25

                                                                                                                                                                                                       Prob > Chi2                                                                                      0.0000
    •Most important markets for roughages are farm 
    gates and local markets.                                                                             •Veterinary services are supplied at farm gates,                                              Pseudo R-squared                                                                                 0.1774
                                                                                                                                                                                                       Note: ***, **, and * show significance at 1%, 5%, and 10% significance levels, respectively.
    • Most important markets for concentrates, oil                                                       local and district markets.  
    cakes, bran, veterinary  service and drugs and slat‐                                                 •Drugs are supplied mostly at local and district 
    bar are local and district markets.                                                                  markets.                                                                                                                                                                         Implications
                                                                                                         •AI is supplied primarily at local and district mar‐
                                        Places of input purchase (% of buyers)                           kets, with some farmers receiving it at farm gate.                                                 •     An interesting result of this analysis is the fact that participation in input markets is very low despite the high 
                Input type
                                  Farm            Local         District       Regional                                                                                                                           reported access to the input markets, consistent with the low market orientation of the livestock sector.  
                                  gate            market        market         market
                                                                                                                  Input type              Places of input purchase (% of buyers)
         Roughages                 0.61             0.30            0.09             0
                                                                                                                                                                                                            •      Another interesting result is the fact that farmers seem concerned about the inputs and services they can buy 
                                                                                                                                       Farm          Local         District       Regional
                                  (0.02)           (0.02)          (0.01)
                                                                                                                                       gate          market        market         market                          from the private sector. 
         Concentrates              0.01             0.57            0.40          0.01
                                  (0.01)           (0.06)          (0.01)        (0.01)
                                                                                                                  Veterinary            0.20          0.47          0.33               0                    •     Two major implications emerge from the analyses: 
         Cakes from oil refin-       0              0.36            0.60          0.05                             service             (0.01)        (0.02)        (0.02)
         eries                                     (0.03)          (0.03)        (0.01)
                                                                                                                                                                                                                           1.Efforts should be strengthened to transform the subsistence nature of livestock production into market 
         Bran                      0.01             0.34            0.63          0.02                                Drugs             0.07          0.45          0.47              0.01
                                  (0.01)           (0.03           (0.03)        (0.01)                                                (0.01)        (0.02)        (0.02)            (0.00)                                orientation. 
         Urea molasses block       0.35             0.42            0.20          0.03
                                  (0.08)           (0.09)          (0.07)        (0.03)                             AI for              0.14          0.20          0.66               0                                   2.Appropriate incentives and regulatory mechanisms should be put in place to encourage the involve‐
                                                                                                                 heifers/cow           (0.03)        (0.04)        (0.05)
         Salt – bar                0.01
                                  (0.00)
                                                    0.41            0.54          0.04
                                                                                 (0.01)
                                                                                                                                                                                                                           ment of the private sector in livestock input supply and services. 
                                                   (0.02)          (0.02)

More Related Content

Analysis of markets and household specific transaction cost factors in livestock input markets in Ethiopia

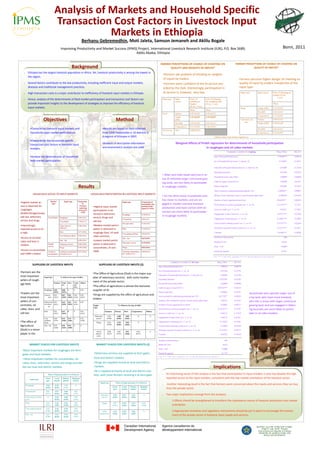
  • 1. Analysis of Markets and Household Specific       Transaction Cost Factors in Livestock Input           Markets in Ethiopia   Berhanu Gebremedhin, Moti Jaleta, Samson Jemaneh and Aklilu Bogale     Improving Productivity and Market Success (IPMS) Project, International Livestock Research Institute (ILRI), P.O. Box 5689,   Bonn, 2011  Addis Ababa, Ethiopia    FARMER PERCEPTIONS OF CHANCE OF CHEATING ON  FARMER PERCEPTIONS OF CHANCE OF CHEATING ON  Background QUALITY AND WEIGHTS OF INPUTS* QUALITY OF INPUTS*   • Ethiopia has the largest livestock population in Africa. Yet, livestock productivity is among the lowest in  •Farmers see problem of cheating on weights  the region.   of inputs by traders. Farmers perceive higher danger of cheating on  • Several factors contribute to the low productivity, including inefficient input and output markets,       •Farmers seem confident of the AI service pro‐ quality of input by traders irrespective of the  diseases and traditional management practices.   vided by the OoA. Interestingly, participation in  input type.  • High transaction costs is a major contributor to inefficiency of livestock input markets in Ethiopia.  AI service is, however,  very low.    Input type Input source Prob. Of cheating on Quality (0=no, 1=yes) • Hence, analysis of the determinants of feed market participation and transaction cost factors can     Input type Input Prob. Of Prob. Of cheating source cheating on On weighing scale provide important insights to the development of strategies to improve the efficiency of livestock       Quality (0=no, 1=yes) Mean (0=no, 1=yes) input markets.   Drug Trader (PIS) 0.47 (0.02)a Mean Mean a a WoARD 0.03 (0.01)b Feed Farmer 0.07 (0.01) 0.05 (0.01) b b Cooperatives 0.15 (0.04)c Trader 0.32 (0.02) 0.29 (0.02) Objectives Method (PIS) Veterinary ser- vice Farmer 0.09 (0.03)a WoARD 0.05 (0.02)a 0.03 (0.01)a Trader (PSP) 0.40 (0.04)b Cooperatives 0.14 (0.05)a 0.06 (0.03)a •Characterize livestock input markets and  •Results are based on data collected  WoARD 0.02 (0.01)c AI Service OoA 0.02 (0.01) household input market participation.  from 1200 households in 10 districts in  Cooperatives 0.10 (0.05)a 4 regions of Ethiopia in 2007.  * Different letters show statistical significance.  •Characterize the household specific  transaction cost factors in livestock input  •Analysis of descriptive information  Marginal effects of Probit regression for determinants of household participation  markets.   and econometric analysis are used. in roughages and oil cakes markets  Explanatory variables for roughage Marg. Effect Std. Err. •Analyze the determinants of household  Age of household head (year) -0.00385** 0.00542 feed market participation.  Sex of household head (male=1, female=0) -0.10206* 0.14431 Education of household head (literate=1, illiterate=0) -0.01004 0.13388 Operating land (ha) -0.01599 0.03293 • Older and male heads who live in ar‐ Household assets value (Birr) 0.00000 0.00000 eas of relatively larger communal graz‐ Cattle & equine owned (TLU) 0.00290 0.01431 ing lands, are less likely to participate  Results in roughage markets.  Pasture land (ha) -0.03262 0.13445   Area covered by communal grazing land per TLU -0.06998** 0.08007 HOUSEHOLD ACCESS TO INPUT MARKETS  HOUSEHOLD PARTICIPATION IN LIVESTOCK INPUT MARKETS  • On the other hand, households who  Distance from settlement center to nearest market place (km) -0.00820* 0.01348 Market Input type Proportion live closer to markets, and are en‐ Number of local organization involved -0.06258*** 0.06356 •Highest market ac‐ Input type Proportion of type of households who gaged in market oriented livestock  Involvement in extension program (yes=1, no=0) 0.11563*** 0.11141 cess is observed for  Farmers •Highest input market  purchased the reporting input (N=1192) production and have contact with ex‐ roughages  access (N= participation is ob‐ Access to credit (yes=1, no=0) -0.02251 0.13067 (fodder/forage/straw),  1192) tension are more likely to participate  served in veterinary  Roughage 0.30 (0.01) Engagement in dairy farm (yes=1, no=0) 0.28771*** 0.23308 salt‐bar, veterinary  in roughage markets.   Feed Market Roughages 0.86 (0.01) service, drugs and        Engagement in fattening (yes=1, no=0) 0.18022*** 0.15049 Concentrate 0.06 (.01) service and drugs.  Concentrate 0.19 (0.11) slat‐bar.  Oil seed cakes 0.18 (0.01) Crop livestock farming system (yes=1, no=0) 0.33737*** 0.20284 •Interestingly,             Cakes from oil 0.48 (0.02) •Modest market partici‐ refineries Perennial crop and livestock system (yes=1, no=0) 0.71277*** 0.24471 reported access to AI  pation is observed in  Bran 0.24 (0.01) Bran 0.57 (0.02) roughage feed, oil seed  is high.  Urea molasses block 0.03 (0.01) Constant -1.48405*** 0.38288 Urea Molasses Block 0.06 (0.01) cakes and bran.  •Access to oil seed  Salt – bar 0.62 (0.01) Number of observations 699 cakes and bran is  Salt – bar 0.89 (0.01) •Lowest market partici‐ Veterinary service 0.79 (0.01) Wald Chi2 (16) 149.64 modest.    Health Veterinary service 0.98 (0.00) pation is observed in  service Prob > Chi2 0.0000 Drugs 0.99 (0.00) concentrates, AI and  Drugs 0.82 (0.01) •Access to concentrate   UMB. Pseudo R-squared 0.1927 Artificial Artificial insemination 0.67 (0.02) Artificial insemination 0.09 (0.01) and UMB is lowest.   insemination for heifers/cows for heifers/cows Note: ***, **, and * show significance at 1%, 5%, and 10% significance levels, respectively. Explanatory variables for oil cakes Marg. Effect Std. Err. SUPPLIERS OF LIVESTOCK INPUTS  SUPPLIERS OF LIVESTOCK INPUTS (2) Age of household head (year) 0.00163 0.00779   Sex of household head (yes=1, no=0) -0.07288 0.23794 •Farmers are the  •The Office of Agriculture (OoA) is the major sup‐ Education of household head (literate=1, illiterate=0) 0.06882 0.22196 most important  Input type % of buyers by types of sellers plier of veterinary services,  with some involve‐ sellers of rough‐ Operating land (ha) 0.02250* 0.03282 Farmers Trad- OoA Coop- Others ment of the private sector.  age feed.  ers era- Household assets value (Birr) 0.00000 0.00000 tives •The office of agriculture is almost the exclusive    Cattle & equine owned (TLU) 0.02565*** 0.02143 Roughages 0.89 0.08 0 0 0.02 supplier of AI.  (0.02) (0.01) Pasture land (ha) 0.00665 0.07281 •Traders are the  •Drugs are supplied by the office of agriculture and  Households who operate larger size of  Concen- 0.01 0.87 0.03 0.02 0.05 Area covered by communal grazing land per TLU 0.07710** 0.09453 most important  trate (0.01) (0.04) (0.02) (0.02) (0.03) traders.   crop land, who have more livestock,   sellers of con‐ Cakes from 0.01 0.95 0.02 0.01 0.01 Distance from settlement center to nearest market place (km) 0.00141 0.01563 who live in areas with larger communal  oil refiner- (0.01) (0.02) (0.01) (0.01) centrates, oil  ies Input % of buyers by type of seller Number of local organization involved 0.04882 0.08571 grazing land, and are engaged in fatten‐ type cakes, bran, and  Involvement in extension program (yes=1, no=0) 0.18743*** 0.18707 ing business are more likely to partici‐ Bran 0.01 0.97 0 0 0.01 Farmers Private OoA Cooperatives Others salt bar.  (0.01) (0.01) (0.01) Access to credit (yes=1, no=0) -0.06132 0.17419 pate in oil cake markets.   Veterinary 0.02 0.08 0.89 0 0 Urea 0.09 0.41 0.15 0 0.35 service (0.00) (0.01) (0.01) Engagement in dairy farm (yes=1, no=0) 0.08135 0.26261 molasses (0.05) (0.09) (0.06) (0.08) •The office of  block Drugs 0.01 0.34 0.64 0 0 Engagement in fattening (yes=1, no=0) 0.15228* 0.21061 (0.00) (0.01) (0.01) Agriculture  Salt – bar 0.02 0.96 0.01 0 0 Crop livestock farming system (yes=1, no=0) -0.25899 0.62240 (0.00) (0.01) (0.00) (OoA) is a minor  Perennial crop and livestock system (yes=1, no=0) -0.35745* 0.67877 AI for 0.00 0.02 0.97 0.01 0     player in the  heifers/ (0.01) (0.01) (0.02) (0.01) Constant -0.94785 0.79410 cows Number of observations 309 MARKET PLACES FOR LIVESTOCK INPUTS   MARKET PLACES FOR LIVESTOCK INPUTS (2)   Wald Chi2 (16) 60.25 Prob > Chi2 0.0000 •Most important markets for roughages are farm  gates and local markets.  •Veterinary services are supplied at farm gates,   Pseudo R-squared 0.1774 Note: ***, **, and * show significance at 1%, 5%, and 10% significance levels, respectively. • Most important markets for concentrates, oil  local and district markets.   cakes, bran, veterinary  service and drugs and slat‐ •Drugs are supplied mostly at local and district  bar are local and district markets. markets.  Implications •AI is supplied primarily at local and district mar‐ Places of input purchase (% of buyers) kets, with some farmers receiving it at farm gate. • An interesting result of this analysis is the fact that participation in input markets is very low despite the high  Input type Farm Local District Regional reported access to the input markets, consistent with the low market orientation of the livestock sector.   gate market market market Input type Places of input purchase (% of buyers) Roughages 0.61 0.30 0.09 0 •  Another interesting result is the fact that farmers seem concerned about the inputs and services they can buy  Farm Local District Regional (0.02) (0.02) (0.01) gate market market market from the private sector.  Concentrates 0.01 0.57 0.40 0.01 (0.01) (0.06) (0.01) (0.01) Veterinary 0.20 0.47 0.33 0 • Two major implications emerge from the analyses:  Cakes from oil refin- 0 0.36 0.60 0.05 service (0.01) (0.02) (0.02) eries (0.03) (0.03) (0.01) 1.Efforts should be strengthened to transform the subsistence nature of livestock production into market  Bran 0.01 0.34 0.63 0.02 Drugs 0.07 0.45 0.47 0.01 (0.01) (0.03 (0.03) (0.01) (0.01) (0.02) (0.02) (0.00) orientation.  Urea molasses block 0.35 0.42 0.20 0.03 (0.08) (0.09) (0.07) (0.03) AI for 0.14 0.20 0.66 0 2.Appropriate incentives and regulatory mechanisms should be put in place to encourage the involve‐ heifers/cow (0.03) (0.04) (0.05) Salt – bar 0.01 (0.00) 0.41 0.54 0.04 (0.01) ment of the private sector in livestock input supply and services.  (0.02) (0.02)