Improve1_MyFinalPresentation
- 1. Internship at : Department of Chemical Engineering, Katsura Campus, Kyoto University (4th koza) Duration : Two months (2nd June to 28th July 2014) Presented by : Mr. Jirapat Pakchamsai (Jojo) From : Chulalongkorn University, Thailand. Influence of Au-addition on some physical properties of Fe-nanoparticles synthesized by gas-injected arc–in-water method
- 2. Introduction • Background • Carbon nanomaterials : Carbon nanotubes(CNTs) and Carbonbon nanohorns(CNHs) • CNH • Properties : • Has a unique structure which is different from CNT • Has high surface area • Has good chemical stability • Applications : (when combined with metal nanoparticles) • Catalysts support : Catalysts for decomposition of methane by stream to generate hydrogen • Gas sensor • Fuel cell • Energy storage • Drug delivery : Incorporate various molecules inside Single-Wall Nanohorns (SWNH) from various solutions • Magnetic Application : • Magnetic trap • Magnetic mobility • Limitation : • Large-scale preparation with high purification is not available
- 3. Introduction(2) • Synthesis Procedure : • Chemical method : • Reduction of ions in aqueous solutions : This method requires chemicals • Physical method : • Laser ablation : This method requires big instruments • Arc-Discharge : This method is applicable in small-scale experiment and low cost • Etc.
- 4. Introduction(3) • Motivations • In the past : • Arc-Discharge method can produce CNTs, CNHs, and Metal-CNHs (M-CNHs) • Nitrogen gas injection can increase the yield of CNHs Plum(2012) : Controlled Syntheses of Various Palladium Alloy Nanoparticles Dispersed in Single-Walled Carbon Nanohorns by One- Step formation Using an Arc Discharge Method : Study various alloy of Pd + Ag, Cu, Ni, Fe, W, Pt, Au, Mo, Nb, and Ti : Observe that if the boiling temperature is higher than arc temperature, there will be NO alloy : Particle size can be estimated by boiling temperature, melting temperature, surface tension, and atomic weight Au may reduce the particle size Hirama Yamada Ice : Effect of Fe/Fe2O3 loading on catalytic activity of sulfonated single-walled carbon nanohorn for esterification of palmitic acid : Study the effect of Fe Effect of Fe MY RESEARCH
- 5. Introduction(4) • Objectives • To study the effects of Au addition on some physical properties • Particle Size Distribution TEM • Composition of Product TEM, XRD, and EDX • Magnetic Properties AC magnetic susceptibility
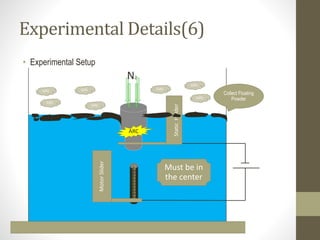
- 6. Experimental Details • Apparatus and Main Materials • Arc Machine • Nitrogen gas Supplier • Power Supply • Graphite Rods • Distilled Water • Metal Wires (Fe-wire and Au-wire) • Driller
- 7. Experimental Details(2) • Setup Conditions • Distilled Water : 3000mL • Graphite Rod (Anode) : Diameter(Ø) 6.15mm, Length(L) 76mm (with 2mm Ø hole) • Graphite Rod (Cathode) : Diameter(Ø) 20mm, Length(L) 55mm (with upper four 2mm Ø holes and lower 10mm Ø hole) • Power Supply : Discharge Current 100A • Velocity of Lower Electrode : 1.5mm/s • Distance of Lower Electrode Travel(Vertically) : 67mm • Time of Reaction : 30s • Nitrogen Gas Flow Rate : 10L/min • Voltage : 30volt 55mm 45mm
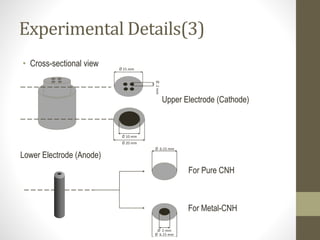
- 8. Experimental Details(3) • Cross-sectional view Upper Electrode (Cathode) Lower Electrode (Anode) Ø 15 mm Ø2mm Ø 20 mm Ø 10 mm For Pure CNH Ø 6.15 mm For Metal-CNH Ø 2 mm Ø 6.15 mm
- 9. Experimental Details(4) • Graphite Rods(Anode) Information • SET A (keep Fe/Au ratio constant + change total metal amount) • SET B (keep Fe supply amount constant + change Fe/Au ratio) Diameter(mm) Pitch Distance(mm) Weight Ratio of Fe/Au Number of Au-wire Remark Fe Au 0.3 0.3 1.5 1 1 Twisted together 0.5 0.3 2 1 1 Au in spiral 0.6 0.3 2.5 1 1 Au in spiral 0.8 0.3 3 1 1 Au in spiral Diameter(mm) Pitch Distance(mm) Weight Ratio of Fe/Au Number of Au-wire Remark Fe Au 0.8 0.3 4 2.906 1 Au in spiral 0.8 0.3 4 1.457 2 Au in spiral 0.8 0.3 4 0.58 5 Au in spiral A1 A2 B3 B4 A3 A4 B1
- 10. Finished Sample Au-wire Ø 0.3mm Experimental Details(5) • Samples Preparation Fe-wire Ø 0.8mm Ø 0.8mm 68mm 76mm Ø 2mm Graphite Rod (Anode) 8mm To hold wires
- 11. Experimental Details(6) • Experimental Setup MotorSlider StaticHolder N2 ARC GAS GAS GAS GAS GAS GAS GAS Collect Floating Powder Must be in the center
- 12. Experimental Details(7) Dry for 1 night Ready for further Analysis TEM XRD Magnetic property EDX
- 13. Results and Discussions • Particle Size Analysis • Analyzed by TEM (Transition Electron Microscope) Raw CNH 100nm Fe-CNH Examples of TEM images 50nm 20nm
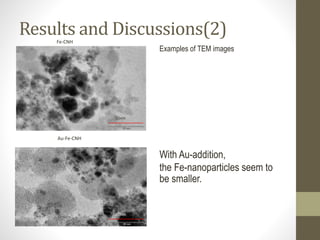
- 14. Results and Discussions(2)Fe-CNH 50nm Au-Fe-CNH 50nm Examples of TEM images With Au-addition, the Fe-nanoparticles seem to be smaller.
- 15. Results and Discussions(3) • Examples of TEM images and Histograms A1 : Au0.3Fe0.3 120k 50nm A4 : Au0.3Fe0.8 120k 50nm 0 10 20 30 40 50 60 70 0-2 4-6 8-10 12-14 16-18 20-22 0 10 20 30 40 50 60 70 NumberofParticles NumberofParticles Size of Particle(nm) Size of Particle(nm)
- 16. Results and Discussions(4) SETA (Fe:Au=1:1)0 10 20 30 40 50 60 70 80 90 0-2 2-4 4-6 6-8 8-10 10-12 12-14 14-16 16-18 18-20 20-22 0 10 20 30 40 50 60 70 80 90 0-2 2-4 4-6 6-8 8-10 10-12 12-14 14-16 16-18 18-20 20-22 0 10 20 30 40 50 60 70 80 90 0-2 2-4 4-6 6-8 8-10 10-12 12-14 14-16 16-18 18-20 20-22 0 10 20 30 40 50 60 70 80 90 Fe0.3 Fe0.8 Fe0.6 Fe0.5 5 6 7 8 9 10 11 12 0 0.1 0.2 0.3 0.4 0.5 0.6 0.7 0.8 0.9 Diameter of Fe-wire(mm) Averagesize(nm) The average particle size is larger when diameter of Fe-wire increases. Addition of Au makes the particle size smaller in most cases. With Au Without Au 7.4 8.7 8.6 9.3 5 6 7 8 9 10 11 12 0 0.1 0.2 0.3 0.4 0.5 0.6 0.7 0.8 0.9 Diameter of Fe-wire(mm) Averagesize(nm) With Au Without Au
- 17. SETB(Fe=0.8,Fe:Auvary) 5 6 7 8 9 10 11 12 13 14 20 30 40 50 60 70 Without Au With Au Averagesize(nm) Percent of Au in sample (wt%) Results and Discussions(5) 0 10 20 30 40 50 60 70 80 90 100 0-2 2-4 4-6 6-8 8-10 10-12 12-14 14-16 16-18 18-20 20-22 0 10 20 30 40 50 60 70 80 90 100 0-2 2-4 4-6 6-8 8-10 10-12 12-14 14-16 16-18 18-20 20-22 0 10 20 30 40 50 60 70 80 90 100 0-2 2-4 4-6 6-8 8-10 10-12 12-14 14-16 16-18 18-20 20-22 Fe : Au 2.91(wt%) Fe : Au 0.58(wt%) Fe : Au 1.46(wt%) Size of Particle(nm) Size of Particle(nm) Size of Particle(nm) NumberofParticlesNumberofParticlesNumberofParticles Without Au 5 6 7 8 9 10 11 12 13 14 20 30 40 50 60 70 With Au Percent of Au in sample (wt%)Averagesize(nm) There is a maximum point for particle size. This point is in the range of 35-45 percent of Au.
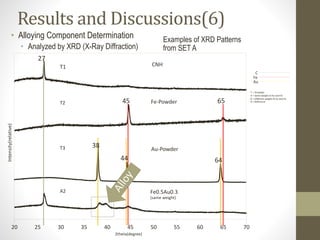
- 18. CNH Fe-Powder Au-Powder T1 T2 T3 20 25 30 35 40 45 50 55 60 65 70 Fe0.5Au0.3 (same weight) A2 27 45 65 38 44 64 C Fe Au T = Template A = Same weight of Au and Fe B = Different weight of Au and Fe R = Reference Intensity(relative) 2theta(degree) Results and Discussions(6) • Alloying Component Determination • Analyzed by XRD (X-Ray Diffraction) Examples of XRD Patterns from SET A
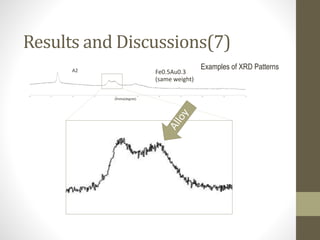
- 19. 20 25 30 35 40 45 50 55 60 65 70 Fe0.5Au0.3 (same weight) A2 Results and Discussions(7) 2theta(degree) Examples of XRD Patterns
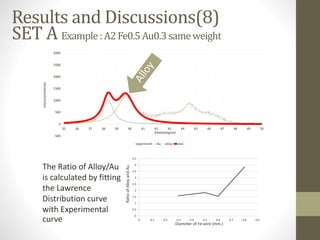
- 20. SET A Example:A2Fe0.5Au0.3sameweight -500 0 500 1000 1500 2000 2500 3000 35 36 37 38 39 40 41 42 43 44 45 46 47 48 49 50 experiment Au alloy total 0 0.5 1 1.5 2 2.5 3 3.5 4 4.5 0 0.1 0.2 0.3 0.4 0.5 0.6 0.7 0.8 0.9 RatioofAlloyandAu Diameter of Fe-wire (mm.) Results and Discussions(8) 2theta(degree) Intensity(relative) The Ratio of Alloy/Au is calculated by fitting the Lawrence Distribution curve with Experimental curve
- 21. • There are some consistent information between average particle size graph and Ratio of Alloy/Au graph Results and Discussions(9) 5 6 7 8 9 10 11 12 0 0.1 0.2 0.3 0.4 0.5 0.6 0.7 0.8 0.9 Diameter of Fe-wire(mm) Averagesize(nm) 0 0.5 1 1.5 2 2.5 3 3.5 4 4.5 0 0.1 0.2 0.3 0.4 0.5 0.6 0.7 0.8 0.9 RatioofAlloyandAu Diameter of Fe-wire (mm.) SET A
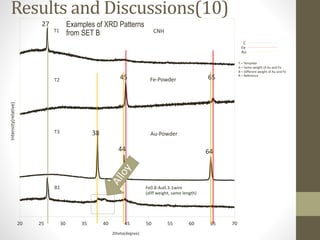
- 22. CNH Fe-Powder Au-Powder 20 25 30 35 40 45 50 55 60 65 70 Fe0.8-Au0.3-1wire (diff weight, same length) T1 T2 T3 B1 27 45 65 38 44 64 C Fe Au T = Template A = Same weight of Au and Fe B = Different weight of Au and Fe R = Reference Results and Discussions(10)Intensity(relative) 2theta(degree) Examples of XRD Patterns from SET B
- 23. 20 25 30 35 40 45 50 55 60 65 70 Fe0.8-Au0.3-1wire (diff weight, same length) B1 Results and Discussions(11) 2theta(degree) Examples of XRD Patterns
- 24. SET B Example:B1Fe0.8Au0.3-1wire(diffweight,samelength) -1000 -500 0 500 1000 1500 2000 2500 3000 3500 35 36 37 38 39 40 41 42 43 44 45 46 47 48 49 50 experiment Au alloy total 0 0.5 1 1.5 2 2.5 3 3.5 4 4.5 5 0 10 20 30 40 50 60 70 RatioofAlloyandAu Weight percent of Au Results and Discussions(12) 2theta(degree) Intensity(relative) The Ratio of Alloy/Au is calculated by fitting the Lawrence Distribution curve with Experimental curve
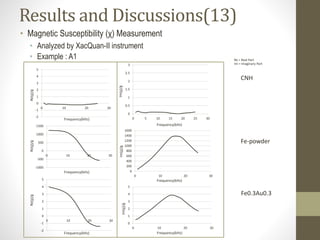
- 25. Results and Discussions(13) • Magnetic Susceptibility (χ) Measurement • Analyzed by XacQuan-II instrument • Example : A1 -2 -1 0 1 2 3 4 5 0 10 20 30 0 0.5 1 1.5 2 2.5 3 0 5 10 15 20 25 30 -1000 -500 0 500 1000 1500 0 10 20 30 0 200 400 600 800 1000 1200 1400 1600 0 10 20 30 -2 -1 0 1 2 3 4 5 0 10 20 30 0 1 2 3 4 5 0 10 20 30 CNH Fe0.3Au0.3 Fe-powder Re(χ)/gRe(χ)/gRe(χ)/g Frequency(kHz) Frequency(kHz) Frequency(kHz) Frequency(kHz) Frequency(kHz) Frequency(kHz) Im(χ)/gIm(χ)/g Im(χ)/g Re = Real Part Im = Imaginary Part
- 26. 0 0.5 1 1.5 2 2.5 3 3.5 4 4.5 5 0 10 20 30 40 50 60 70 RatioofAlloyandAu Percent of Au Results and Discussions(14) 0 5 10 15 20 25 30 0 10 20 30 40 50 60 70 SET A SET B Max(Re(χ)/g) 0 10 20 30 40 50 60 0 0.1 0.2 0.3 0.4 0.5 0.6 0.7 0.8 0.9 With Au Without Au Max(Re(χ)/g) Diameter of Fe-wire (mm) Percent of Au 0 0.5 1 1.5 2 2.5 3 3.5 4 4.5 0 0.1 0.2 0.3 0.4 0.5 0.6 0.7 0.8 0.9 RatioofAlloyandAu Diameter of Fe-wire (mm.) For SET A (keep Fe/Au in feed, change total metal), alloying with Au leads to the increase of magnetic susceptibility. In comparison with “without Au” case, magnetic susceptibility is increased by adding Au. Such a trend is against initial expectation. But for SET B (keep Fe in feed at high value, change Fe/Au ratio), alloying with Au leads to the decrease of magnetic susceptibility. This is initially expected. SET A and SET B are contradicted. It is noteworthy that the influence of Au on magnetic property can be reversed if Au is remarkably contained.
- 27. -5000 0 5000 10000 15000 20000 25000 30000 0 1 2 3 4 5 6 7 8 Energy(kV) Intensity(relative) x20 Au Fe C C Results and Discussions(15) • Composition Determination • Analyzed by EDX (Energy Dispersive X-ray spectroscopy) Example : A1 Fe0.3 Au0.3 same weight
- 28. Results and Discussions(16) 0 1 2 3 4 5 0 0.2 0.4 0.6 0.8 1 Enrichment factorofAu Diameter of Fe-wire (mm.) 0 5 10 15 20 25 30 35 0 0.2 0.4 0.6 0.8 1 Diameter of Fe-wire (mm.) Percentofmetalinclusion Enrichment factor = (Au wt%/Fe wt%) in product ÷ (Au wt%/Fe wt%) in sample SET A
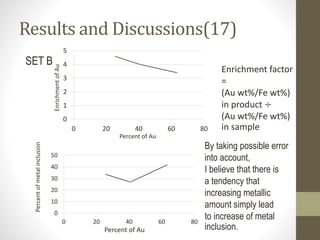
- 29. Results and Discussions(17) 0 1 2 3 4 5 0 20 40 60 80 EnrichmentofAu Percent of Au 0 10 20 30 40 50 0 20 40 60 80 Percentofmetalinclusion Percent of Au SET B By taking possible error into account, I believe that there is a tendency that increasing metallic amount simply lead to increase of metal inclusion. Enrichment factor = (Au wt%/Fe wt%) in product ÷ (Au wt%/Fe wt%) in sample
- 30. Conclusions SET A(keep Fe/Au ratio in fee, change total metal spply) SET B(keep Fe supply, change Fe/Au weight ratio) CNHs dispersed with Fe/Au alloy nanoparticles are produced by Gas-injected arc-in-water method with two variation sets. Focus: investigation on controllability of alloy particle size, Alloy/metal ratio, Fe/Au ratio, and magnetic susceptibility 1. Increase of metal supply leads to larger particle diameter. 2. Adding Au leads to reduce the Average Particle Size. 3. Increase metals in feed leads to increase alloy content. 4. Increase of metal content leads to reduced Au-enrichment. 5. Magnetic susceptibility is expected to be lower by alloying with Au. But large Au content may overshadow this trend. Main findings
- 31. VIDEO clip for Experimental Setup Credit : Tanemori San
Editor's Notes
- Driller to create hole
- < 44s
- Actually, the particle size should be smaller when adding Au.

