Location via proxy:   [ UP ]  
[Report a bug]   [Manage cookies]                
SlideShare a Scribd company logo
A GLOBAL VIEW OF MOBILE ADVERTISING:
              OCTOBER 2010 REPORT - INDIA MARKET
                             SECOND RELEASE:  INMOBI NETWORK DATA
                                         Release Date: 6 January, 2011


                                                The World’s Largest Independent
                                                            Mobile Ad Network

              To download the full report, visit us at www.InMobi.com/research 


                  www.inmobi.com             research@inmobi.com
NET WORK DATA

Network Data: Specifications and Representation

Specifications

Data in this report are sourced from our global mobile advertising network which served 24.1 billion impressions in October 2010.
With 102 countries receiving over 10 million impressions in October 2010, we are able to claim one of the broadest and most
representative networks in the world. Exact specifications are as follows:

•        Global Available Impressions in July 2010: 20.3 Billion
•        Global Available Impressions in October 2010: 24.1 Billion
•        Regions Represented: Africa, Asia Pacific, Europe, Middle East, North America, and South America
•        Countries Represented: 102 countries with over 10 million impressions in October 2010
•        Base Measure: Available Impressions
•        Reports: Market Summary, Manufacturer Share, OS Share, and Top Handsets & Connected Devices
•        Time Periods: October 2010 with change versus July 2010

Representation

InMobi is committed to an independent and transparent leadership position in mobile advertising. With that in mind, the following
issues are present in this data.

Mobile Advertising Market Definition: This report covers mobile display advertising only including both WAP and APP. SMS/Text
and Search are NOT included in this synopsis.

Scale and Time In Market: Representation within the network is a function of the both scale and time in market. Readers can
expect more fluctation and variance in younger, smaller markets for the company.

Publisher Mix: As with any ad network, market representation is a function of the publisher mix. We have over 5,000 publishers
of all sizes and content types, but changes to the publisher mix in a given market could impact the data.

Advertiser Mix: Similar to publisher mix, the advertiser mix could impact the numbers in our network, although to a much lesser
extent than publishers.


    www.inmobi.com                                                                       Source: InMobi Global Mobile Ad Network Statistics, October 2010
www.inmobi.com
INDIA

India OS Share: October 2010
                                                                                                                                           Regional      Global 
                                                                                    Operating System Available Impressions % Share Pt Chg Development  Development 
             Available Impressions                                                                                                           Index        Index
                                                                                       Nokia OS             
                                                                                                         2,221,208,125      38.1% +0.3        156          200
                                                                                      Symbian OS            
                                                                                                         1,552,571,804     26.6% +0.2         158          166
                                                                                         Android                
                                                                                                              12,245,888    0.2%    +0.2       12           4
                                                    Nokia OS                           iPhone OS                
                                                                                                              10,338,277    0.2%    +0.1       3            2
                                                                                   Windows Mobile OS           
                                                                                                              10,087,354    0.2%    -0.2       42           32
      34.7%                                         Symbian OS
                                    38.1%                                                Others            
                                                                                                         2,020,438,377     34.7%    -0.7      n/a          n/a
                                                    Android

                                                    iPhone OS

                                                    Windows Mobile OS
  .2%
 .2%                                                Others
    .2%            26.6%


OS shares stayed relatively consistent in the market over the past 90 days.  
Growth of Android and iPhone has yet to occur, as it does in other Asia markets.
  Nokia OS remains the top OS with 38.1% of impressions.

  iPhone OS and Android combine for 22.6 million monthly impressions, about 0.4% share.


      www.inmobi.com                                                                                               Source:  InMobi Global Mobile Ad Network Statistics, October 2010
INDIA

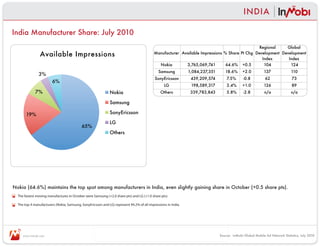
India Manufacturer Share: July 2010
                                                                                                                                              Regional      Global 
                Available Impressions                                                      Manufacturer Available Impressions % Share Pt Chg Development  Development 
                                                                                                                                                Index        Index
                                                                                             Nokia              
                                                                                                            3,765,069,741      64.6% +0.5        104          124
                                                                                              Samsung                 
                                                                                                                  1,084,237,351      18.6%      +2.0          137               110
               3%
                                                                                           SonyEricsson                 
                                                                                                                    439,209,574       7.5%       -0.8          62                73
                        6%
                                                                                                 LG                     
                                                                                                                    198,589,317       3.4%      +1.0          126                89
             7%                                               Nokia                            Others             339,783,843         5.8%       -2.8          n/a              n/a

                                                              Samsung

       19%                                                    SonyEricsson

                                                              LG
                                           65%
                                                              Others


Nokia (64.6%) maintains the top spot among manufacturers in India, even slightly gaining share in October (+0.5 share pts).
  The fastest moving manufactures in October were Samsung (+2.0 share pts) and LG (+1.0 share pts).

  The top 4 manufacturers (Nokia, Samsung, SonyEricsson and LG) represent 94.2% of all impressions in India.


     www.inmobi.com                                                                                                               Source:  InMobi Global Mobile Ad Network Statistics, July 2010
INDIA

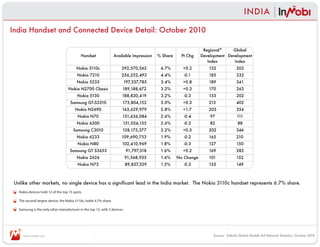
India Handset and Connected Device Detail: October 2010

                                                                                                                  Regional*     Global 
                                            Handset                Available Impression   % Share      Pt Chg    Development  Development 
                                                                                                                    Index        Index
                                         Nokia 3110c                         
                                                                        392,570,562        6.7%        +0.2          132             202
                                         Nokia 7210                          
                                                                        256,252,493        4.4%         -0.1         185             332
                                         Nokia 5233                           
                                                                         197,337,785       3.4%        +0.8          189             341
                                   Nokia N2700 Classic                        
                                                                         189,188,672       3.2%        +0.3          170             263
                                         Nokia 5130                          
                                                                        188,830,419        3.2%         -0.3         153             202
                                     Samsung GT-S3310                         
                                                                         173,804,152       3.0%        +0.3         213              402
                                        Nokia N2690                          
                                                                        163,629,979        2.8%        +1.7         203              356
                                          Nokia N70                          
                                                                         151,636,084       2.6%         -0.4         97              111
                                         Nokia 6300                           
                                                                         151,026,155       2.6%         -0.2         82               88
                                       Samsung C3010                          
                                                                         128,175,377       2.2%        +0.5         202              346
                                         Nokia 6233                          
                                                                        109,690,753        1.9%         -0.2        165              210
                                          Nokia N80                          
                                                                        102,410,969        1.8%         -0.3        127              150
                                    Samsung GT S3653                            
                                                                            91,797,318     1.6%        +0.2         169              282
                                         Nokia 2626                            
                                                                           91,568,935      1.6%      No Change      101              152
                                          Nokia N73                            
                                                                           89,837,329      1.5%         -0.3        135              149


 Unlike other markets, no single device has a significant lead in the India market.  The Nokia 3110c handset represents 6.7% share.
   Nokia devices hold 12 of the top 15 spots.

   The second largest device, the Nokia 3110c, holds 4.7% share.

   Samsung is the only other manufacturer in the top 15, with 3 devices.


     www.inmobi.com                                                                                                    Source:  InMobi Global Mobile Ad Network Statistics, October 2010
INDIA

India Market Summary:  October 2010 
                        Available Impression Volume & Composition                                                          Top 3 OS Systems:  % Share Available Impressions
                                                                  Regional      Global                                                                                 Regional    Global 
     Type                   July            October        % Chg Development  Development                                        July          October      Pt. Chg Development  Development 
                                                                    Index        Index                                                                                   Index      Index
     Total             4,780,660,996
                                         5,826,889,826
                                                           22%       n/a          n/a                    Nokia OS              37.8%            38.1%         +0.3        156        200
  Smartphone               715,797,059       721,542,695    1%        69           45                   Symbian OS             26.4%            26.6%         +0.2        158        166
   Advanced             
                       4,064,863,937       5,105,347,131   26%       107          120                     Android               0.0%             0.2%         +0.2         12         4

                  Top 4 Manufacturers:  % Share Available Impressions                                                        Top 10 Handsets: % Share Available Impressions
                                                                Regional     Global                                                                                    Regional     Global 
                         July            October      Pt. Chg Development  Development                                           July          October       Pt. Chg Development  Development 
                                                                  Index       Index                                                                                      Index       Index
    Nokia               64.1%            64.6%         +0.5        104         124                     Nokia 3110c              6.5%             6.7%         +0.2        132         202
   Samsung              16.6%            18.6%         +2.0        137         110                      Nokia 7210              4.5%             4.4%          -0.1       185         332
 SonyEricsson            8.3%             7.5%          -0.8        62          73                      Nokia 5233              2.6%             3.4%         +0.8        189         341
     LG                  2.4%             3.4%         +1.0        126          89                  Nokia N2700 Classic         2.9%             3.2%         +0.3        170         263
    Others               8.6%             5.8%          -2.8       n/a         n/a                      Nokia 5130              3.5%             3.2%          -0.3       153         202
                                                                                                     Samsung GT-S3310           2.7%             3.0%         +0.3        213         402
                                                                                                       Nokia N2690              1.1%             2.8%         +1.7        203         356
                                                                                                        Nokia N70               3.0%             2.6%          -0.4        97         111
                                                                                                        Nokia 6300              2.8%             2.6%          -0.2        82          88
                                                                                                      Samsung C3010             1.7%             2.2%         +0.5        202         346


Available impressions increased 22%, just over 1 billion impressions in the past 90 days.
  Nokia still commands the majority of impressions in India with nearly 2 out of every 3 impressions (64.6%).

  Android and iPhone OS have yet to gain signi cant ground in India. Device availability and pricing will hinder signi cant growth in the near term.

  OS shares stayed consistent in the region over the past 90 days, with advanced phones dominating the market.


      www.inmobi.com                                                                                                                 Source:  InMobi Global Mobile Ad Network Statistics, October 2010
NEXT STEPS


These data are the second of a series of network reports that are released quarterly.
Additional regions and markets will be released throughout the quarter.

Release Schedule
Network data will be released at least once per quarter with the potential to increase frequency. The next planned release is
January 2011 data around February 28th, 2011.

Open Source Research: Getting Involved
Objective industry analysts and thought-leaders are encouraged to comment, question, and participate. We will be sure to consider
and update the research based on feedback and questions to improve the quality for all end users.


To participate, contact us at Research@inMobi.com.

To download the full reports, visit us at www.InMobi.com/research


    www.inmobi.com                                                                        Source: InMobi Global Mobile Ad Network Statistics, October 2010
MEASURES AND TERM DEFINITIONS
InMobi Global Research: Measures and Term Definitions
Measures:
Available Impressions: The total number of ad requests made to the InMobi network. Note this is the base measure for all analysis in this report given its
representation of mobile advertising activity.
% Share (of Available Impressions): The % of total available impressions in the specified region allocated to the inventory type, device, manufacturer, or OS
under analysis.
Global Development Index: An index of the % share of the inventory type, device, manufacturer, or OS under analysis in the specified region or country
relative to that same inventory type, device, manufacturer, or OS share globally. (For example, iPhone OS Share in Europe is 22.9% while globally its
8.2%. Indexing 22.9% to 8.2% gives us our EU Global Development Index of 279.)
Regional Development Index: An index of the % share of the inventory type, device, manufacturer, or OS under analysis in the specified country relative to
that same inventory type, device, manufacturer, or OS share in the relevant region.
% Chg: The percentage change in absolute value between two different time periods.
Pt Chg: The difference between two share percentages for an inventory type, device, manufacturer, or OS under analysis in different time periods.


Definitions:
Smartphone: Any phone with an iPhone OS, Android OS, RIM OS, webOS, Windows Mobile OS, Linux Smartphone OS, Palm OS, Nokia N & E Series
Phones, or Samsung Bada.
Advanced: Any phone with an OS or handset NOT included in the smart phone definition above. Note that feature phones are not capable of receiving
mobile display ads and
WAP (Wireless Application Protocol): Any impression served using Wireless Application Protocol (WAP) which is an open international standard for
application-layer network communications in a wireless-communication environment.
App (Application): Any impressions served to a Mobile application resident on the consumer mobile device.
OS (Operating System): The system software (programs and data) running on the mobile devices that manages the hardware and provides common
services for execution of various application software receiving the impression.
Handsets and Connected Device: The make and model of the mobile device receiving the impression.
Manufacturer: The manufacturer of the mobile device receiving the impression.
Other: An aggregation of any remaining impressions not specifically detailed previously.

InMobi Regional Definitions:
InMobi defines all regions per Wikipedia with the following modifications:
“Asia Pacific” excludes China and Japan and includes all remaining Asian countries plus the 15 Oceania countries as listed in Wikipedia.

Contact Information:
Readers are encouraged to contact us and/or follow us on www.Twitter.com/InMobi, Facebook by searching “InMobi” and looking for our logo, or follow
our company blog at www.inMobi.com/blog. You can also hear from us directly by contacting us at Research@InMobi.com.


   www.inmobi.com                                                                                          Source: InMobi Global Mobile Ad Network Statistics, October 2010

More Related Content

India now the largest mobile advertising market in Asia Pacific

  • 1. A GLOBAL VIEW OF MOBILE ADVERTISING:               OCTOBER 2010 REPORT - INDIA MARKET SECOND RELEASE:  INMOBI NETWORK DATA  Release Date: 6 January, 2011 The World’s Largest Independent Mobile Ad Network To download the full report, visit us at www.InMobi.com/research  www.inmobi.com research@inmobi.com
  • 2. NET WORK DATA Network Data: Specifications and Representation Specifications Data in this report are sourced from our global mobile advertising network which served 24.1 billion impressions in October 2010. With 102 countries receiving over 10 million impressions in October 2010, we are able to claim one of the broadest and most representative networks in the world. Exact specifications are as follows: • Global Available Impressions in July 2010: 20.3 Billion • Global Available Impressions in October 2010: 24.1 Billion • Regions Represented: Africa, Asia Pacific, Europe, Middle East, North America, and South America • Countries Represented: 102 countries with over 10 million impressions in October 2010 • Base Measure: Available Impressions • Reports: Market Summary, Manufacturer Share, OS Share, and Top Handsets & Connected Devices • Time Periods: October 2010 with change versus July 2010 Representation InMobi is committed to an independent and transparent leadership position in mobile advertising. With that in mind, the following issues are present in this data. Mobile Advertising Market Definition: This report covers mobile display advertising only including both WAP and APP. SMS/Text and Search are NOT included in this synopsis. Scale and Time In Market: Representation within the network is a function of the both scale and time in market. Readers can expect more fluctation and variance in younger, smaller markets for the company. Publisher Mix: As with any ad network, market representation is a function of the publisher mix. We have over 5,000 publishers of all sizes and content types, but changes to the publisher mix in a given market could impact the data. Advertiser Mix: Similar to publisher mix, the advertiser mix could impact the numbers in our network, although to a much lesser extent than publishers. www.inmobi.com Source: InMobi Global Mobile Ad Network Statistics, October 2010
  • 4. INDIA India OS Share: October 2010 Regional  Global  Operating System Available Impressions % Share Pt Chg Development  Development  Available Impressions Index Index Nokia OS        2,221,208,125 38.1% +0.3 156 200 Symbian OS        1,552,571,804 26.6% +0.2 158 166 Android           12,245,888 0.2% +0.2 12 4 Nokia OS iPhone OS           10,338,277 0.2% +0.1 3 2 Windows Mobile OS            10,087,354 0.2% -0.2 42 32 34.7% Symbian OS 38.1% Others       2,020,438,377 34.7% -0.7 n/a n/a Android iPhone OS Windows Mobile OS .2% .2% Others .2% 26.6% OS shares stayed relatively consistent in the market over the past 90 days.   Growth of Android and iPhone has yet to occur, as it does in other Asia markets. Nokia OS remains the top OS with 38.1% of impressions. iPhone OS and Android combine for 22.6 million monthly impressions, about 0.4% share. www.inmobi.com Source:  InMobi Global Mobile Ad Network Statistics, October 2010
  • 5. INDIA India Manufacturer Share: July 2010 Regional  Global  Available Impressions Manufacturer Available Impressions % Share Pt Chg Development  Development  Index Index Nokia         3,765,069,741 64.6% +0.5 104 124 Samsung         1,084,237,351 18.6% +2.0 137 110 3% SonyEricsson           439,209,574 7.5% -0.8 62 73 6% LG           198,589,317 3.4% +1.0 126 89 7% Nokia Others 339,783,843 5.8% -2.8 n/a n/a Samsung 19% SonyEricsson LG 65% Others Nokia (64.6%) maintains the top spot among manufacturers in India, even slightly gaining share in October (+0.5 share pts). The fastest moving manufactures in October were Samsung (+2.0 share pts) and LG (+1.0 share pts). The top 4 manufacturers (Nokia, Samsung, SonyEricsson and LG) represent 94.2% of all impressions in India. www.inmobi.com Source:  InMobi Global Mobile Ad Network Statistics, July 2010
  • 6. INDIA India Handset and Connected Device Detail: October 2010 Regional*  Global  Handset Available Impression % Share  Pt Chg Development  Development  Index Index Nokia 3110c            392,570,562 6.7% +0.2 132 202 Nokia 7210            256,252,493 4.4% -0.1 185 332 Nokia 5233             197,337,785 3.4% +0.8 189 341 Nokia N2700 Classic            189,188,672 3.2% +0.3 170 263 Nokia 5130            188,830,419 3.2% -0.3 153 202 Samsung GT-S3310            173,804,152 3.0% +0.3 213 402 Nokia N2690            163,629,979 2.8% +1.7 203 356 Nokia N70            151,636,084 2.6% -0.4 97 111 Nokia 6300             151,026,155 2.6% -0.2 82 88 Samsung C3010            128,175,377 2.2% +0.5 202 346 Nokia 6233            109,690,753 1.9% -0.2 165 210 Nokia N80            102,410,969 1.8% -0.3 127 150 Samsung GT S3653              91,797,318 1.6% +0.2 169 282 Nokia 2626             91,568,935 1.6% No Change 101 152 Nokia N73              89,837,329 1.5% -0.3 135 149 Unlike other markets, no single device has a significant lead in the India market.  The Nokia 3110c handset represents 6.7% share. Nokia devices hold 12 of the top 15 spots. The second largest device, the Nokia 3110c, holds 4.7% share. Samsung is the only other manufacturer in the top 15, with 3 devices. www.inmobi.com Source:  InMobi Global Mobile Ad Network Statistics, October 2010
  • 7. INDIA India Market Summary:  October 2010  Available Impression Volume & Composition Top 3 OS Systems:  % Share Available Impressions Regional  Global  Regional  Global  Type July October % Chg Development  Development  July October Pt. Chg Development  Development  Index Index Index Index Total 4,780,660,996   5,826,889,826   22% n/a n/a Nokia OS 37.8% 38.1% +0.3 156 200 Smartphone     715,797,059    721,542,695 1% 69 45 Symbian OS 26.4% 26.6% +0.2 158 166 Advanced   4,064,863,937   5,105,347,131 26% 107 120 Android 0.0% 0.2% +0.2 12 4 Top 4 Manufacturers:  % Share Available Impressions Top 10 Handsets: % Share Available Impressions Regional  Global  Regional  Global  July October Pt. Chg Development  Development  July October Pt. Chg Development  Development  Index Index Index Index Nokia 64.1% 64.6% +0.5 104 124 Nokia 3110c 6.5% 6.7% +0.2 132 202 Samsung 16.6% 18.6% +2.0 137 110 Nokia 7210 4.5% 4.4% -0.1 185 332 SonyEricsson 8.3% 7.5% -0.8 62 73 Nokia 5233 2.6% 3.4% +0.8 189 341 LG 2.4% 3.4% +1.0 126 89 Nokia N2700 Classic 2.9% 3.2% +0.3 170 263 Others 8.6% 5.8% -2.8 n/a n/a Nokia 5130 3.5% 3.2% -0.3 153 202 Samsung GT-S3310 2.7% 3.0% +0.3 213 402 Nokia N2690 1.1% 2.8% +1.7 203 356 Nokia N70 3.0% 2.6% -0.4 97 111 Nokia 6300 2.8% 2.6% -0.2 82 88 Samsung C3010 1.7% 2.2% +0.5 202 346 Available impressions increased 22%, just over 1 billion impressions in the past 90 days. Nokia still commands the majority of impressions in India with nearly 2 out of every 3 impressions (64.6%). Android and iPhone OS have yet to gain signi cant ground in India. Device availability and pricing will hinder signi cant growth in the near term. OS shares stayed consistent in the region over the past 90 days, with advanced phones dominating the market. www.inmobi.com Source:  InMobi Global Mobile Ad Network Statistics, October 2010
  • 8. NEXT STEPS These data are the second of a series of network reports that are released quarterly. Additional regions and markets will be released throughout the quarter. Release Schedule Network data will be released at least once per quarter with the potential to increase frequency. The next planned release is January 2011 data around February 28th, 2011. Open Source Research: Getting Involved Objective industry analysts and thought-leaders are encouraged to comment, question, and participate. We will be sure to consider and update the research based on feedback and questions to improve the quality for all end users. To participate, contact us at Research@inMobi.com. To download the full reports, visit us at www.InMobi.com/research www.inmobi.com Source: InMobi Global Mobile Ad Network Statistics, October 2010
  • 9. MEASURES AND TERM DEFINITIONS InMobi Global Research: Measures and Term Definitions Measures: Available Impressions: The total number of ad requests made to the InMobi network. Note this is the base measure for all analysis in this report given its representation of mobile advertising activity. % Share (of Available Impressions): The % of total available impressions in the specified region allocated to the inventory type, device, manufacturer, or OS under analysis. Global Development Index: An index of the % share of the inventory type, device, manufacturer, or OS under analysis in the specified region or country relative to that same inventory type, device, manufacturer, or OS share globally. (For example, iPhone OS Share in Europe is 22.9% while globally its 8.2%. Indexing 22.9% to 8.2% gives us our EU Global Development Index of 279.) Regional Development Index: An index of the % share of the inventory type, device, manufacturer, or OS under analysis in the specified country relative to that same inventory type, device, manufacturer, or OS share in the relevant region. % Chg: The percentage change in absolute value between two different time periods. Pt Chg: The difference between two share percentages for an inventory type, device, manufacturer, or OS under analysis in different time periods. Definitions: Smartphone: Any phone with an iPhone OS, Android OS, RIM OS, webOS, Windows Mobile OS, Linux Smartphone OS, Palm OS, Nokia N & E Series Phones, or Samsung Bada. Advanced: Any phone with an OS or handset NOT included in the smart phone definition above. Note that feature phones are not capable of receiving mobile display ads and WAP (Wireless Application Protocol): Any impression served using Wireless Application Protocol (WAP) which is an open international standard for application-layer network communications in a wireless-communication environment. App (Application): Any impressions served to a Mobile application resident on the consumer mobile device. OS (Operating System): The system software (programs and data) running on the mobile devices that manages the hardware and provides common services for execution of various application software receiving the impression. Handsets and Connected Device: The make and model of the mobile device receiving the impression. Manufacturer: The manufacturer of the mobile device receiving the impression. Other: An aggregation of any remaining impressions not specifically detailed previously. InMobi Regional Definitions: InMobi defines all regions per Wikipedia with the following modifications: “Asia Pacific” excludes China and Japan and includes all remaining Asian countries plus the 15 Oceania countries as listed in Wikipedia. Contact Information: Readers are encouraged to contact us and/or follow us on www.Twitter.com/InMobi, Facebook by searching “InMobi” and looking for our logo, or follow our company blog at www.inMobi.com/blog. You can also hear from us directly by contacting us at Research@InMobi.com. www.inmobi.com Source: InMobi Global Mobile Ad Network Statistics, October 2010