Increasing profitability through marketing.

This document discusses how companies can increase profitability through marketing and improving service quality. It argues that service quality leads to both offensive and defensive marketing benefits. Offensive marketing benefits include gaining market share, a positive reputation, and the ability to charge higher prices through attracting new customers. Defensive marketing benefits come from retaining existing customers, such as lower costs from customer loyalty, increased purchase volume, and price premiums. The document advocates measuring key drivers of service quality and using balanced scorecards to track financial, customer, operational, and innovation metrics. Overall, it presents the perspective that higher service quality drives greater customer retention and acquisition, leading to increased profits.


Increasing profitability through marketing.
- 2. Introduction • Often the difference between solid business growth and no growth is the type of sales operations and strategies that are implemented. • Companies that succeed are able to perpetually increase profitability without compromising the quality of products or services. Those that fail tend to lack the insight it takes to keep up with competitors.
- 3. The Direct Relationship between Service and Profits Profits ?Service Quality
- 4. Evidence of relationship between quality and profits • Lower costs due to efficiencies achieved • Increased sales from current customers • Greater attraction of new customers • Possible ability to charge higher prices
- 5. Offensive Marketing Through offensive marketing, service quality can help firms to attract more and better customers. Offensive effects include, Market share Reputation Price premium When service is good, companies are able to gain a positive reputation, and through this a higher market share and ability to change more than its competitors.
- 6. Offensive Marketing Effects of Service on Profits Profits Market Share Reputation Sales Price Premium Service Quality
- 7. Defensive Marketing • When a firm uses defensive marketing, the approach aims to keep the customers a frim already has. • The four defensive marketing effects of service on profit: • Lower costs • Volume of purchases • Price premium
- 8. Why Improved Retention (Defensive Marketing) Increases Profits • It’s about 5 times more expensive to win a new customer than to keep an old one. • Longer-term customers tend to purchase more. • Familiar customers may be more efficient to deal with.
- 9. Secondary issues • Satisfied customers more pleasant to work with --- employee turnover • makes a firm a more difficult competitor • if firm redresses complaints customers are almost as willing to return and sometimes more loyal than those who never had a problem
- 10. Defensive Marketing Effects of Service on Profit Margins Profits Customer Retention Costs Price Premium Word of Mouth Volume of PurchasesService Quality
- 11. Service Quality Spells Profits Service Quality Customer Retention Costs Price Premium Word of Mouth Margins Profits Defensive Marketing Volume of Purchases Market Share Reputation Sales Price Premium Offensive Marketing
- 12. Three Issues Emerge--- • All customers treated the same? • What aspects of services should focus on? • Measurement issues?
- 13. Assumptions of 80/20 Rule • 20 percent of a company’s customers produce 80 percent of the company’s profit • assumes all customers within each tier is homogeneous
- 14. Figure 17-6 The “80/20” Customer Pyramid Most Profitable Customers Least Profitable Customers What segment spends more with us over time, costs less to maintain, spreads positive word of mouth? What segment costs us in time, effort and money yet does not provide the return we want? What segment is difficult to do business with? Other Customers Best Customers
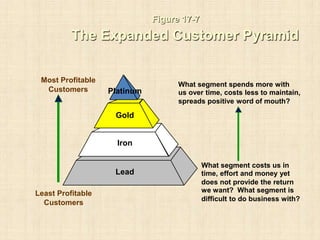
- 15. Figure 17-7 The Expanded Customer Pyramid Most Profitable Customers Least Profitable Customers What segment spends more with us over time, costs less to maintain, spreads positive word of mouth? What segment costs us in time, effort and money yet does not provide the return we want? What segment is difficult to do business with? Gold Iron Lead Platinum
- 16. The key drivers of service quality, customer retention and profits • It can be extremely useful to managers to identify the specific drivers of service quality that relate to profitability. • Once these drivers have been identified, firms can better understand what aspects of service quality will be most influential to the relationship, and therefore where resources should be invested.
- 17. The Key Drivers of Service Quality, Customer Retention, and Profits Key Drivers Service Quality Service Encounter Service Encounter Service Encounter Customer Retention Behavioral Intentions Profits Service Encounter Service Encounters
- 18. Company Performance Measurement • Balanced performance scorecards- strategic measurement systems that capture areas of performance other than traditional indicators such as profit and sales. • In addition to the financial perspective, the balanced performance scorecard also captures the customer, operational and learning perspectives.
- 19. The Balanced Scorecard • Financial Measures – One way that service managers are changing financial measurement is by measuring the effect of retaining and losing customers. – The monetary value of retaining customers can be identified as well as lost revenue from customer defections. • Customer Perceptual Measures – It can be leading measures of financial performance – Perceptual measures reflect customer beleifs and feelings toward the company and its services and are a predictor of how the customer will behave in future.
- 20. • Operational Measures – lit involve the translation of customer perceptual measures into the standards that must be set within the company in order to meet customer expectations. • Innovation and Learning Measures – This area of measurement involves a company’s ability to innovate, improve, and learn
- 21. Thank You