Location via proxy:   [ UP ]  
[Report a bug]   [Manage cookies]                
SlideShare a Scribd company logo

1

©  comScore,  Inc.  Proprietary.
#InteractIAB
MEASURING
FOR  THE  FUTURE
How  to  Apply  Lessons  Learned  in  Media  Measurement  to  
Advance  the  Digital  Industry  
Dr.  Gian  Fulgoni
CEO  &  Co-­Founder
comScore,  Inc.
23  May  2017
For  info  about  the  proprietary  technology  used  in  comScore  products,  refer  to  http://comscore.com/Patents

2

©  comScore,  Inc.  Proprietary. 2

3

©  comScore,  Inc.  Proprietary. 3
Digital  is  the  most  measurable  
medium  in  the  world
...but  it’s  far  from  perfect

4

©  comScore,  Inc.  Proprietary. 44©  comScore,  Inc.  Proprietary.
Clicks on  ads  are  at  best  an  incomplete –
and  at  worst  a  misleading – effectiveness  metric.
Measure  attitudinal  and  behavioral  lifts  instead.

5

©  comScore,  Inc.  Proprietary. 5
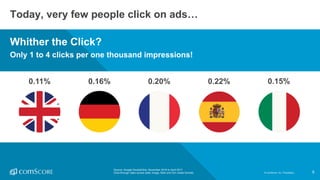
Whither  the  Click?
Only  1  to  4  clicks  per  one  thousand  impressions!
Today,  very  few  people  click  on  ads…
Source:  Google  DoubleClick,  November  2016  to  April  2017  
Click-­through  rates  across  static  image,  flash  and  rich  media  formats
0.11% 0.16% 0.20% 0.22% 0.15%
5©  comScore,  Inc.  Proprietary.

6

©  comScore,  Inc.  Proprietary. 6
…and  research  says  clicks  don’t  predict  sales  impact  
6©  comScore,  Inc.  Proprietary.
A  negative  pattern  exists  between  Sales  Lift  
per  Household  and  Click  Through  Rate  (i.e.,  
as  CTR  increases,  sales  decrease)
R2  =  -­0.039
A  regression  analysis  shows   there  is  no  
statistically  significant  relationship  between  
CTR  and  Sales
$-­
$0.100  
$0.200  
$0.300  
$0.400  
$0.500  
$0.600  
0.00% 0.20% 0.40% 0.60% 0.80%
Sales  Lift/HH  in  $  
CTR  
Sales  Lift/HH  in  $
Click-­through  Rate

7

©  comScore,  Inc.  Proprietary. 77©  comScore,  Inc.  Proprietary.
Self-­reported  online  survey  data  that  requires  
consumer  recall  is  misleading  for  cross-­channel  and  
cross-­platform  measurement.

8

©  comScore,  Inc.  Proprietary. 8
Source:  comScore  behavioral  research,  via  passive  observation  
Major  source  of  the  problem:  online  survey  panelists  are  
heavier-­than-­average  Internet  users  by  a  factor  of  2  to  3
0
50
100
150
200
250
300
350
Time  spent  online Pages  
downloaded
Searches  
conducted
Dollars  spent  
online
Made  online  credit  
card  application
Paid  bills  online
Average  User Survey  Panelist
AVERAGE  USER
Index

9

©  comScore,  Inc.  Proprietary. 9
5.0
3.7
Online  Survey Behavioral
4.3
5.4
Online  Survey Behavioral
35%  Overstatement
Hours  Per  Day  Online
20%  Understatement
Hours  Per  Day  Watching  TV
The  reality  is  that  online  surveys  overstate  time  spent  online  
by  35%  – and  understate  TV  time  by  20%

10

©  comScore,  Inc.  Proprietary. 10
*  NRF  Survey  
Online  surveys  dramatically  overstate  e-­commerce  spend.
E-­commerce  as  %  of  
Discretionary  Consumer  Spending
E-­commerce  as  %  of  
Discretionary  Consumer  Spending
U.S.  DEPARTMENT  OF  COMMERCE
ONLINE  SURVEY*
42%
14%
** Excludes autos, gas and food / bev

11

©  comScore,  Inc.  Proprietary. 1111©  comScore,  Inc.  Proprietary.
The  accuracy  of  cookie-­based  targeting  leaves  
a  lot  to  be  desired…

12

©  comScore,  Inc.  Proprietary. 12
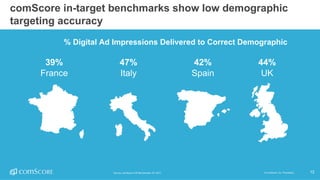
comScore  in-­target  benchmarks  show  low  demographic  
targeting  accuracy
12©  comScore,  Inc.  Proprietary.
39%
France
47%
Italy
42%
Spain
44%
UK
Source:  comScore  vCE Benchmarks,  Q1  2017.  
%  Digital  Ad  Impressions  Delivered  to  Correct  Demographic  

13

©  comScore,  Inc.  Proprietary. 13
In-­target  accuracy:  why  100%  requires  audience  guarantees  
and  make-­goods  
13©  comScore,  Inc.  Proprietary.
Some  targeting  infers  
demography  based  on  
content  consumption
Nearly  50%  of  
computers  are  
shared,  so  cookies  
don’t  know  who  is  
using  the  computer  at  
any  given  point  in  
time
Not  all  registration  
data  are  accurate
Demographic  data  
become  outdated

14

©  comScore,  Inc.  Proprietary. 14
Industry  benchmarks  can  help  media  
buyers  and  sellers  set  campaign  delivery  
expectations.  
14©  comScore,  Inc.  Proprietary.
Measurement  of  Viewability,  Brand  Safety  
and  Non-­Human  Traffic  provides  much-­needed  transparency in  an  
increasingly  opaque,  programmatic  world.
“Keeping  that  digital  ad  in  view  makes  a  real  impression”

15

©  comScore,  Inc.  Proprietary. 15
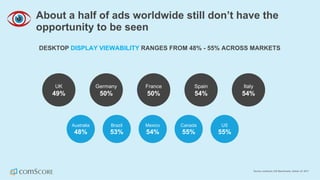
About  a  half  of  ads  worldwide  still  don’t  have  the  
opportunity  to  be  seen
DESKTOP  DISPLAY  VIEWABILITY  RANGES  FROM  48%  -­ 55%  ACROSS  MARKETS
Source:  comScore  vCE  Benchmarks,  Global,  Q1  2017
Australia
48%
UK
49%
Germany
50%
France
50%
Brazil
53%
Spain
54%
Italy
54%
Mexico
54%
Canada
55%
US
55%

16

©  comScore,  Inc.  Proprietary. 16Source:  comScore  vCE  Benchmarks,  US,  Q1  2017
Direct  buys  see  higher  viewability  than  programmatic
DESKTOP  DISPLAY DESKTOP  VIDEO
DIRECT
PROGRAMMATIC
DIRECT
PROGRAMMATIC
60%
54%
73%
51%
Q1  
2017

17

©  comScore,  Inc.  Proprietary. 17Source:  comScore  vCE  Benchmarks,  US,  Q1  2017
High-­price  video  ads  attract  the  most  IVT
6%  IVT
DESKTOP  DISPLAY
10%  IVT
DESKTOP  VIDEO
Q1  
2017

18

©  comScore,  Inc.  Proprietary. 18Source:  comScore  vCE  Benchmarks,  US,  Q1  2017
Programmatic  magnifies  the  IVT  problem
DESKTOP  DISPLAY DESKTOP  VIDEO
6%
4% DIRECT
PROGRAMMATIC
10%
4% DIRECT
PROGRAMMATIC
Q1  
2017

19

©  comScore,  Inc.  Proprietary. 19
Digital  media  and  measurement  
needs  to  continue  to  evolve

20

©  comScore,  Inc.  Proprietary. 20
The  industry  is  calling  for  more  focus  on  IMPACT
“Viewability  means  opportunity  to  see  [but  it  has]  been  
confused  with  fully  viewed,  was  recalled,  was  
effective,  made  an  impact,  paid  attention,  delivered  
ROI.”  
– Marc  Pritchard,  Chief  Brand  Officer,  P&G  
“Not  every  marketer  is  obsessed  with how  much  time  
consumers  spend with  their  digital  ads  or how  many  
pixels  they  see….They  just  want  their  ads  to  work.”
“Although  viewability  standards  can  increase  the  overall  
quality  of  online  ads,  viewability  by  itself  is  not  an  
adequate  measurement  of  ad  quality.”
“It  seems  like  a  total  no-­brainer:  No  one  wants  to  pay  for  
ads  that  can’t  be  seen.  But  viewability  is  just  one  
factor  in  an  effective  campaign…viewability  is  a  
useful  metric  but  doesn’t  add  up  as  a  be-­all  end-­all  
goal  for  marketers.”

21

©  comScore,  Inc.  Proprietary. 21
As  an  industry,  we  must  bring  focus  back  to  the  advertising  
metrics  that  matter  – and  that  means  accepting  viewability  
as  a  necessary  but  not  sufficient – and  increasing  our  
attention  on  Unduplicated  R/F,  GRPs  and  Lift  in  Attitudes  and  
Sales
It’s  clear:  Viewability  alone  is  not  enough.

22

©  comScore,  Inc.  Proprietary. 22
Measuring  for  the  future  in  a  cross-­platform  world
• Measurement  of  unduplicated  audiences  across  
platforms  at  a  granular  level

23

©  comScore,  Inc.  Proprietary. 23Source:  comScore  Xmedia,  February  2015
Cross-­platform  deduplication  in  action:  Millennials  exhibited  much  greater  Time  
Shifted  Viewing  (TSV)  and  Digital  consumption  for  a  Network  TV  Series  Finale
All  Persons P18-­34
Digital  Only
Live  +  7
Live  +  SD
Live
+21%
+3%
+24%
+35%
+8%
+43%
Incremental  Audience  from  TSV  and  Digital

24

©  comScore,  Inc.  Proprietary. 24
“We  have  to  get  better  at  cross-­platform  
measurement.  Better  at  de-­duplication.  We  need  to  
understand  how  much  reach  we  obtain  on  a  
campaign  across  devices.
With  the  availability  of  cross-­platform  data  that  
allows  improved  media  planning,  I  believe  ad  
spending  will  increase  across  all  platforms,  including  
television.”
Irwin  Gottlieb,  Global  Chairman,  GroupM

25

©  comScore,  Inc.  Proprietary. 25
Measuring  for  the  future  in  a  cross-­platform  world
• Measurement  of  unduplicated  audiences  across  platforms  at  
a  granular  level  
• Effective  frequency  capping  across  platforms

26

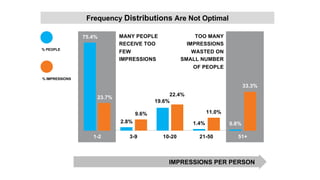
1-­2 3-­9 10-­20 21-­50 51+
0.8%
33.3%
1.4%
11.0%
19.6%
22.4%
75.4%
23.7%
2.8%
9.6%
%  PEOPLE
%  IMPRESSIONS
MANY  PEOPLE  
RECEIVE  TOO  
FEW  
IMPRESSIONS
TOO  MANY  
IMPRESSIONS  
WASTED  ON  
SMALL  NUMBER  
OF  PEOPLE
Frequency  Distributions Are  Not  Optimal
IMPRESSIONS  PER  PERSON

27

50  EXPOSURES15-­20  EXPOSURES
POINT  LIFT  (BRAND)
Contribution  of  Incremental  Exposures  Declines  Quickly  After  20  Exposures
IMPRESSIONS  PER  PERSON
INCREASING  
EFFECTIVENESS
MINIMAL
EFFECTIVENESS
DECLINING  
EFFECTIVENESS

28

Implications  for  Excessive  Frequency
v Frequency  caps  from  20  to  50  are  appropriate  for  most  brands
v Exposures above  those  thresholds  are,  at  best, wasted
v The  marginal  contribution  of  an  incremental  exposure  declines quickly
and loses  over  90%  of  its  effectiveness  even earlier
v The  thresholds  for  wasteful  or  harmful  effects  are  likely  to  be  lower for
interruptive  advertising  such  as  online  video  ads  or  pop-­up ads

29

©  comScore,  Inc.  Proprietary. 29
Measuring  for  the  future  in  a  cross-­platform  world
• Measurement  of  unduplicated  audiences  across  platforms  
• Effective  frequency  capping  across  platforms
• Aligned  metrics  between  TV  and  Digital  Video
• -­ Average  minute  TV  audience  vs.  number  of  digital  video  views  

30

©  comScore,  Inc.  Proprietary. 30
Measuring  for  the  future  in  a  cross-­platform  world
• Measurement  of  unduplicated  audiences  across  platforms  
• Effective  frequency  capping  across  platforms
• Aligned  metrics  between  TV  and  Digital  Video
-­ Average  Minute  TV  Audience  vs.  Number  of  Digital  Video  Views
• Correct  measurement  of  reach  on  social  media
-­ De-­duplicating  across  followers
§

31

©  comScore,  Inc.  Proprietary. 31
Measuring  for  the  future  in  a  cross-­platform  world
• Measurement  of  unduplicated  audiences  across  platforms  
• Effective  frequency  capping  across  platforms
• Aligned  metrics  between  TV  and  Digital  Video
-­ Average  Minute  TV  Audience  vs.  Number  of  Digital  Video  Views
• Un-­duplicated  measurement  of  reach  on  social  media
-­ De-­duplicating  across  followers
• Measurement  of  cross-­platform  campaign  effectiveness

32

©  comScore,  Inc.  Proprietary. 32Source:  comScore/dunnhumby for  Digital,  IRI/BehaviorScan for  TV
3.8%
6.8%
8.0%
???
Non-­Targeted  Digital Targeted  Digital TV Targeted  TV
The  value  of  viewable  and  addressable  puts  digital  on  par  with  TV
Average  In-­Store  Brand  Sales  Lift:  TV  vs.  Digital
3  Mo.  For  Digital  vs.  1  Yr.  for  TV
Includes  100%  
viewable  ads
Addressable  Digital

33

©  comScore,  Inc.  Proprietary. 33
$1.00  
$1.19   $1.20  
$1.60  
TV TV  +  Print TV  +  Radio TV  +  Digital
Source:  ARF
A  cross  platform  plan  that  includes  TV  &  digital  can  be  
expected  to  generate  a  higher  ROI  than  TV  alone
Investing  in  TV  +  Digital  =  +60%  ROI

34

©  comScore,  Inc.  Proprietary. 34
Measuring  for  the  future  in  a  cross-­platform  world
• Measurement  of  unduplicated  audiences  across  platforms  
• Effective  frequency  capping  across  platforms
• Aligned  metrics  between  TV  and  Digital  Video
-­ Average  Minute  TV  Audience  vs.  Number  of  Digital  Video  Views
• Un-­duplicated  measurement  of  reach  on  social  media
-­ De-­duplicating  across  followers
• Measurement  of  campaign  effectiveness
• Cooperation  of  the  industry

35

©  comScore,  Inc.  Proprietary.
#InteractIAB
THANK  YOU
Gian  Fulgoni
gfulgoni@comscore.com
@gfulgoni
For  info  about  the  proprietary  technology  used  in  comScore  products,  refer  to  http://comscore.com/Patents

More Related Content

Interact 2017 Keynote speech: Measuring the future by Gian Fulgoni, CEO & Co-Founder, comScore

  • 1. ©  comScore,  Inc.  Proprietary. #InteractIAB MEASURING FOR  THE  FUTURE How  to  Apply  Lessons  Learned  in  Media  Measurement  to   Advance  the  Digital  Industry   Dr.  Gian  Fulgoni CEO  &  Co-­Founder comScore,  Inc. 23  May  2017 For  info  about  the  proprietary  technology  used  in  comScore  products,  refer  to  http://comscore.com/Patents
  • 2. ©  comScore,  Inc.  Proprietary. 2
  • 3. ©  comScore,  Inc.  Proprietary. 3 Digital  is  the  most  measurable   medium  in  the  world ...but  it’s  far  from  perfect
  • 4. ©  comScore,  Inc.  Proprietary. 44©  comScore,  Inc.  Proprietary. Clicks on  ads  are  at  best  an  incomplete – and  at  worst  a  misleading – effectiveness  metric. Measure  attitudinal  and  behavioral  lifts  instead.
  • 5. ©  comScore,  Inc.  Proprietary. 5 Whither  the  Click? Only  1  to  4  clicks  per  one  thousand  impressions! Today,  very  few  people  click  on  ads… Source:  Google  DoubleClick,  November  2016  to  April  2017   Click-­through  rates  across  static  image,  flash  and  rich  media  formats 0.11% 0.16% 0.20% 0.22% 0.15% 5©  comScore,  Inc.  Proprietary.
  • 6. ©  comScore,  Inc.  Proprietary. 6 …and  research  says  clicks  don’t  predict  sales  impact   6©  comScore,  Inc.  Proprietary. A  negative  pattern  exists  between  Sales  Lift   per  Household  and  Click  Through  Rate  (i.e.,   as  CTR  increases,  sales  decrease) R2  =  -­0.039 A  regression  analysis  shows   there  is  no   statistically  significant  relationship  between   CTR  and  Sales $-­ $0.100   $0.200   $0.300   $0.400   $0.500   $0.600   0.00% 0.20% 0.40% 0.60% 0.80% Sales  Lift/HH  in  $   CTR   Sales  Lift/HH  in  $ Click-­through  Rate
  • 7. ©  comScore,  Inc.  Proprietary. 77©  comScore,  Inc.  Proprietary. Self-­reported  online  survey  data  that  requires   consumer  recall  is  misleading  for  cross-­channel  and   cross-­platform  measurement.
  • 8. ©  comScore,  Inc.  Proprietary. 8 Source:  comScore  behavioral  research,  via  passive  observation   Major  source  of  the  problem:  online  survey  panelists  are   heavier-­than-­average  Internet  users  by  a  factor  of  2  to  3 0 50 100 150 200 250 300 350 Time  spent  online Pages   downloaded Searches   conducted Dollars  spent   online Made  online  credit   card  application Paid  bills  online Average  User Survey  Panelist AVERAGE  USER Index
  • 9. ©  comScore,  Inc.  Proprietary. 9 5.0 3.7 Online  Survey Behavioral 4.3 5.4 Online  Survey Behavioral 35%  Overstatement Hours  Per  Day  Online 20%  Understatement Hours  Per  Day  Watching  TV The  reality  is  that  online  surveys  overstate  time  spent  online   by  35%  – and  understate  TV  time  by  20%
  • 10. ©  comScore,  Inc.  Proprietary. 10 *  NRF  Survey   Online  surveys  dramatically  overstate  e-­commerce  spend. E-­commerce  as  %  of   Discretionary  Consumer  Spending E-­commerce  as  %  of   Discretionary  Consumer  Spending U.S.  DEPARTMENT  OF  COMMERCE ONLINE  SURVEY* 42% 14% ** Excludes autos, gas and food / bev
  • 11. ©  comScore,  Inc.  Proprietary. 1111©  comScore,  Inc.  Proprietary. The  accuracy  of  cookie-­based  targeting  leaves   a  lot  to  be  desired…
  • 12. ©  comScore,  Inc.  Proprietary. 12 comScore  in-­target  benchmarks  show  low  demographic   targeting  accuracy 12©  comScore,  Inc.  Proprietary. 39% France 47% Italy 42% Spain 44% UK Source:  comScore  vCE Benchmarks,  Q1  2017.   %  Digital  Ad  Impressions  Delivered  to  Correct  Demographic  
  • 13. ©  comScore,  Inc.  Proprietary. 13 In-­target  accuracy:  why  100%  requires  audience  guarantees   and  make-­goods   13©  comScore,  Inc.  Proprietary. Some  targeting  infers   demography  based  on   content  consumption Nearly  50%  of   computers  are   shared,  so  cookies   don’t  know  who  is   using  the  computer  at   any  given  point  in   time Not  all  registration   data  are  accurate Demographic  data   become  outdated
  • 14. ©  comScore,  Inc.  Proprietary. 14 Industry  benchmarks  can  help  media   buyers  and  sellers  set  campaign  delivery   expectations.   14©  comScore,  Inc.  Proprietary. Measurement  of  Viewability,  Brand  Safety   and  Non-­Human  Traffic  provides  much-­needed  transparency in  an   increasingly  opaque,  programmatic  world. “Keeping  that  digital  ad  in  view  makes  a  real  impression”
  • 15. ©  comScore,  Inc.  Proprietary. 15 About  a  half  of  ads  worldwide  still  don’t  have  the   opportunity  to  be  seen DESKTOP  DISPLAY  VIEWABILITY  RANGES  FROM  48%  -­ 55%  ACROSS  MARKETS Source:  comScore  vCE  Benchmarks,  Global,  Q1  2017 Australia 48% UK 49% Germany 50% France 50% Brazil 53% Spain 54% Italy 54% Mexico 54% Canada 55% US 55%
  • 16. ©  comScore,  Inc.  Proprietary. 16Source:  comScore  vCE  Benchmarks,  US,  Q1  2017 Direct  buys  see  higher  viewability  than  programmatic DESKTOP  DISPLAY DESKTOP  VIDEO DIRECT PROGRAMMATIC DIRECT PROGRAMMATIC 60% 54% 73% 51% Q1   2017
  • 17. ©  comScore,  Inc.  Proprietary. 17Source:  comScore  vCE  Benchmarks,  US,  Q1  2017 High-­price  video  ads  attract  the  most  IVT 6%  IVT DESKTOP  DISPLAY 10%  IVT DESKTOP  VIDEO Q1   2017
  • 18. ©  comScore,  Inc.  Proprietary. 18Source:  comScore  vCE  Benchmarks,  US,  Q1  2017 Programmatic  magnifies  the  IVT  problem DESKTOP  DISPLAY DESKTOP  VIDEO 6% 4% DIRECT PROGRAMMATIC 10% 4% DIRECT PROGRAMMATIC Q1   2017
  • 19. ©  comScore,  Inc.  Proprietary. 19 Digital  media  and  measurement   needs  to  continue  to  evolve
  • 20. ©  comScore,  Inc.  Proprietary. 20 The  industry  is  calling  for  more  focus  on  IMPACT “Viewability  means  opportunity  to  see  [but  it  has]  been   confused  with  fully  viewed,  was  recalled,  was   effective,  made  an  impact,  paid  attention,  delivered   ROI.”   – Marc  Pritchard,  Chief  Brand  Officer,  P&G   “Not  every  marketer  is  obsessed  with how  much  time   consumers  spend with  their  digital  ads  or how  many   pixels  they  see….They  just  want  their  ads  to  work.” “Although  viewability  standards  can  increase  the  overall   quality  of  online  ads,  viewability  by  itself  is  not  an   adequate  measurement  of  ad  quality.” “It  seems  like  a  total  no-­brainer:  No  one  wants  to  pay  for   ads  that  can’t  be  seen.  But  viewability  is  just  one   factor  in  an  effective  campaign…viewability  is  a   useful  metric  but  doesn’t  add  up  as  a  be-­all  end-­all   goal  for  marketers.”
  • 21. ©  comScore,  Inc.  Proprietary. 21 As  an  industry,  we  must  bring  focus  back  to  the  advertising   metrics  that  matter  – and  that  means  accepting  viewability   as  a  necessary  but  not  sufficient – and  increasing  our   attention  on  Unduplicated  R/F,  GRPs  and  Lift  in  Attitudes  and   Sales It’s  clear:  Viewability  alone  is  not  enough.
  • 22. ©  comScore,  Inc.  Proprietary. 22 Measuring  for  the  future  in  a  cross-­platform  world • Measurement  of  unduplicated  audiences  across   platforms  at  a  granular  level
  • 23. ©  comScore,  Inc.  Proprietary. 23Source:  comScore  Xmedia,  February  2015 Cross-­platform  deduplication  in  action:  Millennials  exhibited  much  greater  Time   Shifted  Viewing  (TSV)  and  Digital  consumption  for  a  Network  TV  Series  Finale All  Persons P18-­34 Digital  Only Live  +  7 Live  +  SD Live +21% +3% +24% +35% +8% +43% Incremental  Audience  from  TSV  and  Digital
  • 24. ©  comScore,  Inc.  Proprietary. 24 “We  have  to  get  better  at  cross-­platform   measurement.  Better  at  de-­duplication.  We  need  to   understand  how  much  reach  we  obtain  on  a   campaign  across  devices. With  the  availability  of  cross-­platform  data  that   allows  improved  media  planning,  I  believe  ad   spending  will  increase  across  all  platforms,  including   television.” Irwin  Gottlieb,  Global  Chairman,  GroupM
  • 25. ©  comScore,  Inc.  Proprietary. 25 Measuring  for  the  future  in  a  cross-­platform  world • Measurement  of  unduplicated  audiences  across  platforms  at   a  granular  level   • Effective  frequency  capping  across  platforms
  • 26. 1-­2 3-­9 10-­20 21-­50 51+ 0.8% 33.3% 1.4% 11.0% 19.6% 22.4% 75.4% 23.7% 2.8% 9.6% %  PEOPLE %  IMPRESSIONS MANY  PEOPLE   RECEIVE  TOO   FEW   IMPRESSIONS TOO  MANY   IMPRESSIONS   WASTED  ON   SMALL  NUMBER   OF  PEOPLE Frequency  Distributions Are  Not  Optimal IMPRESSIONS  PER  PERSON
  • 27. 50  EXPOSURES15-­20  EXPOSURES POINT  LIFT  (BRAND) Contribution  of  Incremental  Exposures  Declines  Quickly  After  20  Exposures IMPRESSIONS  PER  PERSON INCREASING   EFFECTIVENESS MINIMAL EFFECTIVENESS DECLINING   EFFECTIVENESS
  • 28. Implications  for  Excessive  Frequency v Frequency  caps  from  20  to  50  are  appropriate  for  most  brands v Exposures above  those  thresholds  are,  at  best, wasted v The  marginal  contribution  of  an  incremental  exposure  declines quickly and loses  over  90%  of  its  effectiveness  even earlier v The  thresholds  for  wasteful  or  harmful  effects  are  likely  to  be  lower for interruptive  advertising  such  as  online  video  ads  or  pop-­up ads
  • 29. ©  comScore,  Inc.  Proprietary. 29 Measuring  for  the  future  in  a  cross-­platform  world • Measurement  of  unduplicated  audiences  across  platforms   • Effective  frequency  capping  across  platforms • Aligned  metrics  between  TV  and  Digital  Video • -­ Average  minute  TV  audience  vs.  number  of  digital  video  views  
  • 30. ©  comScore,  Inc.  Proprietary. 30 Measuring  for  the  future  in  a  cross-­platform  world • Measurement  of  unduplicated  audiences  across  platforms   • Effective  frequency  capping  across  platforms • Aligned  metrics  between  TV  and  Digital  Video -­ Average  Minute  TV  Audience  vs.  Number  of  Digital  Video  Views • Correct  measurement  of  reach  on  social  media -­ De-­duplicating  across  followers §
  • 31. ©  comScore,  Inc.  Proprietary. 31 Measuring  for  the  future  in  a  cross-­platform  world • Measurement  of  unduplicated  audiences  across  platforms   • Effective  frequency  capping  across  platforms • Aligned  metrics  between  TV  and  Digital  Video -­ Average  Minute  TV  Audience  vs.  Number  of  Digital  Video  Views • Un-­duplicated  measurement  of  reach  on  social  media -­ De-­duplicating  across  followers • Measurement  of  cross-­platform  campaign  effectiveness
  • 32. ©  comScore,  Inc.  Proprietary. 32Source:  comScore/dunnhumby for  Digital,  IRI/BehaviorScan for  TV 3.8% 6.8% 8.0% ??? Non-­Targeted  Digital Targeted  Digital TV Targeted  TV The  value  of  viewable  and  addressable  puts  digital  on  par  with  TV Average  In-­Store  Brand  Sales  Lift:  TV  vs.  Digital 3  Mo.  For  Digital  vs.  1  Yr.  for  TV Includes  100%   viewable  ads Addressable  Digital
  • 33. ©  comScore,  Inc.  Proprietary. 33 $1.00   $1.19   $1.20   $1.60   TV TV  +  Print TV  +  Radio TV  +  Digital Source:  ARF A  cross  platform  plan  that  includes  TV  &  digital  can  be   expected  to  generate  a  higher  ROI  than  TV  alone Investing  in  TV  +  Digital  =  +60%  ROI
  • 34. ©  comScore,  Inc.  Proprietary. 34 Measuring  for  the  future  in  a  cross-­platform  world • Measurement  of  unduplicated  audiences  across  platforms   • Effective  frequency  capping  across  platforms • Aligned  metrics  between  TV  and  Digital  Video -­ Average  Minute  TV  Audience  vs.  Number  of  Digital  Video  Views • Un-­duplicated  measurement  of  reach  on  social  media -­ De-­duplicating  across  followers • Measurement  of  campaign  effectiveness • Cooperation  of  the  industry
  • 35. ©  comScore,  Inc.  Proprietary. #InteractIAB THANK  YOU Gian  Fulgoni gfulgoni@comscore.com @gfulgoni For  info  about  the  proprietary  technology  used  in  comScore  products,  refer  to  http://comscore.com/Patents