


introduction to geographical information system
- 1. introduction to geographical information system DR. VENKATESWARLU GOGANA
- 2. Topics 1. Introduction to GIS 2. Components of GIS 3. Types of Data o Spatial Data o Non-Spatial Data 4. GIS Operations 5. Coordinate Systems 6. Datum 7. Map Projections 8. Raster Data Compression Techniques 9. GIS Software 10. Free GIS Data Resources
- 3. Data vs Information Data, by itself, generally differs from information. Data is of little use unless it is transformed into information. Information is an answer to a question based on raw data. We transform data into information through the use of an Information System.
- 4. What is GIS? A Geographic Information System (GIS) is a computer system for capturing, storing, checking, and displaying data related to positions on Earth's surface.
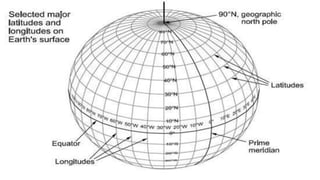
- 5. Geographic Information Systems (GIS) Geography – The study of where features are located on the Earth’s surface. Geographic coordinate systems latitude longitude - Represent exact positions on the Earth - 42.3216, -71.089118 (lat. long. for Boston) Georeferencing / Geocoding – The process of assigning geographic coordinates to features to represent their location.
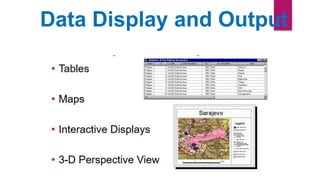
- 7. GIS Functions • Capture: Paper maps, digital data, coordinates, GPS, all together = gis data • Store: Vector (database consisting of points, lines and polygons) or raster formats (grid cells or pixels) • Query: Identifying specific features, identify features based on conditions (counties with population greater than 500,000) • Analyze: Proximity (parcels 100 feet from the road), overlay, network analysis (how linear features are connected • Display: Maps, graphs, Reports • Output: Paper maps, image
- 8. Data Capture
- 9. Data Storage
- 10. • Common Manipulation • Query • Reclassification • Map Projection changes • Spatial Analysis • Buffering • Overlay • Network Spatial Data Manipulation and Analysis
- 11. Data Display and Output
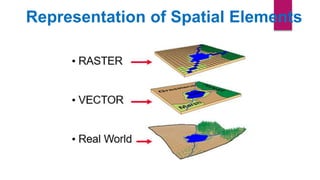
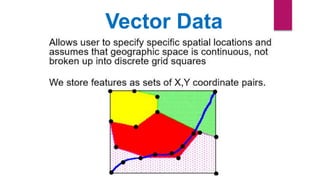
- 14. Types of Data 1. Attribute data: Says what a feature is Ex.: statistics, text, images, sound, etc. 2. Spatial data: Says where the feature is Vector data: Discrete data o Points o Lines o Polygons (zones or areas) Raster data: Continuous data
- 15. Representation of Spatial Elements
- 16. Raster Data
- 17. Vector Data
- 19. Raster vs Vector
- 20. Data Model A geographic data model is a structure for organizing geospatial data so that it can be easily stored and retrieved. Geographic coordinates Tabular attributes
- 21. File-based Data Models Coverages Developed for workstation Arc/Info ~ 1980 Complex structure, proprietary format Attributes in Info tables Shapefiles Developed for ArcView ~ 1993 Simpler structure in public domain Attributes in dBase (.dbf) tables Geographic coordinates and attributes are stored in separate but linked files Arc Info
- 22. Geodatabase model Stores geographic coordinates as one attribute (shape) in a relational database table Uses MS Access for “Personal Geodatabase” (single user) Uses Oracle, SQL Server, MySQL or other commercial relational databases for “Enterprise Geodatabases” (many simultaneous users) Shape
- 23. File Formats
- 24. Shape File
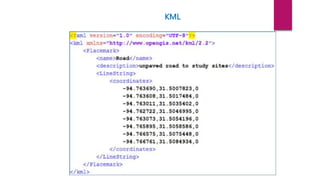
- 25. KML
- 26. GeoJSON
- 27. GeoJSON
- 33. Raster Data - Compression Techniques Raster data is comprised of grid cells. Vector data is comprised of vertices and paths. These are the two primary spatial data types in GIS. Raster Data: Accuracy depends on cell size. Cell size must be small enough to capture the required detail. And as resolution increases, the size of the cell decreases. But this comes at a cost for speed of processing and data storage. Raster storage in its raw state is inefficient because it is normally stores values row-by-row from the top left corner. The way to improve raster size efficiency is through image compression. And there are several ways to use GIS compression to reduce file size and still maintain quality of data.
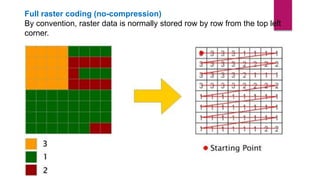
- 34. Full raster coding (no-compression) By convention, raster data is normally stored row by row from the top left corner.
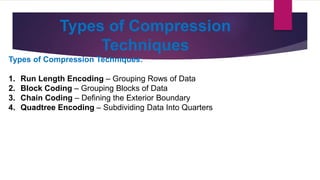
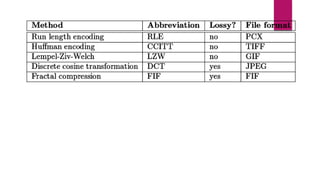
- 35. Types of Compression Techniques Types of Compression Techniques: 1. Run Length Encoding – Grouping Rows of Data 2. Block Coding – Grouping Blocks of Data 3. Chain Coding – Defining the Exterior Boundary 4. Quadtree Encoding – Subdividing Data Into Quarters
- 36. 1. Run Length Encoding – Grouping Rows of Data Run length encoding stores cells on a row-by-row basis. Instead of recording each individual cell’s values, run length encoding groups cell values by row. Take this line of data: AAAAAABBBBCCCCCCCCC It can be rendered as: 6A4B9C This image encoding method reduces data volumes because each line is recorded more efficiently. Even though the same information is being held, values that are the same are stored as a string.
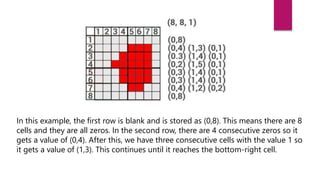
- 37. In this example, the first row is blank and is stored as (0,8). This means there are 8 cells and they are all zeros. In the second row, there are 4 consecutive zeros so it gets a value of (0,4). After this, we have three consecutive cells with the value 1 so it gets a value of (1,3). This continues until it reaches the bottom-right cell.
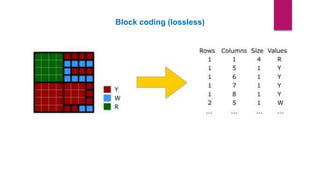
- 39. 2. Block Coding – Grouping Blocks of Data The block coding raster storage technique assigns areas that are blocks to reduce redundancy. The block coding raster image compression method subdivides an entire raster image into hierarchical blocks. It’s an extension of the run length encoding technique, but extends it to two dimensions.
- 40. In the example above: Instead of storing 64 grid cells, all it takes is just 7 blocks. Using block coding, it requires one 3×3 block, two 2×2 blocks and four 1×1 cell blocks to encode this raster image. In this block coding example, the top-left corner is used as a reference for each block.
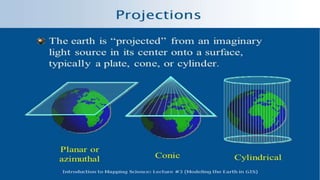
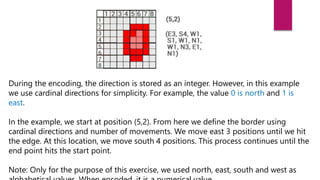
- 42. 3. Chain Coding – Defining the Exterior Boundary Chain coding defines the outer boundary using relative positions from a start point. The sequence of the exterior is stored where the endpoint finishes at the start point. During the encoding, the direction is stored as an integer. However, in this example we use cardinal directions for simplicity. For example, the value 0 is north and 1 is east.
- 43. During the encoding, the direction is stored as an integer. However, in this example we use cardinal directions for simplicity. For example, the value 0 is north and 1 is east. In the example, we start at position (5,2). From here we define the border using cardinal directions and number of movements. We move east 3 positions until we hit the edge. At this location, we move south 4 positions. This process continues until the end point hits the start point. Note: Only for the purpose of this exercise, we used north, east, south and west as
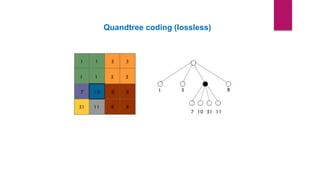
- 44. 4. Quadtree Encoding – Subdividing Data Into Quarters Quadtrees are raster data structures based on the successive reduction of homogeneous cells. It recursively subdivides a raster image into quarters. The subdivision process continues until each cell is classed. It reduces raster storage requirements. It also is dependent on the complexity of the feature and the resolution of the smallest grid cell. In the example, the top-left and bottom-right 8×8 grids do not need to be subdivided further because they are homogeneous. The top-right 8×8 grid is subdivided into three 4×4 grid. The remaining 4×4 grid is separated into 4 individual classes.
- 47. GIS Software GIS Software: Google Earth Pro – To View and Download Historical Satellite Image Data Two Versions: Web & Desktop 1. QGIS – Open Source 2. ArcGIS – ESRI’s Product - Commercial Software 3. AutoCAD Map – Autodesk’s Product (No Support for Analysis, But useful for Data Creation) - Commercial 4. Global Mapper – Free and Commercial 5. MapInfo - Commercial 6. Small World - Commercial 7. Bentley Map - Commercial
- 48. Free GIS Data Resources Free GIS Data Sources: ISRO-NRSC Bhuvan Website - https://bhuvan.nrsc.gov.in (for Indian Satellite Data) USGS - https://www.usgs.gov (for World Satellite Data) Google Earth Engine - https://earthengine.google.com (For World Satellite Data Processing & Analysis using JavaScript / Python script without Downloading Data and without GIS Software) Free GIS Data Viewers: Google Earth (Web Version) - https://earth.google.com/web Google Earth Pro (Desktop Version) - https://www.google.com/earth/versions/#download-pro (To view and download Historical Image Data)
- 49. Reference Textbook of Remote Sensing and Geographical Information Systems M. Anji Reddy BS Publications