Location via proxy:   [ UP ]  
[Report a bug]   [Manage cookies]                
SlideShare a Scribd company logo
Arid Zone Journal of Engineering, Technology and Environment, December, 2017; Vol. 13(6):868-877
Copyright © Faculty of Engineering, University of Maiduguri, Maiduguri, Nigeria.
Print ISSN: 1596-2490, Electronic ISSN: 2545-5818, www.azojete.com.ng
868
INUNDATION AND HAZARD MAPPING ON RIVER ASA, USING GIS
O. S. Olaniyan1
, O.M. Olaniyan2
, I. A. Azeez3
, A. S. Akolade4
1,3,4
Department of Civil Engineering Ladoke Akintola University of Technology, Ogbomoso.
2
Department of Computer Engineering Federal University of Oye Ekiti.
Corresponding Author: olatayo.olaniyan@fuoye.edu.ng or osolaniyan@lautech.edu.ng
Abstract
The prevalence of flooding in Nigeria has underlined the need for rational and accurate mitigation of the
menace. The major part of River Asa in Ilorin is traditionally identified as a flood prone area of Kwara State.
Most of the flood management strategies in this region have been geared towards ‘preventing’ flood by an
attempt to contain the river. No attention is paid on forecasting on the extent of flood for a particular return
period due to insufficient hydrological record. Preparation of a comprehensive flood hazard map for this
river would be the one of most crucial steps for implementing non-structural remedial measures. Therefore,
this research was aimed at producing an inundation and hazard map using a Geographical Information
System across River Asa. Thirty (30) years of rainfall data obtained from Kwara State meteorological station
was used to derived hydraulic discharge of the river using Institute of hydrology method of model. Log
Pearson Type III model was for flood frequency distribution. The elevation data was obtained by extracting
the contour lines on the Federal Survey maps. Digital Elevation Model (DEM) was generated from the
contour lines of the catchment by interpolating contour values using GIS. The floodplain map was obtained
by analysing the combined factors of rainfall, land use variation, DEM and slope, being the major factors
contributing to the flooding of an area. The actual catchment area contributed to Asa dam discharge is
537.30 km² and soil infiltration capacity is medium with value of 0.35 because more than 55% of soil
formation is stone basement formation. The built up area within the catchment has increased by 14.353 km²
(23.89%) with an annual change of 1.3km² between 1976 and 2004. Log Pearson Type III model gave a
discharge ranges from (6306 – 10,458) m3
/s for return period between (2-50) years. The flood risk map
showed that 56% of existing structure will be at risk at discharge value of 50 years return period. The study
produced inundation and hazard map of River Asa using Remote sensing data. The map will help state
government in making decision to mitigate flooding.
Keywords: River, Remote sensing, Flooding, Hazard map, ArcGIS
1.0 Introduction
Federal, state and local government have embarked on developmental and protective works on
different water courses; such include river basin, canal, sea bed and stream across the country. The
developmental works include construction Zungeru and Mambiladam for hydro-power, canal for
irrigation, multipurpose water resources projects and navigation works (Olaniyan, 2014). The
protective works include flood embankment, channel improvement, and erosion control works like
levee, spurs and bank pitching. Most of the protective work has been taken up on major rivers like
Asa River in Ilorin, Ogunpa and Ajegunle canal in Lagos where the problem of river instability,
flooding and consequent bank erosion are particularly severe (Olaniyan, 2014).
In Nigeria, flooding is a common experience in all parts of the country. The causes are mainly from
the three major factors namely: heavy downpour, overflow of drainage channels and emergency
release of water from dams. Flooding is an important issue of global concern as a result of its
effects on man and his environment. Heavy rainfall for considerably longer periods often builds up
excess water beyond which percolation can accommodate. As a result of this, the water level begins
to rise until it begins to flood in the direction of slopes and into neighbouring depression. Flooding
in major cities of Nigeria like Ilorin, the largest urban centre in North Central Nigeria is a common
Olaniyan, et al.: Inundation and Hazard Mapping on River Asa, using GIS. AZOJETE, 13(6):868-877.
ISSN 1596-2490; e-ISSN 2545-5818, www.azojete.com.ng
869
phenomenon which occurs along river course of the city each time when major rivers in the city
such over flow its bank (Aboderin, 2015).
Moreover, population growth has brought about pressure, which keeps forcing millions of people,
especially poor people to settle in unsafe areas with inherent associated risks. Flooding cannot be
completely avoided, but damages from severe flooding can be reduced if effective flood prevention
scheme is implemented. Mitigation is hence the cornerstone of emergency management. The non –
structural methods of mitigation of flood hazards are less expensive as compared to structural ones
(dams and lakes). Among the non – structural methods, modern flood forecasting and real – time
data collection system have grown favour in countries prone to flood hazards (Adewale et al., 2010)
Aboderin (2010) researched on delineation of flood vulnerable zones and disaster risk management
on Asa river. Many research with no emphasis on the extent of flood when the river inundate its
bank especially on major river such as Asa due to inadequate hydrological record Nigeria as nation
has less than 200 rain gauging station with average record length of 60 years. In recent time, there
have been extreme climatic condition due to climate change, rapid urbanization and change in land
use, the intensity of rainfall has increased tremendously causing flood in many area and countries
worldwide. It is therefore prudent that such a natural hazard is addressed in a way to reduce the
impact it causes on people and the environment base on available discharge record (Olaniyan et al.,
2015).
There is high tendency for further flooding along river plain. The importance of this study is to
provide information that would be helpful in regulating development along the flood plain and
provide visual information on extent of the flood and expected area to be affected. (Grafton and
Hussey, 2011).This study modelled inundation and hazard map of River Asa using Geographic
Information System (GIS), HEC-RAS and HEC-GeoRAS hydraulic model. Landsat imagery of
30m resolution was used in this study. Thirty years (30 years) rainfall data from Nigerian
Metrological Agency was used for discharge and flood frequency models. Steady flow state is
considered since flow condition is assumed constant for upstream and downstream section of the
river.
1.1 Environmental Studies Using GIS
Geographic Information System (GIS) is designed to visualize, store and analyse the information
about locations, topology and other environmental features and attribute (Alaeddine, 2013). GIS
programs are capable of storing and managing these data in a relational database embedded in the
system. In GIS, environmental data and their map representations are dynamically linked so that
any changes made in the databases are reflected immediately on its map presentation. This linkage
between the map and the databases makes GIS an ideal and strong tool for environment data
visualization and analysis (Adewale et al., 2010).
Water demand of any community includes; sanitation, drinking manufacturing, construction, leisure
and agriculture. Integrated water resources management activities include; planning, development,
distribution and management of hydrological features for the optimum use of water resources.
Integrated water resources management is an approach that seeks to supply water in the right
quantity and quality and allocate water on an equitable basis to satisfy all uses and demands
(Olaniyan et al., 2015; Grafton and Hussey, 2011).
GIS is a general purpose technology which can be used effectively water resources engineers for
Arid Zone Journal of Engineering, Technology and Environment, December, 2017; Vol. 13(6):868-877.
ISSN 1596-2490; e-ISSN 2545-5818; www.azojete.com.ng
870
water management planning. The water management planning processes include; Watershed
delineation, Floodplains identification, Pollution detection and Groundwater delineation. GIS is
capable of organizing and processing hydrological spatial attributes in database to support suitable
and effective decision making. In addition, GIS can be used for developing hydrological models.
These models are used to assess water availability in watershed, groundwater level and availability
and spring flows (Alaeddine, 2013).
One of the most powerful aids of GIS hydrology is the new tools for creating spatial and
spatiotemporal models of land surfaces, climatic phenomena (e.g. precipitation, and temperature)
and soil properties from measured data. The inclusion of the ANUDEM elevation gridding
procedure in Arc Info (Version 7.0 and higher) illustrates these new capabilities. ANUDEM and
TOPOGRID take irregular point or contour data and create square-grid digital elevation
measurements (DEMs). The procedure automatically moves spurious pits within use-defined
tolerances, calculates stream and gridlines from points of locally maximum curvature on contour
lines and incorporates a drainage enforcement algorithm to maintain fidelity with a catchment’s
drainage network (Collins et al., 2012; Jibril, and Liman, 2014).
1.2 Floodplains Identification
Environmental Agencies have invested substantially in collecting hydrometric and topological data
using various techniques. This data are used for a wide range of purposes such as flood risk
mapping, catchment flood management plans, shoreline management plans and integrated coaster
zone management using GIS. These results provide essential information for day to day asset
management and long term flood risk management. GIS is useful to store and manage hydrological
data to generating flood inundating and hazard maps. This will be useful in flood risk management
(Minya et al., 2005).
Most hydrological processes are time dependent. Spatially referenced time-series data are
frequently encountered in simulating hydrological events. Therefore, it is important to have an
efficient data structure and data management system to handle spatially-referenced time series data.
Data structures designed can be either embedded in or connected to a GIS map to manage and
analyze the spatially-referenced time series data efficiently and effectively (Minya et al., 2005;
Olaniyan et al., 2015).
2.0 Methodology
2.1 Study Area
The study area is Ilorin the state capital of Kwara State, North Central Nigeria. It is located on
latitude 8°30´ N and Longitude 4°33ʹ E with an area of about 1000 km square. The state has river
Niger as its natural boundary along the Northern and Eastern Margins and share boundary with
Niger state in the North, Kogi in the East, Oyo, Qndo and Osun states in the south and international
boundary with the Republic of Benin in the West (Jibril, and Liman, 2014).
The geology of Ilorin consists of Pre-Cambial basement complex. The elevation varies from (273 -
333) m in the west with isolated hill (Sobi hills) of about 394m above sea level and (200 – 364) m
in the East. Also, the climatic condition is humid tropical type characterized by wet and dry season.
The temperature in Ilorin is uniformly high throughout the year (Aboderin, 2015).
Olaniyan, et al.: Inundation and Hazard Mapping on River Asa, using GIS. AZOJETE, 13(6):868-877.
ISSN 1596-2490; e-ISSN 2545-5818, www.azojete.com.ng
871
The vegetation of the area of study was characterized by scattered tall tress shrubs, of between the
height of ten and twelve feet. Some of the notable trees include butter trees, Acacia, Locust beans,
Baobab, Akin-apple etc. Ilorin is covered mainly by ferruginous soil on crystalline acidic rock. This
soil type has both sandy and clayey deposit lying on top of each other. The soil surface is made up
of sandy deposit characterised by low water holding capacity. The land use pattern was majorly
residential, industrial, agricultural and recreational. `The data collected are Field measurement data
i.e. record of the river and spatial data from spatial agencies. These data were analysed using
theoretical and overlay analysis (Adewale et al., 2010).
2.2 Land-use Map
The input maps required for generating the land use was obtained from Federal Ministry of
Environment, and Goggle Earth, The maps are scanned Analogue land use-map of 1976 and 1987,
Google Earth land use map 0f 1994 and 2004. The input maps were imported in to ArcGIS
environment through a process known Adding of Data. The Digitised land-use and Google maps
were geo-referenced, that is, the map was given its correct coordinates through the process of geo-
referencing within the ArcGIS environment.
The extraction of the land use data from the input map involved other processes such as; rectifying,
digitizing, laying-out and exporting. The land use pattern considered were shrubs, forested,
industrial, residential, paved, clayey, loamy and sandy areas. Laying-out is the act of given
necessary attributes of a map to our newly produced map.
2.3 Digital Elevation Measurement (DEM)
The input required for generating DEM are elevation data of Kwara State. These elevation data
would be obtained by extracting the contour lines on the Federal Survey maps. Geographic
Positioning System (Garmin GPS) was also used to retrieve the elevations of selected stations to
improve the accuracy of the result. DEM was generated from the contour lines of the catchment by
interpolating contour values using GIS. The contour lines were first transformed to point features.
The point features were interpolated to produce a spatial variation of elevation with the catchment.
The spatially varying elevation is the required DEM. Natural Neighbour method of interpolation
was used to generate the DEM.
2.4 Floodplain Map
Floodplains mapping of the river was based on the land use, rainfall, elevation, and slope data. The
slope map which shows the variation of the rate of change of elevation with distance in degree was
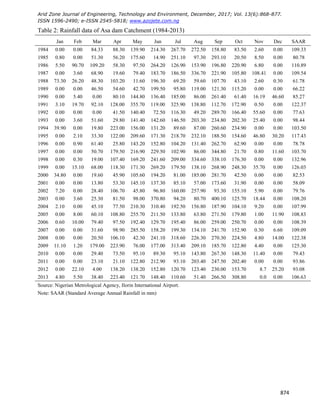
generated from the DEM. The rainfall data of Asa dam catchment on Table 2 were used to compute
discharge base on method of Hydrological Institute of Technology, and returns period of 5, 10, 25,
50, 100 and 200 years were projected using log Pearson’s Type III model (Olaniyan, 2014).
Discharge values of 50years return period were further analysis with GIS, HEC-RAS and HEC-
GeoRAS to produce Inundation map of the river.
3.0 Results and Discussion
The built up area around the catchment between 1976 and 2004 has increased by 14.353 km²
(23.89%) with an annual change of 1.3 km². The cultivated area also increase by 83.381 km²
(12.49%) with an annual change of 7.58 km² between 1976 -1987. While between 1987 and 1994,
Arid Zone Journal of Engineering, Technology and Environment, December, 2017; Vol. 13(6):868-877.
ISSN 1596-2490; e-ISSN 2545-5818; www.azojete.com.ng
872
the built up area increased by 15.7199 km² (26.158%) with an annual change of 2.25 km². Also,
between 1994 and 2004the built-up area increased by 50.6451 km² (66.8%) with an annual change
of 5.06 km². There was lost in cultivated area by 69.598 km² (10.41%) with an annual change of
6.96 km². There was increased in vegetal cover as much as 11.953 km² (60.32%) with an annual
change 0f 1.8 km².
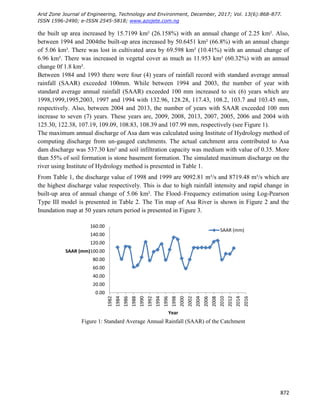
Between 1984 and 1993 there were four (4) years of rainfall record with standard average annual
rainfall (SAAR) exceeded 100mm. While between 1994 and 2003, the number of year with
standard average annual rainfall (SAAR) exceeded 100 mm increased to six (6) years which are
1998,1999,1995,2003, 1997 and 1994 with 132.96, 128.28, 117.43, 108.2, 103.7 and 103.45 mm,
respectively. Also, between 2004 and 2013, the number of years with SAAR exceeded 100 mm
increase to seven (7) years. These years are, 2009, 2008, 2013, 2007, 2005, 2006 and 2004 with
125.30, 122.38, 107.19, 109.09, 108.83, 108.39 and 107.99 mm, respectively (see Figure 1).
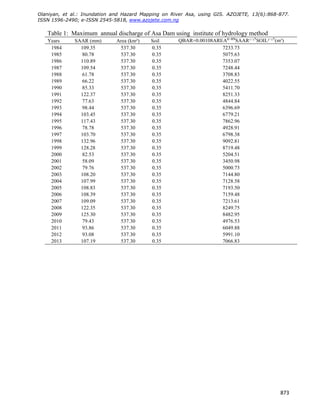
The maximum annual discharge of Asa dam was calculated using Institute of Hydrology method of
computing discharge from un-gauged catchments. The actual catchment area contributed to Asa
dam discharge was 537.30 km² and soil infiltration capacity was medium with value of 0.35. More
than 55% of soil formation is stone basement formation. The simulated maximum discharge on the
river using Institute of Hydrology method is presented in Table 1.
From Table 1, the discharge value of 1998 and 1999 are 9092.81 m³/s and 8719.48 m³/s which are
the highest discharge value respectively. This is due to high rainfall intensity and rapid change in
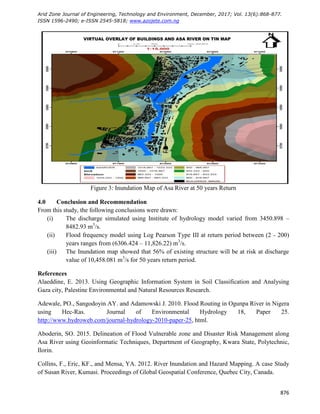
built-up area of annual change of 5.06 km². The Flood–Frequency estimation using Log-Pearson
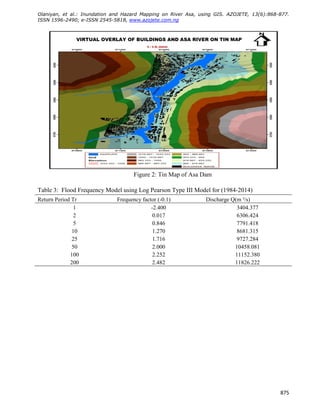
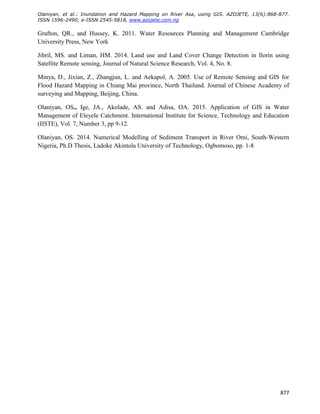
Type III model is presented in Table 2. The Tin map of Asa River is shown in Figure 2 and the
Inundation map at 50 years return period is presented in Figure 3.
Figure 1: Standard Average Annual Rainfall (SAAR) of the Catchment
0.00
20.00
40.00
60.00
80.00
100.00
120.00
140.00
160.00
1982
1984
1986
1988
1990
1992
1994
1996
1998
2000
2002
2004
2006
2008
2010
2012
2014
2016
SAAR (mm)
Year
SAAR (mm)
Olaniyan, et al.: Inundation and Hazard Mapping on River Asa, using GIS. AZOJETE, 13(6):868-877.
ISSN 1596-2490; e-ISSN 2545-5818, www.azojete.com.ng
873
Table 1: Maximum annual discharge of Asa Dam using institute of hydrology method
Years SAAR (mm) Area (km²) Soil QBAR=0.00108AREA⁰˙⁸⁹SAAR¹˙¹⁷SOIL²˙¹⁷(m³)
1984 109.35 537.30 0.35 7233.73
1985 80.78 537.30 0.35 5075.63
1986 110.89 537.30 0.35 7353.07
1987 109.54 537.30 0.35 7248.44
1988 61.78 537.30 0.35 3708.83
1989 66.22 537.30 0.35 4022.55
1990 85.33 537.30 0.35 5411.70
1991 122.37 537.30 0.35 8251.33
1992 77.63 537.30 0.35 4844.84
1993 98.44 537.30 0.35 6396.69
1994 103.45 537.30 0.35 6779.21
1995 117.43 537.30 0.35 7862.96
1996 78.78 537.30 0.35 4928.91
1997 103.70 537.30 0.35 6798.38
1998 132.96 537.30 0.35 9092.81
1999 128.28 537.30 0.35 8719.48
2000 82.53 537.30 0.35 5204.51
2001 58.09 537.30 0.35 3450.98
2002 79.76 537.30 0.35 5000.73
2003 108.20 537.30 0.35 7144.80
2004 107.99 537.30 0.35 7128.58
2005 108.83 537.30 0.35 7193.50
2006 108.39 537.30 0.35 7159.48
2007 109.09 537.30 0.35 7213.61
2008 122.35 537.30 0.35 8249.75
2009 125.30 537.30 0.35 8482.95
2010 79.43 537.30 0.35 4976.53
2011 93.86 537.30 0.35 6049.88
2012 93.08 537.30 0.35 5991.10
2013 107.19 537.30 0.35 7066.83
Arid Zone Journal of Engineering, Technology and Environment, December, 2017; Vol. 13(6):868-877.
ISSN 1596-2490; e-ISSN 2545-5818; www.azojete.com.ng
874
Table 2: Rainfall data of Asa dam Catchment (1984-2013)
Jan Feb Mar Apr May Jun Jul Aug Sep Oct Nov Dec SAAR
1984 0.00 0.00 84.33 88.30 139.90 214.30 267.70 272.50 158.80 83.50 2.60 0.00 109.33
1985 0.80 0.00 51.30 56.20 175.60 14.90 251.10 97.30 293.10 20.50 8.50 0.00 80.78
1986 5.50 90.70 109.20 58.30 97.50 264.20 126.90 153.90 196.80 220.90 6.80 0.00 110.89
1987 0.00 3.60 68.90 19.60 79.40 183.70 186.50 336.70 221.90 105.80 108.41 0.00 109.54
1988 73.30 26.20 48.30 103.20 11.60 196.30 69.20 59.60 107.70 43.10 2.60 0.30 61.78
1989 0.00 0.00 46.50 54.60 42.70 199.50 95.80 119.00 121.30 115.20 0.00 0.00 66.22
1990 0.00 5.40 0.00 80.10 144.80 136.40 185.00 86.00 261.40 61.40 16.19 46.60 85.27
1991 3.10 19.70 92.10 128.00 355.70 119.00 325.90 138.80 112.70 172.90 0.50 0.00 122.37
1992 0.00 0.00 0.00 41.50 140.40 72.50 116.30 49.20 289.70 166.40 55.60 0.00 77.63
1993 0.00 3.60 51.60 29.80 141.40 142.60 146.50 203.30 234.80 202.30 25.40 0.00 98.44
1994 39.90 0.00 19.80 223.00 156.00 131.20 89.60 87.00 260.60 234.90 0.00 0.00 103.50
1995 0.00 2.10 33.30 122.00 209.60 171.30 218.70 232.10 188.50 154.60 46.80 30.20 117.43
1996 0.00 0.90 61.40 25.80 143.20 152.80 104.20 131.40 262.70 62.90 0.00 0.00 78.78
1997 0.00 0.00 50.70 179.50 216.90 229.50 102.90 86.00 344.80 21.70 0.80 11.60 103.70
1998 0.00 0.30 19.00 107.40 169.20 241.60 209.00 334.60 338.10 176.30 0.00 0.00 132.96
1999 0.00 15.10 68.00 118.30 171.30 269.20 179.50 138.10 268.90 248.30 35.70 0.00 126.03
2000 34.80 0.00 19.60 45.90 105.60 194.20 81.00 185.00 281.70 42.50 0.00 0.00 82.53
2001 0.00 0.00 13.80 53.30 145.10 137.30 85.10 57.00 173.60 31.90 0.00 0.00 58.09
2002 7.20 0.00 28.40 106.70 45.80 96.80 160.00 257.90 93.30 155.10 5.90 0.00 79.76
2003 0.00 3.60 25.30 81.50 98.00 370.80 94.20 80.70 400.10 125.70 18.44 0.00 108.20
2004 2.10 0.00 45.10 77.50 210.30 310.40 192.50 156.80 187.90 104.10 9.20 0.00 107.99
2005 0.00 8.00 60.10 108.80 255.70 211.50 133.80 63.80 271.50 179.80 1.00 11.90 108.83
2006 0.60 10.00 79.40 97.50 192.40 129.70 195.40 86.00 259.00 250.70 0.00 0.00 108.39
2007 0.00 0.00 31.60 98.90 285.50 158.20 199.30 134.10 241.70 152.90 0.30 6.60 109.09
2008 0.00 0.00 20.50 106.10 42.30 241.10 318.60 226.30 270.30 224.50 4.80 14.00 122.38
2009 11.10 1.20 179.00 223.90 76.00 177.00 313.40 209.10 185.70 122.80 4.40 0.00 125.30
2010 0.00 0.00 29.40 73.50 95.10 89.30 95.10 143.80 267.30 148.30 11.40 0.00 79.43
2011 0.00 0.00 23.10 21.10 122.80 212.90 93.10 203.40 247.50 202.40 0.00 0.00 93.86
2012 0.00 22.10 4.00 138.20 138.20 152.80 120.70 123.40 230.00 153.70 8.7 25.20 93.08
2013 4.80 5.50 38.40 223.40 121.70 148.40 110.60 51.40 266.50 308.80 0.0 0.00 106.63
Source: Nigerian Metrological Agency, Ilorin International Airport.
Note: SAAR (Standard Average Annual Rainfall in mm)
Olaniyan, et al.: Inundation and Hazard Mapping on River Asa, using GIS. AZOJETE, 13(6):868-877.
ISSN 1596-2490; e-ISSN 2545-5818, www.azojete.com.ng
875
Figure 2: Tin Map of Asa Dam
Table 3: Flood Frequency Model using Log Pearson Type III Model for (1984-2014)
Return Period Tr Frequency factor (-0.1) Discharge Q(m ³/s)
1 -2.400 3404.377
2 0.017 6306.424
5 0.846 7791.418
10 1.270 8681.315
25 1.716 9727.284
50 2.000 10458.081
100 2.252 11152.380
200 2.482 11826.222
VIRTUAL OVERLAY OF BUILDINGS AND ASA RIVER ON TIN MAP
Arid Zone Journal of Engineering, Technology and Environment, December, 2017; Vol. 13(6):868-877.
ISSN 1596-2490; e-ISSN 2545-5818; www.azojete.com.ng
876
Figure 3: Inundation Map of Asa River at 50 years Return
4.0 Conclusion and Recommendation
From this study, the following conclusions were drawn:
(i) The discharge simulated using Institute of hydrology model varied from 3450.898 –
8482.93 m3
/s.
(ii) Flood frequency model using Log Pearson Type III at return period between (2 - 200)
years ranges from (6306.424 – 11,826.22) m3
/s.
(iii) The Inundation map showed that 56% of existing structure will be at risk at discharge
value of 10,458.081 m3
/s for 50 years return period.
References
Alaeddine, E. 2013. Using Geographic Information System in Soil Classification and Analysing
Gaza city, Palestine Environmental and Natural Resources Research.
Adewale, PO., Sangodoyin AY. and Adamowski J. 2010. Flood Routing in Ogunpa River in Nigera
using Hec-Ras. Journal of Environmental Hydrology 18, Paper 25.
http://www.hydroweb.com/journal-hydrology-2010-paper-25, html.
Aboderin, SO. 2015. Delineation of Flood Vulnerable zone and Disaster Risk Management along
Asa River using Geoinformatic Techniques, Department of Geography, Kwara State, Polytechnic,
Ilorin.
Collins, F., Eric, KF., and Mensa, YA. 2012. River Inundation and Hazard Mapping. A case Study
of Susan River, Kumasi. Proceedings of Global Geospatial Conference, Quebec City, Canada.
VIRTUAL OVERLAY OF BUILDINGS AND ASA RIVER ON TIN MAP
Olaniyan, et al.: Inundation and Hazard Mapping on River Asa, using GIS. AZOJETE, 13(6):868-877.
ISSN 1596-2490; e-ISSN 2545-5818, www.azojete.com.ng
877
Grafton, QR., and Hussey, K. 2011. Water Resources Planning and Management Cambridge
University Press, New York
Jibril, MS. and Liman, HM. 2014. Land use and Land Cover Change Detection in Ilorin using
Satellite Remote sensing, Journal of Natural Science Research, Vol. 4, No. 8.
Minya, D., Jixian, Z., Zhangjun, L. and Aekapol, A. 2005. Use of Remote Sensing and GIS for
Flood Hazard Mapping in Chiang Mai province, North Thailand. Journal of Chinese Academy of
surveying and Mapping, Beijing, China.
Olaniyan, OS., Ige, JA., Akolade, AS. and Adisa, OA. 2015. Application of GIS in Water
Management of Eleyele Catchment. International Institute for Science, Technology and Education
(IISTE), Vol. 7, Number 3, pp 9-12.
Olaniyan, OS. 2014. Numerical Modelling of Sediment Transport in River Omi, South-Western
Nigeria, Ph.D Thesis, Ladoke Akintola University of Technology, Ogbomoso, pp. 1-8

More Related Content

Inundation and Hazard Mapping on River Asa, using GIS

  • 1. Arid Zone Journal of Engineering, Technology and Environment, December, 2017; Vol. 13(6):868-877 Copyright © Faculty of Engineering, University of Maiduguri, Maiduguri, Nigeria. Print ISSN: 1596-2490, Electronic ISSN: 2545-5818, www.azojete.com.ng 868 INUNDATION AND HAZARD MAPPING ON RIVER ASA, USING GIS O. S. Olaniyan1 , O.M. Olaniyan2 , I. A. Azeez3 , A. S. Akolade4 1,3,4 Department of Civil Engineering Ladoke Akintola University of Technology, Ogbomoso. 2 Department of Computer Engineering Federal University of Oye Ekiti. Corresponding Author: olatayo.olaniyan@fuoye.edu.ng or osolaniyan@lautech.edu.ng Abstract The prevalence of flooding in Nigeria has underlined the need for rational and accurate mitigation of the menace. The major part of River Asa in Ilorin is traditionally identified as a flood prone area of Kwara State. Most of the flood management strategies in this region have been geared towards ‘preventing’ flood by an attempt to contain the river. No attention is paid on forecasting on the extent of flood for a particular return period due to insufficient hydrological record. Preparation of a comprehensive flood hazard map for this river would be the one of most crucial steps for implementing non-structural remedial measures. Therefore, this research was aimed at producing an inundation and hazard map using a Geographical Information System across River Asa. Thirty (30) years of rainfall data obtained from Kwara State meteorological station was used to derived hydraulic discharge of the river using Institute of hydrology method of model. Log Pearson Type III model was for flood frequency distribution. The elevation data was obtained by extracting the contour lines on the Federal Survey maps. Digital Elevation Model (DEM) was generated from the contour lines of the catchment by interpolating contour values using GIS. The floodplain map was obtained by analysing the combined factors of rainfall, land use variation, DEM and slope, being the major factors contributing to the flooding of an area. The actual catchment area contributed to Asa dam discharge is 537.30 km² and soil infiltration capacity is medium with value of 0.35 because more than 55% of soil formation is stone basement formation. The built up area within the catchment has increased by 14.353 km² (23.89%) with an annual change of 1.3km² between 1976 and 2004. Log Pearson Type III model gave a discharge ranges from (6306 – 10,458) m3 /s for return period between (2-50) years. The flood risk map showed that 56% of existing structure will be at risk at discharge value of 50 years return period. The study produced inundation and hazard map of River Asa using Remote sensing data. The map will help state government in making decision to mitigate flooding. Keywords: River, Remote sensing, Flooding, Hazard map, ArcGIS 1.0 Introduction Federal, state and local government have embarked on developmental and protective works on different water courses; such include river basin, canal, sea bed and stream across the country. The developmental works include construction Zungeru and Mambiladam for hydro-power, canal for irrigation, multipurpose water resources projects and navigation works (Olaniyan, 2014). The protective works include flood embankment, channel improvement, and erosion control works like levee, spurs and bank pitching. Most of the protective work has been taken up on major rivers like Asa River in Ilorin, Ogunpa and Ajegunle canal in Lagos where the problem of river instability, flooding and consequent bank erosion are particularly severe (Olaniyan, 2014). In Nigeria, flooding is a common experience in all parts of the country. The causes are mainly from the three major factors namely: heavy downpour, overflow of drainage channels and emergency release of water from dams. Flooding is an important issue of global concern as a result of its effects on man and his environment. Heavy rainfall for considerably longer periods often builds up excess water beyond which percolation can accommodate. As a result of this, the water level begins to rise until it begins to flood in the direction of slopes and into neighbouring depression. Flooding in major cities of Nigeria like Ilorin, the largest urban centre in North Central Nigeria is a common
  • 2. Olaniyan, et al.: Inundation and Hazard Mapping on River Asa, using GIS. AZOJETE, 13(6):868-877. ISSN 1596-2490; e-ISSN 2545-5818, www.azojete.com.ng 869 phenomenon which occurs along river course of the city each time when major rivers in the city such over flow its bank (Aboderin, 2015). Moreover, population growth has brought about pressure, which keeps forcing millions of people, especially poor people to settle in unsafe areas with inherent associated risks. Flooding cannot be completely avoided, but damages from severe flooding can be reduced if effective flood prevention scheme is implemented. Mitigation is hence the cornerstone of emergency management. The non – structural methods of mitigation of flood hazards are less expensive as compared to structural ones (dams and lakes). Among the non – structural methods, modern flood forecasting and real – time data collection system have grown favour in countries prone to flood hazards (Adewale et al., 2010) Aboderin (2010) researched on delineation of flood vulnerable zones and disaster risk management on Asa river. Many research with no emphasis on the extent of flood when the river inundate its bank especially on major river such as Asa due to inadequate hydrological record Nigeria as nation has less than 200 rain gauging station with average record length of 60 years. In recent time, there have been extreme climatic condition due to climate change, rapid urbanization and change in land use, the intensity of rainfall has increased tremendously causing flood in many area and countries worldwide. It is therefore prudent that such a natural hazard is addressed in a way to reduce the impact it causes on people and the environment base on available discharge record (Olaniyan et al., 2015). There is high tendency for further flooding along river plain. The importance of this study is to provide information that would be helpful in regulating development along the flood plain and provide visual information on extent of the flood and expected area to be affected. (Grafton and Hussey, 2011).This study modelled inundation and hazard map of River Asa using Geographic Information System (GIS), HEC-RAS and HEC-GeoRAS hydraulic model. Landsat imagery of 30m resolution was used in this study. Thirty years (30 years) rainfall data from Nigerian Metrological Agency was used for discharge and flood frequency models. Steady flow state is considered since flow condition is assumed constant for upstream and downstream section of the river. 1.1 Environmental Studies Using GIS Geographic Information System (GIS) is designed to visualize, store and analyse the information about locations, topology and other environmental features and attribute (Alaeddine, 2013). GIS programs are capable of storing and managing these data in a relational database embedded in the system. In GIS, environmental data and their map representations are dynamically linked so that any changes made in the databases are reflected immediately on its map presentation. This linkage between the map and the databases makes GIS an ideal and strong tool for environment data visualization and analysis (Adewale et al., 2010). Water demand of any community includes; sanitation, drinking manufacturing, construction, leisure and agriculture. Integrated water resources management activities include; planning, development, distribution and management of hydrological features for the optimum use of water resources. Integrated water resources management is an approach that seeks to supply water in the right quantity and quality and allocate water on an equitable basis to satisfy all uses and demands (Olaniyan et al., 2015; Grafton and Hussey, 2011). GIS is a general purpose technology which can be used effectively water resources engineers for
  • 3. Arid Zone Journal of Engineering, Technology and Environment, December, 2017; Vol. 13(6):868-877. ISSN 1596-2490; e-ISSN 2545-5818; www.azojete.com.ng 870 water management planning. The water management planning processes include; Watershed delineation, Floodplains identification, Pollution detection and Groundwater delineation. GIS is capable of organizing and processing hydrological spatial attributes in database to support suitable and effective decision making. In addition, GIS can be used for developing hydrological models. These models are used to assess water availability in watershed, groundwater level and availability and spring flows (Alaeddine, 2013). One of the most powerful aids of GIS hydrology is the new tools for creating spatial and spatiotemporal models of land surfaces, climatic phenomena (e.g. precipitation, and temperature) and soil properties from measured data. The inclusion of the ANUDEM elevation gridding procedure in Arc Info (Version 7.0 and higher) illustrates these new capabilities. ANUDEM and TOPOGRID take irregular point or contour data and create square-grid digital elevation measurements (DEMs). The procedure automatically moves spurious pits within use-defined tolerances, calculates stream and gridlines from points of locally maximum curvature on contour lines and incorporates a drainage enforcement algorithm to maintain fidelity with a catchment’s drainage network (Collins et al., 2012; Jibril, and Liman, 2014). 1.2 Floodplains Identification Environmental Agencies have invested substantially in collecting hydrometric and topological data using various techniques. This data are used for a wide range of purposes such as flood risk mapping, catchment flood management plans, shoreline management plans and integrated coaster zone management using GIS. These results provide essential information for day to day asset management and long term flood risk management. GIS is useful to store and manage hydrological data to generating flood inundating and hazard maps. This will be useful in flood risk management (Minya et al., 2005). Most hydrological processes are time dependent. Spatially referenced time-series data are frequently encountered in simulating hydrological events. Therefore, it is important to have an efficient data structure and data management system to handle spatially-referenced time series data. Data structures designed can be either embedded in or connected to a GIS map to manage and analyze the spatially-referenced time series data efficiently and effectively (Minya et al., 2005; Olaniyan et al., 2015). 2.0 Methodology 2.1 Study Area The study area is Ilorin the state capital of Kwara State, North Central Nigeria. It is located on latitude 8°30´ N and Longitude 4°33ʹ E with an area of about 1000 km square. The state has river Niger as its natural boundary along the Northern and Eastern Margins and share boundary with Niger state in the North, Kogi in the East, Oyo, Qndo and Osun states in the south and international boundary with the Republic of Benin in the West (Jibril, and Liman, 2014). The geology of Ilorin consists of Pre-Cambial basement complex. The elevation varies from (273 - 333) m in the west with isolated hill (Sobi hills) of about 394m above sea level and (200 – 364) m in the East. Also, the climatic condition is humid tropical type characterized by wet and dry season. The temperature in Ilorin is uniformly high throughout the year (Aboderin, 2015).
  • 4. Olaniyan, et al.: Inundation and Hazard Mapping on River Asa, using GIS. AZOJETE, 13(6):868-877. ISSN 1596-2490; e-ISSN 2545-5818, www.azojete.com.ng 871 The vegetation of the area of study was characterized by scattered tall tress shrubs, of between the height of ten and twelve feet. Some of the notable trees include butter trees, Acacia, Locust beans, Baobab, Akin-apple etc. Ilorin is covered mainly by ferruginous soil on crystalline acidic rock. This soil type has both sandy and clayey deposit lying on top of each other. The soil surface is made up of sandy deposit characterised by low water holding capacity. The land use pattern was majorly residential, industrial, agricultural and recreational. `The data collected are Field measurement data i.e. record of the river and spatial data from spatial agencies. These data were analysed using theoretical and overlay analysis (Adewale et al., 2010). 2.2 Land-use Map The input maps required for generating the land use was obtained from Federal Ministry of Environment, and Goggle Earth, The maps are scanned Analogue land use-map of 1976 and 1987, Google Earth land use map 0f 1994 and 2004. The input maps were imported in to ArcGIS environment through a process known Adding of Data. The Digitised land-use and Google maps were geo-referenced, that is, the map was given its correct coordinates through the process of geo- referencing within the ArcGIS environment. The extraction of the land use data from the input map involved other processes such as; rectifying, digitizing, laying-out and exporting. The land use pattern considered were shrubs, forested, industrial, residential, paved, clayey, loamy and sandy areas. Laying-out is the act of given necessary attributes of a map to our newly produced map. 2.3 Digital Elevation Measurement (DEM) The input required for generating DEM are elevation data of Kwara State. These elevation data would be obtained by extracting the contour lines on the Federal Survey maps. Geographic Positioning System (Garmin GPS) was also used to retrieve the elevations of selected stations to improve the accuracy of the result. DEM was generated from the contour lines of the catchment by interpolating contour values using GIS. The contour lines were first transformed to point features. The point features were interpolated to produce a spatial variation of elevation with the catchment. The spatially varying elevation is the required DEM. Natural Neighbour method of interpolation was used to generate the DEM. 2.4 Floodplain Map Floodplains mapping of the river was based on the land use, rainfall, elevation, and slope data. The slope map which shows the variation of the rate of change of elevation with distance in degree was generated from the DEM. The rainfall data of Asa dam catchment on Table 2 were used to compute discharge base on method of Hydrological Institute of Technology, and returns period of 5, 10, 25, 50, 100 and 200 years were projected using log Pearson’s Type III model (Olaniyan, 2014). Discharge values of 50years return period were further analysis with GIS, HEC-RAS and HEC- GeoRAS to produce Inundation map of the river. 3.0 Results and Discussion The built up area around the catchment between 1976 and 2004 has increased by 14.353 km² (23.89%) with an annual change of 1.3 km². The cultivated area also increase by 83.381 km² (12.49%) with an annual change of 7.58 km² between 1976 -1987. While between 1987 and 1994,
  • 5. Arid Zone Journal of Engineering, Technology and Environment, December, 2017; Vol. 13(6):868-877. ISSN 1596-2490; e-ISSN 2545-5818; www.azojete.com.ng 872 the built up area increased by 15.7199 km² (26.158%) with an annual change of 2.25 km². Also, between 1994 and 2004the built-up area increased by 50.6451 km² (66.8%) with an annual change of 5.06 km². There was lost in cultivated area by 69.598 km² (10.41%) with an annual change of 6.96 km². There was increased in vegetal cover as much as 11.953 km² (60.32%) with an annual change 0f 1.8 km². Between 1984 and 1993 there were four (4) years of rainfall record with standard average annual rainfall (SAAR) exceeded 100mm. While between 1994 and 2003, the number of year with standard average annual rainfall (SAAR) exceeded 100 mm increased to six (6) years which are 1998,1999,1995,2003, 1997 and 1994 with 132.96, 128.28, 117.43, 108.2, 103.7 and 103.45 mm, respectively. Also, between 2004 and 2013, the number of years with SAAR exceeded 100 mm increase to seven (7) years. These years are, 2009, 2008, 2013, 2007, 2005, 2006 and 2004 with 125.30, 122.38, 107.19, 109.09, 108.83, 108.39 and 107.99 mm, respectively (see Figure 1). The maximum annual discharge of Asa dam was calculated using Institute of Hydrology method of computing discharge from un-gauged catchments. The actual catchment area contributed to Asa dam discharge was 537.30 km² and soil infiltration capacity was medium with value of 0.35. More than 55% of soil formation is stone basement formation. The simulated maximum discharge on the river using Institute of Hydrology method is presented in Table 1. From Table 1, the discharge value of 1998 and 1999 are 9092.81 m³/s and 8719.48 m³/s which are the highest discharge value respectively. This is due to high rainfall intensity and rapid change in built-up area of annual change of 5.06 km². The Flood–Frequency estimation using Log-Pearson Type III model is presented in Table 2. The Tin map of Asa River is shown in Figure 2 and the Inundation map at 50 years return period is presented in Figure 3. Figure 1: Standard Average Annual Rainfall (SAAR) of the Catchment 0.00 20.00 40.00 60.00 80.00 100.00 120.00 140.00 160.00 1982 1984 1986 1988 1990 1992 1994 1996 1998 2000 2002 2004 2006 2008 2010 2012 2014 2016 SAAR (mm) Year SAAR (mm)
  • 6. Olaniyan, et al.: Inundation and Hazard Mapping on River Asa, using GIS. AZOJETE, 13(6):868-877. ISSN 1596-2490; e-ISSN 2545-5818, www.azojete.com.ng 873 Table 1: Maximum annual discharge of Asa Dam using institute of hydrology method Years SAAR (mm) Area (km²) Soil QBAR=0.00108AREA⁰˙⁸⁹SAAR¹˙¹⁷SOIL²˙¹⁷(m³) 1984 109.35 537.30 0.35 7233.73 1985 80.78 537.30 0.35 5075.63 1986 110.89 537.30 0.35 7353.07 1987 109.54 537.30 0.35 7248.44 1988 61.78 537.30 0.35 3708.83 1989 66.22 537.30 0.35 4022.55 1990 85.33 537.30 0.35 5411.70 1991 122.37 537.30 0.35 8251.33 1992 77.63 537.30 0.35 4844.84 1993 98.44 537.30 0.35 6396.69 1994 103.45 537.30 0.35 6779.21 1995 117.43 537.30 0.35 7862.96 1996 78.78 537.30 0.35 4928.91 1997 103.70 537.30 0.35 6798.38 1998 132.96 537.30 0.35 9092.81 1999 128.28 537.30 0.35 8719.48 2000 82.53 537.30 0.35 5204.51 2001 58.09 537.30 0.35 3450.98 2002 79.76 537.30 0.35 5000.73 2003 108.20 537.30 0.35 7144.80 2004 107.99 537.30 0.35 7128.58 2005 108.83 537.30 0.35 7193.50 2006 108.39 537.30 0.35 7159.48 2007 109.09 537.30 0.35 7213.61 2008 122.35 537.30 0.35 8249.75 2009 125.30 537.30 0.35 8482.95 2010 79.43 537.30 0.35 4976.53 2011 93.86 537.30 0.35 6049.88 2012 93.08 537.30 0.35 5991.10 2013 107.19 537.30 0.35 7066.83
  • 7. Arid Zone Journal of Engineering, Technology and Environment, December, 2017; Vol. 13(6):868-877. ISSN 1596-2490; e-ISSN 2545-5818; www.azojete.com.ng 874 Table 2: Rainfall data of Asa dam Catchment (1984-2013) Jan Feb Mar Apr May Jun Jul Aug Sep Oct Nov Dec SAAR 1984 0.00 0.00 84.33 88.30 139.90 214.30 267.70 272.50 158.80 83.50 2.60 0.00 109.33 1985 0.80 0.00 51.30 56.20 175.60 14.90 251.10 97.30 293.10 20.50 8.50 0.00 80.78 1986 5.50 90.70 109.20 58.30 97.50 264.20 126.90 153.90 196.80 220.90 6.80 0.00 110.89 1987 0.00 3.60 68.90 19.60 79.40 183.70 186.50 336.70 221.90 105.80 108.41 0.00 109.54 1988 73.30 26.20 48.30 103.20 11.60 196.30 69.20 59.60 107.70 43.10 2.60 0.30 61.78 1989 0.00 0.00 46.50 54.60 42.70 199.50 95.80 119.00 121.30 115.20 0.00 0.00 66.22 1990 0.00 5.40 0.00 80.10 144.80 136.40 185.00 86.00 261.40 61.40 16.19 46.60 85.27 1991 3.10 19.70 92.10 128.00 355.70 119.00 325.90 138.80 112.70 172.90 0.50 0.00 122.37 1992 0.00 0.00 0.00 41.50 140.40 72.50 116.30 49.20 289.70 166.40 55.60 0.00 77.63 1993 0.00 3.60 51.60 29.80 141.40 142.60 146.50 203.30 234.80 202.30 25.40 0.00 98.44 1994 39.90 0.00 19.80 223.00 156.00 131.20 89.60 87.00 260.60 234.90 0.00 0.00 103.50 1995 0.00 2.10 33.30 122.00 209.60 171.30 218.70 232.10 188.50 154.60 46.80 30.20 117.43 1996 0.00 0.90 61.40 25.80 143.20 152.80 104.20 131.40 262.70 62.90 0.00 0.00 78.78 1997 0.00 0.00 50.70 179.50 216.90 229.50 102.90 86.00 344.80 21.70 0.80 11.60 103.70 1998 0.00 0.30 19.00 107.40 169.20 241.60 209.00 334.60 338.10 176.30 0.00 0.00 132.96 1999 0.00 15.10 68.00 118.30 171.30 269.20 179.50 138.10 268.90 248.30 35.70 0.00 126.03 2000 34.80 0.00 19.60 45.90 105.60 194.20 81.00 185.00 281.70 42.50 0.00 0.00 82.53 2001 0.00 0.00 13.80 53.30 145.10 137.30 85.10 57.00 173.60 31.90 0.00 0.00 58.09 2002 7.20 0.00 28.40 106.70 45.80 96.80 160.00 257.90 93.30 155.10 5.90 0.00 79.76 2003 0.00 3.60 25.30 81.50 98.00 370.80 94.20 80.70 400.10 125.70 18.44 0.00 108.20 2004 2.10 0.00 45.10 77.50 210.30 310.40 192.50 156.80 187.90 104.10 9.20 0.00 107.99 2005 0.00 8.00 60.10 108.80 255.70 211.50 133.80 63.80 271.50 179.80 1.00 11.90 108.83 2006 0.60 10.00 79.40 97.50 192.40 129.70 195.40 86.00 259.00 250.70 0.00 0.00 108.39 2007 0.00 0.00 31.60 98.90 285.50 158.20 199.30 134.10 241.70 152.90 0.30 6.60 109.09 2008 0.00 0.00 20.50 106.10 42.30 241.10 318.60 226.30 270.30 224.50 4.80 14.00 122.38 2009 11.10 1.20 179.00 223.90 76.00 177.00 313.40 209.10 185.70 122.80 4.40 0.00 125.30 2010 0.00 0.00 29.40 73.50 95.10 89.30 95.10 143.80 267.30 148.30 11.40 0.00 79.43 2011 0.00 0.00 23.10 21.10 122.80 212.90 93.10 203.40 247.50 202.40 0.00 0.00 93.86 2012 0.00 22.10 4.00 138.20 138.20 152.80 120.70 123.40 230.00 153.70 8.7 25.20 93.08 2013 4.80 5.50 38.40 223.40 121.70 148.40 110.60 51.40 266.50 308.80 0.0 0.00 106.63 Source: Nigerian Metrological Agency, Ilorin International Airport. Note: SAAR (Standard Average Annual Rainfall in mm)
  • 8. Olaniyan, et al.: Inundation and Hazard Mapping on River Asa, using GIS. AZOJETE, 13(6):868-877. ISSN 1596-2490; e-ISSN 2545-5818, www.azojete.com.ng 875 Figure 2: Tin Map of Asa Dam Table 3: Flood Frequency Model using Log Pearson Type III Model for (1984-2014) Return Period Tr Frequency factor (-0.1) Discharge Q(m ³/s) 1 -2.400 3404.377 2 0.017 6306.424 5 0.846 7791.418 10 1.270 8681.315 25 1.716 9727.284 50 2.000 10458.081 100 2.252 11152.380 200 2.482 11826.222 VIRTUAL OVERLAY OF BUILDINGS AND ASA RIVER ON TIN MAP
  • 9. Arid Zone Journal of Engineering, Technology and Environment, December, 2017; Vol. 13(6):868-877. ISSN 1596-2490; e-ISSN 2545-5818; www.azojete.com.ng 876 Figure 3: Inundation Map of Asa River at 50 years Return 4.0 Conclusion and Recommendation From this study, the following conclusions were drawn: (i) The discharge simulated using Institute of hydrology model varied from 3450.898 – 8482.93 m3 /s. (ii) Flood frequency model using Log Pearson Type III at return period between (2 - 200) years ranges from (6306.424 – 11,826.22) m3 /s. (iii) The Inundation map showed that 56% of existing structure will be at risk at discharge value of 10,458.081 m3 /s for 50 years return period. References Alaeddine, E. 2013. Using Geographic Information System in Soil Classification and Analysing Gaza city, Palestine Environmental and Natural Resources Research. Adewale, PO., Sangodoyin AY. and Adamowski J. 2010. Flood Routing in Ogunpa River in Nigera using Hec-Ras. Journal of Environmental Hydrology 18, Paper 25. http://www.hydroweb.com/journal-hydrology-2010-paper-25, html. Aboderin, SO. 2015. Delineation of Flood Vulnerable zone and Disaster Risk Management along Asa River using Geoinformatic Techniques, Department of Geography, Kwara State, Polytechnic, Ilorin. Collins, F., Eric, KF., and Mensa, YA. 2012. River Inundation and Hazard Mapping. A case Study of Susan River, Kumasi. Proceedings of Global Geospatial Conference, Quebec City, Canada. VIRTUAL OVERLAY OF BUILDINGS AND ASA RIVER ON TIN MAP
  • 10. Olaniyan, et al.: Inundation and Hazard Mapping on River Asa, using GIS. AZOJETE, 13(6):868-877. ISSN 1596-2490; e-ISSN 2545-5818, www.azojete.com.ng 877 Grafton, QR., and Hussey, K. 2011. Water Resources Planning and Management Cambridge University Press, New York Jibril, MS. and Liman, HM. 2014. Land use and Land Cover Change Detection in Ilorin using Satellite Remote sensing, Journal of Natural Science Research, Vol. 4, No. 8. Minya, D., Jixian, Z., Zhangjun, L. and Aekapol, A. 2005. Use of Remote Sensing and GIS for Flood Hazard Mapping in Chiang Mai province, North Thailand. Journal of Chinese Academy of surveying and Mapping, Beijing, China. Olaniyan, OS., Ige, JA., Akolade, AS. and Adisa, OA. 2015. Application of GIS in Water Management of Eleyele Catchment. International Institute for Science, Technology and Education (IISTE), Vol. 7, Number 3, pp 9-12. Olaniyan, OS. 2014. Numerical Modelling of Sediment Transport in River Omi, South-Western Nigeria, Ph.D Thesis, Ladoke Akintola University of Technology, Ogbomoso, pp. 1-8