


Investor Meetings - July 2019
- 1. Investor Meetings July 9-10, 2019
- 2. Caution Regarding Forward-Looking Statements Both these slides and the accompanying oral presentations contain certain forward-looking statements within the meaning of the United States Private Securities Litigation Reform Act of 1995 and forward-looking information within the meaning of the Securities Act (Ontario) and comparable legislation in other provinces (collectively referred to herein as forward-looking statements). Forward-looking statements can be identified by the use of words such as “plans”, “expects” or “does not expect”, “is expected”, “budget”, “scheduled”, “estimates”, “forecasts”, “intends”, “anticipates” or “does not anticipate”, or “believes”, or variation of such words and phrases or state that certain actions, events or results “may”, “could”, “should”, “would”, “might” or “will” be taken, occur or be achieved. Forward-looking statements involve known and unknown risks, uncertainties and other factors which may cause the actual results, performance or achievements of Teck to be materially different from any future results, performance or achievements expressed or implied by the forward-looking statements. These forward-looking statements include statements relating to management’s expectations with respect to: future value catalysts; the creation of value through Project Satellite; the intention to repurchase Class B shares and amount of Class B shares to be repurchased under the additional share buyback; production, supply, demand and outlook regarding coal, copper, zinc and energy for Teck and global markets generally; projected and targeted operating and capital costs; expected EBITDA margins at our operations; future value from QB2/QB3; Teck’s share of remaining equity capital and timing of contributions relating to our QB2 project; all projections and expectations regarding QB2 and QB3, including, but not limited to, those set out in the "QB2 Value Creation" and “Quebrada Blanca” Appendix (including, but not limited to, statements that QB2 will be a world class, low cost copper opportunity, statements and expectations regarding the value and amount of contingent consideration, timing of first production, long-life and expansion potential, projected IRR, QB2 throughput, mine life, projected copper production including Teck’s pro-forma copper exposure estimates, strip-ratios, costs (including C1 and AISC), reserves and resources, construction schedule and ownership of pipelines and port facilities, expansion and extension potential, Teck’s expectations around how it will fund QB2 development costs and its expectation that its solid financial position and return of cash to shareholders will be maintained throughout QB2 construction, Teck’s expectation that it will have significant free cash flow between 2018 and 2020, and all other economic and financial projections regarding the QB2 project and Teck’s contributions thereto including expected EBITDA from the project); long-term strategy; anticipated capital allocation; our sustainability strategy and the targets, goals and expectations relating thereto; the long life of our projects and operations, their positioning on the cost curve and the low risk of the jurisdictions in which they are located; mine life estimates; commodity price leverage; our reserve and resource estimates; potential growth options; all guidance including but not limited to production guidance, sales and unit cost guidance and capital expenditures guidance; future commodity prices; the benefits of our innovation strategy and initiatives described under the “Innovation” Appendix and elsewhere, including regarding smart shovels, autonomous haul trucks and artificial intelligence, and the savings potential associated therewith; the coal market generally; growth potential for our steelmaking coal production, including our expectation that our coal reserves support approximately 27-28 million tonnes of production in 2020 and beyond; strip ratios; potential costs and savings associated with saturated rock fills and the expectation that saturated rock fills have the potential to replace or augment AWTFs in the future; capital costs for water treatment; port capacity increases; the copper market generally; copper growth potential and expectations regarding the potential production profile of our various copper projects; our Highland Valley Copper 2040 Project; our Project Satellite projects including future spending and potential mine life; the zinc market generally; anticipated zinc production, capital investments and costs; our potential zinc projects, including Aktigiruq/Anarraaq and a potential restart of Pend Oreille; the energy market generally; anticipated Fort Hills production and cost estimates and debottlenecking opportunities; potential benefits and capacity increase from debottlenecking opportunities at Fort Hills and costs associated with debottlenecking; production estimates and timing for regulatory approvals at Frontier and Lease 421; the expectation that Fort Hills will provide free cash flow for decades and a steady and reliable cash flow; potential for longer term expansion opportunities at Fort Hills and associated costs; the low carbon intensity of Fort Hills; statements regarding liquidity and availability of credit facilities; Teck’s capital priorities and objectives of its capital allocation framework, including with respect to its dividend policy and maintenance of investment grade metrics; and exchange rates. The forward-looking statements in these slides and accompanying oral presentation are based on numerous assumptions, and actual results may vary materially. These assumptions include, but are not limited to, assumptions regarding: general business and economic conditions; the supply and demand for, deliveries of, and the level and volatility of prices of, zinc, copper and coal and other primary metals and minerals as well as oil, and related products; the supply and demand for our blended bitumen; the timing of the receipt of regulatory and governmental approvals for our development projects and other operations, including our QB2 and QB3 projects; our production and productivity levels, as well as those of our competitors; our anticipated costs of development and production; power prices; continuing availability of water and power resources for our projects and operations; market competition; the accuracy of our reserve and resources estimates (including with respect to size, grade and recoverability) and the geological, operational and price assumptions on which these are based; conditions in financial markets generally; the future financial performance of the company; our ability to attract and retain skilled staff; our ability to procure equipment and operating supplies in sufficient quantities and on a timely basis; positive results from the studies on our expansion projects; our product inventories; our ability to secure adequate transportation for our products; our ability to obtain permits for our operations and expansions; our ongoing relations with our employees and business partners and joint venturers; interest rates; acts of foreign and domestic governments; the timing of development of our competitors’ projects; and the impact of changes in the Canadian – U.S. dollar and other foreign exchange rates on our costs and results. Statements regarding returns of cash to shareholders include assumptions regarding our future business and prospects and other uses for cash or retaining cash. Payment of dividends is in the discretion of the board of directors. Statements regarding our reserve and resource life estimates assume the mine life of longest lived resource in the relevant commodity is achieved, assumes production at planned rates and in some cases development of as yet undeveloped projects and assumes resources are upgraded to reserves and that all mineral and oil and gas reserves and resources could be mined. Management’s expectations of mine life are based on the current planned production rates and assume that all reserves and resources described in this presentation are developed. Assumptions regarding our potential reserve and resource life assume that all resources are upgraded to reserves and that all reserves and resources could be mined. Our estimated profit and EBITDA and EBITDA sensitivity estimates are based on the commodity price and assumptions stated on the relevant slide or footnote, as well has other assumptions including foreign exchange rates. Cost statements are based on assumptions noted in the relevant slide or footnote. Statements regarding future production are based on the assumption of project sanctions and mine production. Our Elk Valley Water Quality Plan statements are based on assumptions regarding the effectiveness of current technology, and that it will perform as expected. Statements concerning future production costs or volumes are based on numerous assumptions of management regarding operating matters and on assumptions that demand for products develops as anticipated, that customers and other counterparties perform their contractual obligations, that operating and capital plans will not be disrupted by issues such as mechanical failure, unavailability of parts and supplies, labour disturbances, interruption in transportation or utilities, adverse weather conditions, and that there are no material unanticipated variations in the cost of energy or supplies. 2
- 3. Caution Regarding Forward-Looking Statements Statements regarding anticipated steelmaking coal sales volumes and average steelmaking coal prices depend on timely arrival of vessels and performance of our steelmaking coal-loading facilities, as well as the level of spot pricing sales. All QB2 economic analysis assume the inferred resources in the Sanction Case and inferred resources are considered too geologically speculative to be economic. Forward-looking statements relating to the timing and amount of Teck’s equity contributions for QB2 assume that the project spending does not increase and contributions are required in accordance with the current project schedule. All QB2 mining and economic projections (including QB2 mine life, throughput, timing of first production, amount of production, costs (including C1 and AISC), expected EBITDA from the project) and projected capital intensity figures depend on the QB2 project coming into production in accordance with the current budget and project schedule. Forward looking statements regarding the amount of pro forma copper produced from QB2 depends on Teck achieving its projected copper production targets for 2021 and QB2 producing as expected. The unescalated contributions and capital requirements for QB2 do not include a number of variables that are described in the footnotes to the disclosure and could be greater once those variables are taken into account. The final amount of the US$50 million contingent payment is tied to throughput and depends on achieving certain throughput targets by December 31, 2025 and is subject to reduction in the event that certain throughput and recovery targets are not achieved. The amount of the contingent payment regarding QB3 depends on a sanction decision being made by December 31, 2031 and may also be reduced if certain throughput and recovery targets on QB2 are not achieved. Assumptions are also included in the footnotes to various slides. The foregoing list of assumptions is not exhaustive. Factors that may cause actual results to vary materially include, but are not limited to: changes in commodity and power prices; changes in market demand for our products; changes in interest and currency exchange rates; acts of foreign and domestic governments; the outcome of legal proceedings; inaccurate geological and metallurgical assumptions (including with respect to the size, grade and recoverability of reserves and resources); unanticipated operational difficulties (including failure of plant, equipment or processes to operate in accordance with specifications or expectations, cost escalation, unavailability of materials and equipment, government action or delays in the receipt of government approvals, industrial disturbances or other job action, adverse weather conditions and unanticipated events related to health, safety and environmental matters); any change or deterioration in our relationships with our joint venture partners; union labour disputes; political risk; social unrest; consequences of climate change; changes in laws or regulations or enforcement thereof; development and use of new technology; failure of customers or counterparties (including but not limited to rail, port, pipeline and other logistics providers) to perform their contractual obligations; changes in our credit ratings or the financial market in general; unanticipated increases in costs to construct our development projects; difficulty in obtaining permits or securing transportation for our products; inability to address concerns regarding permits of environmental impact assessments; changes in tax benefits or tax rates; resolution of environmental and other proceedings or disputes; and changes or deterioration in general economic conditions. We will not achieve the maximum mine lives of our projects, or be able to mine all reserves at our projects or operations, if we do not obtain relevant permits for our operations. Our Fort Hills and Antamina operations are not controlled by us, as a result the actions of our partners may affected anticipated outcomes. NuevaUnión and our Galore Creek project are each 50% owned by us and the timing of development may be impacted by the actions of our partner. Unanticipated technology or environmental interactions could affect the effectiveness of our Elk Valley Water Quality Plan strategy. Purchases of Class B shares under the normal course issuer bid may be impacted by, amount other things, availability of Class B shares, share price volatility, and availability of funds to purchase shares. We assume no obligation to update forward-looking statements except as required under securities laws. Further information concerning assumptions, risks and uncertainties associated with these forward-looking statements and our business can be found in our most recent Annual Information Form, as well as subsequent filings of our management’s discussion and analysis of quarterly results and other subsequent filings, all filed under our profile on SEDAR (www.sedar.com) and on EDGAR (www.sec.gov). Scientific and technical information regarding our material mining projects in this presentation was approved by Mr. Rodrigo Alves Marinho, P.Geo., an employee of Teck. Mr. Marinho is a qualified person, as defined under National Instrument (NI) 43-101. QB2 Project Disclosure All economic analysis with respect to the QB2 project based on a development case which includes inferred resources within the life of mine plan, referred to as the Sanction Case, which is the case on which Teck is basing its development decision for the QB2 project. Inferred resources are considered too speculative geologically to have the economic considerations applied to them that would enable them to be categorized as mineral reserves. Inferred resources are subject to greater uncertainty than measured or indicated resources and it cannot be assumed that they will be successfully upgraded to measured and indicated through further drilling. Nonetheless, based on the nature of the mineralization, Teck has used a mine plan including inferred resources as the development mine plan for the QB2 project. The economic analysis of the Sanction Case, which includes inferred resources, may be compared to economic analysis regarding a hypothetical mine plan which does not include the use of inferred resources as mill feed, referred to as the Reserve Case, and which is set out in Appendix slides “QB2 Project Economics Comparison” and “QB2 Reserves and Resources Comparison” and is further discussed in our Annual Information Form filed under our profile on SEDAR (www.sedar.com) and on EDGAR (www.sec.gov). The scientific and technical information regarding the QB2 project was prepared under the supervision of Rodrigo Marinho, P. Geo, who is an employee of Teck. Mr. Marinho is a qualified person, as defined under National Instrument 43-101. 3
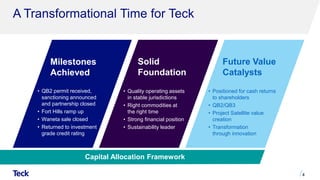
- 4. Milestones Achieved Solid Foundation Future Value Catalysts A Transformational Time for Teck 4 • QB2 permit received, sanctioning announced and partnership closed • Fort Hills ramp up • Waneta sale closed • Returned to investment grade credit rating • Quality operating assets in stable jurisdictions • Right commodities at the right time • Strong financial position • Sustainability leader • Positioned for cash returns to shareholders • QB2/QB3 • Project Satellite value creation • Transformation through innovation Capital Allocation Framework
- 5. 467 1,269 233 115 1,793 592 2019E Pre Close 2019E Post Close 2020E 2021E 2022E Teck Contribution Sumitomo Contribution Project Finance QB2 Project Finance Signed • Facility signed on May 30, 2019 ‒ US$2.5 billion ‒ 12 year tenor, with competitively priced funding from international policy and commercial banks • QB2 partnership and financing plan dramatically reduces Teck’s capital requirements ‒ Teck's share of remaining equity capital before escalation is ~US$693 million1, with no contributions required until late 20202 5 QB2 Funding Profile Before Escalation3 (US$M) Sumitomo true-up post closing $138 $1,384 $1,843 $1,292 $82
- 6. • Redeemed US$600 million of 8.5% 2024 notes on June 29, 2019 • Announced that the Board directed an additional $600 million repurchase of Class B shares under NCIB on May 30, 2019, bringing the total share buyback announced since November 2018 to $1 billion Capital Allocation Further Debt Reduction Additional Share Buyback 6 2 2019E excludes any supplemental dividends or buybacks at year-end Returns to Shareholders (C$M)Note Maturity Profile1 (C$M) 0 200 400 600 800 2016 2017 2018 2019E Regular Base Dividend Supplemental Dividends Share Buybacks 0 200 400 600 800 1,000 1,200 2019 2021 2023 2025 2027 2029 2031 2033 2035 2037 2039 2041 2043
- 7. Strong Track Record of Returning Cash to Shareholders ~$5.9 billion returned from January 1, 2003 to March 31, 20191 7 Dividends1 • $4.3 billion since 2003 • ~28% of free cash flow in the last 15 years Share Buybacks1 • $1.6 billion since 2003 • ~10% of free cash flow in the last 15 years
- 8. Disciplined Approach to M&A 8 CdA Gold Stream1, $206M Project Corridor /Nueva Union, $0 Antamina Silver Stream2 $795M Osisko Royalty Package, $28M Sandstorm Royalty Package3 $32M HVC Minority, ($33M) Teena Minority4, ($11M) AQM Copper, ($25M) Wintering Hills, $59M San Nic Minority5, ($65M) IMSA’s stake in QB, ($208M) Waneta Dam, $1,200M QB2 Divestment (30%)6 $1,072M ($500) $0 $500 $1,000 $1,500 July10 Aug27 Oct7 Oct25 Jan19 July5 Oct18 Nov21 Jan26 Oct18 Apr4 Jul26 Mar29 2015 2016 2017 2018 2019 • Total net proceeds of C$3.1 billion • Balance sheet strengthened by divestment of non-core assets at high EBITDA7 multiples • Modest housekeeping acquisitions to consolidate control of attractive copper and zinc development assets Recent Transaction History (Net Proceeds (Cost) in C$M)
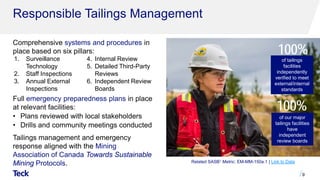
- 9. 1. Surveillance Technology 2. Staff Inspections 3. Annual External Inspections 4. Internal Review 5. Detailed Third-Party Reviews 6. Independent Review Boards Comprehensive systems and procedures in place based on six pillars: Full emergency preparedness plans in place at relevant facilities: • Plans reviewed with local stakeholders • Drills and community meetings conducted Tailings management and emergency response aligned with the Mining Association of Canada Towards Sustainable Mining Protocols. 9 Responsible Tailings Management 100% of tailings facilities independently verified to meet external/internal standards 100% of our major tailings facilities have independent review boards Related SASB1 Metric: EM-MM-150a.1 | Link to Data
- 10. Low Cost, Low Carbon Producer • Among world’s lowest GHG intensity for steelmaking coal and copper production • Fort Hills – one of the lowest carbon intensities among North American oil sands producers on a wells-to-wheels basis • Progressive carbon pricing already built into majority of business • Well-positioned for a low-carbon economy 10 GHG Emissions Intensity Ranges Among ICMM Members1 (kgCO2e per tonne of product) Teck in bottom quartile for miners Copper Coal
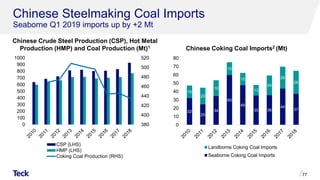
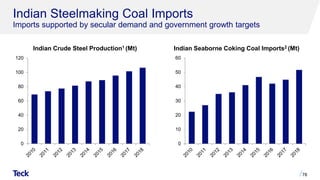
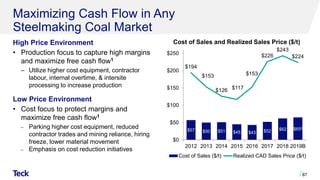
- 11. 50 100 150 200 250 300 Argus FOB Australia 12-Month Moving Average Steelmaking Coal Market Remains Tight • Market remains tight • Growing demand, especially in India and Southeast Asia • Capital markets are rationing capital to coal, which is directed at thermal coal but impacts steelmaking coal; will constrain supply and increase the value of existing assets • Supply disruptions continue, investment remains modest, permitting is challenging • Chinese safety checks restrict domestic production • Teck’s steelmaking coal sales to China declined from ~30% in 2013 to ~10% in 2018, and could be below 10% in 2019. In the same period, our sales to India increased from ~5% to ~15% 11 Steelmaking coal price averaged US$182/t, or US$200/t on an inflation-adjusted basis, from January 1, 20081 Declining Coal Price Volatility1 (US$/t)
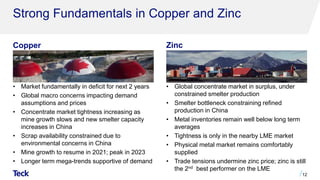
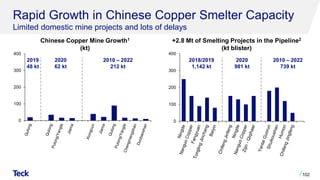
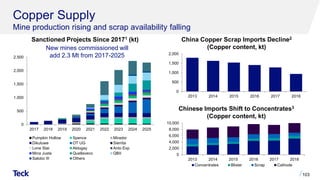
- 12. Strong Fundamentals in Copper and Zinc Copper Zinc • Market fundamentally in deficit for next 2 years • Global macro concerns impacting demand assumptions and prices • Concentrate market tightness increasing as mine growth slows and new smelter capacity increases in China • Scrap availability constrained due to environmental concerns in China • Mine growth to resume in 2021; peak in 2023 • Longer term mega-trends supportive of demand • Global concentrate market in surplus, under constrained smelter production • Smelter bottleneck constraining refined production in China • Metal inventories remain well below long term averages • Tightness is only in the nearby LME market • Physical metal market remains comfortably supplied • Trade tensions undermine zinc price; zinc is still the 2nd best performer on the LME 12
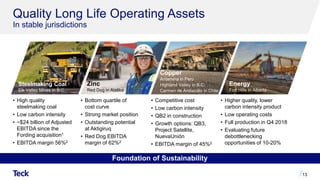
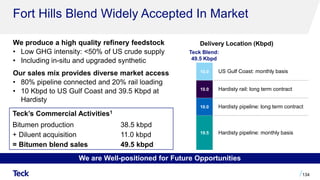
- 13. Quality Long Life Operating Assets In stable jurisdictions 13 Steelmaking Coal Elk Valley Mines in B.C. Zinc Red Dog in Alaska • High quality steelmaking coal • Low carbon intensity • ~$24 billion of Adjusted EBITDA since the Fording acquisition1 • EBITDA margin 56%2 • Bottom quartile of cost curve • Strong market position • Outstanding potential at Aktigiruq • Red Dog EBITDA margin of 62%2 Copper Antamina in Peru Highland Valley in B.C. Carmen de Andacollo in Chile • Competitive cost • Low carbon intensity • QB2 in construction • Growth options: QB3, Project Satellite, NuevaUnión • EBITDA margin of 45%2 Energy Fort Hills in Alberta • Higher quality, lower carbon intensity product • Low operating costs • Full production in Q4 2018 • Evaluating future debottlenecking opportunities of 10-20% Foundation of Sustainability
- 14. QB2 Value Creation Delivers on Copper Growth Strategy • Rebalances Teck's portfolio over time to make the contribution from copper similar to steelmaking coal • World class, low cost copper opportunity in an excellent geopolitical jurisdiction • First production in late 2021 when copper is expected to be in deficit • Vast, long life deposit with expansion potential (QB3) • Teck’s IRR is significant1 ‒ At US$3.00/lb copper, unlevered IRR is 19% and levered IRR is 30% ‒ At US$3.50/lb copper, unlevered IRR is 24% and levered IRR is 40% 14 Based on Sanction Case (Including 199 Mt Inferred Resources) Refer to “QB2 Project Economics Comparison” and “QB2 Reserves and Resources Comparison” slides for Reserve Case (Excluding Inferred Resources) The description of the QB2 project Sanction Case includes inferred resources that are considered too speculative geologically to have the economic considerations applied to them that would enable them to be categorized as mineral reserves. Inferred resources are subject to greater uncertainty than measured or indicated resources and it cannot be assumed that they will be successfully upgraded to measured and indicated through further drilling. Low Strip Ratio2 QB2 (0.7:1) Antamina (2.9:1)3 Collahuasi (3.4:1)3 Escondida (2.6:1)3
- 15. A Transformational Time for Teck 15 Future Value Catalysts Positioned For Cash Returns to Shareholders Project Satellite Value Creation Transformation Through Innovation Compelling Value Growth Through QB2/QB3 Execution
- 16. Appendix
- 17. Notes Slide 5: QB2 Project Finance Signed 1. On a go forward basis from January 1, 2019. 2. Assumes US$1.2 billion of Sumitomo contributions associated with purchase price spent before first draw of project finance facility. Thereafter, project finance facility used to fund all capital costs until target debt : capital ratio achieved on a cumulative basis, after which point project finance and equity contributions are made ratably based on this same debt : capital ratio. 3. On a 100% go forward basis from January 1, 2019 in constant Q2 2017 dollars and a CLP:USD exchange rate of 625, not including escalation (estimated at US$300 - $470 million based on 2 - 3% per annum inflation), working capital or interest during construction. Includes approximately US$500 million in contingency. At a spot CLP/USD rate of approximately 675 capital would be reduced by approximately US$270 million. Slide 6: Capital Allocation 1. Public notes outstanding as at March 31, 2019. 2. Returns to shareholders in 2019 is an estimate, including $0.20 per share in regular base annual dividends, the portion of the share buyback announced on November 15, 2018 that was completed between January 1, 2019 and April 26, 2019, and the full amount of the $600 million share buyback announced on May 30, 2019, and excluding any supplemental dividend and/or additional buyback that the Board may consider at the end of the year. Slide 7: Strong Track Record of Returning Cash to Shareholders 1. From January 1, 2003 to March 31, 2019. Free cash flow is a non-GAAP financial measure. See “Non-GAAP Financial Measures” slides. Slide 8: Disciplined Approach to M&A 1. Carmen de Andacollo gold stream transaction occurred in USD at US$162 million. 2. Antamina silver stream transaction occurred in USD at US$610 million. 3. Sandstorm royalty transaction occurred in USD at US$22 million. 4. Teena transaction occurred in AUD at A$10.6 million. 5. San Nicolàs transaction occurred in USD at US$50 million. 6. QB2 Partnership (sale of 30% interest of project to Sumitomo; SMM and SC) for total consideration of US$1.2 billion, including US$800 million earn-in and US$400 million matching contribution; converted at FX of 1.34 on March 29, 2019 7. EBITDA is a non-GAAP financial measure. See “Non-GAAP Financial Measures” slides. Slide 9: Responsible Tailings Management 1. Sustainability Accounting Standards Board Standards. https://www.sasb.org/ Slide 10: Low Cost, Low Carbon Producer 1. The cost of carbon pricing: competitiveness implications for the mining and metals industry. ICMM. Slide 11: Steelmaking Coal Market Remains Tight 1. Average steelmaking coal prices are calculated from January 1, 2008. Inflation-adjusted prices are based on the US Consumer Price Index. Source: Argus, FIS, Teck. Plotted to July 3, 2019. Slide 13: Quality Long Life Operating Assets 1. Adjusted EBTIDA generated from October 1, 2008 to March 31, 2019. This reflects the change in accounting policy to capitalize stripping from January 1, 2013. Waste rock stripping costs incurred in the production phase of a surface mine are recorded as capitalized production stripping costs within property, plant and equipment when it is probable that the stripping activity will improve access to the orebody when the component of the orebody or pit to which access has been improved can be identified, and when the costs relating to the stripping activity can be measured reliably. When the actual waste-to-ore stripping ratio in a period is greater than the expected life-of-component waste-to-ore stripping ratio for that component, the excess is recorded as capitalized production stripping costs. Adjusted EBITDA is a non-GAAP financial measure. See “Non-GAAP Financial Measures” slides. 2. Three months ended March 31, 2019. EBITDA margin is a non-GAAP financial measure. See “Non-GAAP Financial Measures” slides. Slide 14: QB2 Value Creation 1. As at January 1, 2019. Assumes optimized funding structure. Does not include contingent consideration. Assumes US$10.00/lb molybdenum and US$18.00/oz silver. 2. 1 truck = a strip ratio of 0.1. 3. Source: Wood Mackenzie over 2021-2040. 17
- 18. Quebrada Blanca
- 19. QB2 Project Disclosure All economic analysis with respect to the QB2 project based on a development case which includes inferred resources within the life of mine plan, referred to as the Sanction Case, which is the case on which Teck is basing its development decision for the QB2 project. Inferred resources are considered too speculative geologically to have the economic considerations applied to them that would enable them to be categorized as mineral reserves. Inferred resources are subject to greater uncertainty than measured or indicated resources and it cannot be assumed that they will be successfully upgraded to measured and indicated through further drilling. Nonetheless, based on the nature of the mineralization, Teck has used a mine plan including inferred resources as the development mine plan for the QB2 project. The economic analysis of the Sanction Case, which includes inferred resources, may be compared to economic analysis regarding a hypothetical mine plan which does not include the use of inferred resources as mill feed, referred to as the Reserve Case, and which is set out in Appendix slides “QB2 Project Economics Comparison” and “QB2 Reserves and Resources Comparison” and is further discussed in our Annual Information Form filed under our profile on SEDAR (www.sedar.com) and on EDGAR (www.sec.gov). The scientific and technical information regarding the QB2 project was prepared under the supervision of Rodrigo Marinho, P. Geo, who is an employee of Teck. Mr. Marinho is a qualified person, as defined under National Instrument 43-101. 19
- 20. QB2 Summary Benefits of Partnering Benefits of Sanctioning QB2 20 • Prudent approach to capital allocation - Choosing measured growth preserves ability to return further capital to shareholders and reduce outstanding bonds • Partnership and financing plan dramatically reduces Teck's QB2 capital requirements - Teck's share of remaining equity is approximately US$693 million before escalation1 - No contributions required from closing until late 20202 • Significantly enhances Teck's economics bringing after-tax levered IRR to 30-40%3 • Builds on already strong relationship with Sumitomo Metal Mining and Sumitomo Corporation • Rebalances Teck's portfolio over time making the contribution from copper similar to steelmaking coal • World class, low cost copper opportunity in an excellent geopolitical jurisdiction • First production in late 2021 when copper is expected to be in deficit • Vast, long life deposit with expansion potential (QB3) • Advanced stage of operational readiness incorporating leading technology and innovation to create a modern mine • Experienced team ready to execute together with industry leading EPCM partner in Bechtel
- 21. QB2 Transaction Terms 21 Upfront Consideration • Total contribution of US$1.2 billion into the QB2 project for a 30% interest - US$800 million earn-in contribution - US$400 million matching contribution Contingent Consideration1 • US$50 million to Teck on QB2 achieving mill throughput optimization target of 154 ktpd • 12% of the incremental QB3 expansion NPV upon sanction - 8% contingent earn-in contribution - 4% matching contribution Post-Transaction Project Ownership • 60% Teck / 30% Sumitomo / 10% ENAMI - 25% Sumitomo Metal Mining - 5% Sumitomo Corporation Capital Cost Funding • US$2.5 billion project financing • Remaining capital cost funded two-thirds by Teck, one-third by Sumitomo • ENAMI has 10% non-funding interest Closing • Transaction effective date January 1, 2019 • Closed March 29, 2019
- 22. QB2 Rebalances Teck’s Portfolio Delivers on copper growth strategy • Rebalances Teck's portfolio over time to make the contribution from copper similar to steelmaking coal • On a consolidated basis copper production is doubled • On an attributable basis copper production increases by ~60% • Based on expected long term prices for copper and steelmaking coal, increased copper production could reduce steelmaking coal to below 50% of EBITDA over time • QB3 and other copper development projects could further increase copper exposure and diversification 22 Based on Sanction Case (Including 199 Mt Inferred Resources) Refer to “QB2 Project Economics Comparison” and “QB2 Reserves and Resources Comparison” slides for Reserve Case (Excluding Inferred Resources) The description of the QB2 project Sanction Case includes inferred resources that are considered too speculative geologically to have the economic considerations applied to them that would enable them to be categorized as mineral reserves. Inferred resources are subject to greater uncertainty than measured or indicated resources and it cannot be assumed that they will be successfully upgraded to measured and indicated through further drilling. 294 174 116 2018A Pro Forma QB2 Consolidated (100%) QB2 Attrib. (60%) Teck 2018A 2 Teck's Annual Copper Production (kt Cu) 290 kt2 1 2941 584
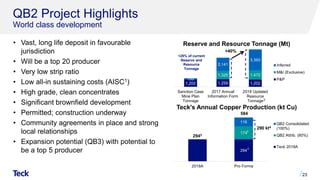
- 23. QB2 Project Highlights World class development • Vast, long life deposit in favourable jurisdiction • Will be a top 20 producer • Very low strip ratio • Low all-in sustaining costs (AISC1) • High grade, clean concentrates • Significant brownfield development • Permitted; construction underway • Community agreements in place and strong local relationships • Expansion potential (QB3) with potential to be a top 5 producer 23 Reserve and Resource Tonnage (Mt) Teck's Annual Copper Production (kt Cu) 1,202 1,259 1,202 1,325 1,472 199 2,141 3,393 Sanction Case Mine Plan Tonnage 2017 Annual Information Form 2018 Updated Resource Tonnage Inferred M&I (Exclusive) P&P <25% of current Reserve and Resource Tonnage 2 +40% 294 174 116 2018A Pro Forma QB2 Consolidated (100%) QB2 Attrib. (60%) Teck 2018A 5 290 kt4 4 2943 584
- 24. QB2 is a World Class Copper Opportunity 24 Based on Sanction Case (Including 199 Mt Inferred Resources) Refer to “QB2 Project Economics Comparison” and “QB2 Reserves and Resources Comparison” slides for Reserve Case (Excluding Inferred Resources) The description of the QB2 project Sanction Case includes inferred resources that are considered too speculative geologically to have the economic considerations applied to them that would enable them to be categorized as mineral reserves. Inferred resources are subject to greater uncertainty than measured or indicated resources and it cannot be assumed that they will be successfully upgraded to measured and indicated through further drilling. Project Metrics1 (100%) US$2.4-$4.2B After-Tax NPV8% 2,3 14%-18% Unlevered After-Tax IRR2,3 US$1.1-$1.4B First 5 Full Years Annual EBITDA2 316 kt First 5 Full Years Annual CuEq Production4 US$1.28/lb First 5 Full Years C1 Cash Cost (net of by-products)5 US$1.38/lb First 5 Full Years AISC (net of by-products)6 QB2 Uses <25% of R&R Continuing to Grow US$4.7B Capital Cost (100%)7 Transaction Metrics1 ~US$3B Implied Value of Teck's 90% Ownership Prior to Sumitomo Transaction8 30%-40% Teck's Levered After-Tax IRR Post Transaction2,3,9
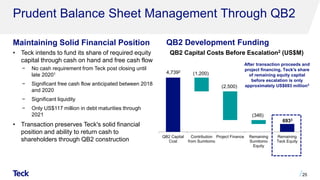
- 25. Prudent Balance Sheet Management Through QB2 Maintaining Solid Financial Position QB2 Development Funding • Teck intends to fund its share of required equity capital through cash on hand and free cash flow − No cash requirement from Teck post closing until late 20201 − Significant free cash flow anticipated between 2018 and 2020 − Significant liquidity − Only US$117 million in debt maturities through 2021 • Transaction preserves Teck's solid financial position and ability to return cash to shareholders through QB2 construction 25 QB2 Capital Costs Before Escalation2 (US$M) After transaction proceeds and project financing, Teck's share of remaining equity capital before escalation is only approximately US$693 million3 QB2 Capital Cost Contribution from Sumitomo Project Finance Remaining Sumitomo Equity Remaining Teck Equity 4,7392 (1,200) (2,500) (346) 6933
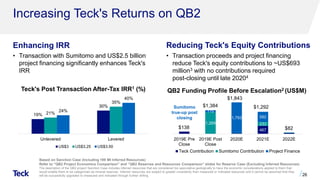
- 26. Increasing Teck's Returns on QB2 Enhancing IRR Reducing Teck's Equity Contributions 26 Based on Sanction Case (Including 199 Mt Inferred Resources) Refer to “QB2 Project Economics Comparison” and “QB2 Reserves and Resources Comparison” slides for Reserve Case (Excluding Inferred Resources) The description of the QB2 project Sanction Case includes inferred resources that are considered too speculative geologically to have the economic considerations applied to them that would enable them to be categorized as mineral reserves. Inferred resources are subject to greater uncertainty than measured or indicated resources and it cannot be assumed that they will be successfully upgraded to measured and indicated through further drilling. Teck's Post Transaction After-Tax IRR1 (%) 19% 30% 21% 35% 24% 40% Unlevered Levered US$3 US$3.25 US$3.50 • Transaction with Sumitomo and US$2.5 billion project financing significantly enhances Teck's IRR • Transaction proceeds and project financing reduce Teck's equity contributions to ~US$693 million3 with no contributions required post-closing until late 20204 467 1,269 233 115 1,793 592 2019E Pre Close 2019E Post Close 2020E 2021E 2022E Teck Contribution Sumitomo Contribution Project Finance QB2 Funding Profile Before Escalation2 (US$M) Sumitomo true-up post closing $138 $1,384 $1,843 $1,292 $82
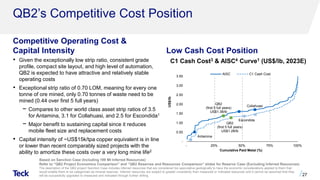
- 27. QB2’s Competitive Cost Position Competitive Operating Cost & Capital Intensity Low Cash Cost Position 27 Based on Sanction Case (Including 199 Mt Inferred Resources) Refer to “QB2 Project Economics Comparison” and “QB2 Reserves and Resources Comparison” slides for Reserve Case (Excluding Inferred Resources) The description of the QB2 project Sanction Case includes inferred resources that are considered too speculative geologically to have the economic considerations applied to them that would enable them to be categorized as mineral reserves. Inferred resources are subject to greater uncertainty than measured or indicated resources and it cannot be assumed that they will be successfully upgraded to measured and indicated through further drilling. C1 Cash Cost3 & AISC4 Curve1 (US$/lb, 2023E)• Given the exceptionally low strip ratio, consistent grade profile, compact site layout, and high level of automation, QB2 is expected to have attractive and relatively stable operating costs • Exceptional strip ratio of 0.70 LOM, meaning for every one tonne of ore mined, only 0.70 tonnes of waste need to be mined (0.44 over first 5 full years) − Compares to other world class asset strip ratios of 3.5 for Antamina, 3.1 for Collahuasi, and 2.5 for Escondida1 − Major benefit to sustaining capital since it reduces mobile fleet size and replacement costs • Capital intensity of ~US$15k/tpa copper equivalent is in line or lower than recent comparably sized projects with the ability to amortize these costs over a very long mine life2 Antamina Escondida Collahuasi - 0.50 1.00 1.50 2.00 2.50 3.00 3.50 - 25% 50% 75% 100% US$/lb Cumulative Paid Metal (%) AISC C1 Cash Cost QB2 (first 5 full years) US$1.38/lb QB2 (first 5 full years) US$1.28/lb
- 28. Vast, Long Life Deposit at QB QB2 Uses Less than 25% of R&R Extension Potential • Resource exclusive of Reserve increased 40% since 2017 • Initial 28 year mine life processes <25% of the currently defined Reserve and Resource Tonnage • Deposit is capable of supporting a very long mine life based on throughput rate of 143 ktpd by utilizing further tailings capacity at already identified sites • Actively evaluating potential options to exploit value of full resource through mill expansion and / or mine life extension • Beyond the extensive upside included in the defined QB deposit, the district geology is highly prospective for exploration discovery and resource addition − Mineralization is open in multiple directions with drilling ongoing 28. 1,202 1,259 1,202 1,325 1,472 199 2,141 3,393 Sanction Case Mine Plan Tonnage 2017 Annual Information Form 2018 Updated Resource Tonnage Inferred M&I (Exclusive) P&P 1 +40% Reserve and Resource Tonnage (Mt) <25% of current Reserve and Resource Tonnage
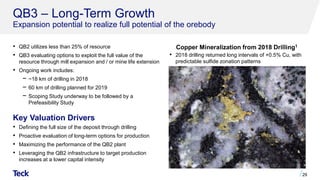
- 29. QB3 – Long-Term Growth Expansion potential to realize full potential of the orebody • QB2 utilizes less than 25% of resource • QB3 evaluating options to exploit the full value of the resource through mill expansion and / or mine life extension • Ongoing work includes: − ~18 km of drilling in 2018 − 60 km of drilling planned for 2019 − Scoping Study underway to be followed by a Prefeasibility Study 29. • 2018 drilling returned long intervals of +0.5% Cu, with predictable sulfide zonation patterns Key Valuation Drivers • Defining the full size of the deposit through drilling • Proactive evaluation of long-term options for production • Maximizing the performance of the QB2 plant • Leveraging the QB2 infrastructure to target production increases at a lower capital intensity Copper Mineralization from 2018 Drilling1
- 30. Clear Path to Production at QB2 Construction Approach Operational Readiness • Key project elements are segregated by area and can be managed more efficiently reducing risk: – Open pit mine (120 Mtpa peak); – Concentrator (143 ktpd); – Tailings storage facility (1.4 Bt capacity); – Concentrate and water supply pipelines (165 km); and – Port facility (including a desalination plant and concentrate filtration plant) • QB will own and operate its pipelines and port facilities 30 • Early focus on operational readiness and commissioning to ensure a seamless transition to operations • Organizational design incorporating Integrated Operations and Business Partner Model – Driving value by linking process, people and workplace design • Engagement of experienced consultants to support detailed plan development and execution, integrated operations design and systems, and commissioning planning Port and Desalination Power Pipelines TMF Mill Mine Water Pipeline Concentrate Pipeline Power Line Roads
- 31. Execution Readiness at QB2 Experienced project team including Bechtel, a leading EPCM company 31 Name Title Years of Experience Major Project Experience Karl Hroza Project Director 25+ Sturgeon Refinery, El Morro, Koniambo, Fort Hills, Ravensthorpe Sergio Vives Director, Environment and Permitting 20+ Pascua Lama, Los Pelambres, Chuquicamata and Codelco Smelting Grant McLaren Site Manager 35+ Escondida (Phase IV, North satellite), Cerrejon P40 Expansion, Olympic Dam Carlos Opazo Concentrator Manager 25+ Fort Hills, Carmen de Andacollo, Los Pelambres, El Abra, Escondida, Chuquicamata, CAP Iron Ore, MCC, Millennium Coker Unit – U and O Francisco Raynaud Port Area Manager 25+ Escondida, To-2 – Codelco Andrés Corbalan Engineering Manager 25+ El Abra, Los Pelambres Dale Webb Operations Readiness General Manager 20+ QB1, Trail Operations Name Title Years of Experience Major Project Experience Jim McCloud Project Manager 25+ El Abra, Radomiro Tomic, Collahuasi, Escondida (EWS), Los Pelambres, Yanacocha, Antamina, Antapaccay Carlos Ruiz Deputy Project Manager 25+ Escondida (EWS, OGP1, OLAP, Laguna Seca Debottlenecking), Los Bronces Sergio Baldini Senior Site Manager 20+ Escondida (EWS, OGP1), Antapaccay Eduardo Rochna Project Controls Manager 18+ Los Pelambres Repower I and II projects, Antapaccay Jorge Kettlun Contracts Manager 25+ Escondida (EWS, OGP1), Los Bronces, Los Pelambres Repower II projects Edgar Gomez Engineering Manager 25+ Escondida (OGP1), Andina Development Project (PDA) Phase I, Codelco PTMP, Los Pelambres Repower I, Collahuasi Ujina Rosario, Antamina, Goro Nickel Teck Owner's Team Bechtel Management Team
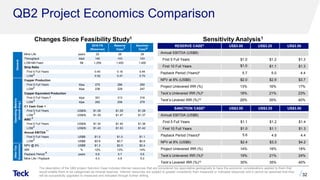
- 32. QB2 Project Economics Comparison 32 The description of the QB2 project Sanction Case includes inferred resources that are considered too speculative geologically to have the economic considerations applied to them that would enable them to be categorized as mineral reserves. Inferred resources are subject to greater uncertainty than measured or indicated resources and it cannot be assumed that they will be successfully upgraded to measured and indicated through further drilling. Mine Life years 25 28 28 Throughput ktpd 140 143 143 LOM Mill Feed Mt 1,259 1,400 1,400 Strip Ratio First 5 Full Years 0.40 0.16 0.44 LOM 0.52 0.41 0.70 Copper Production First 5 Full Years ktpa 275 286 290 LOM ktpa 238 228 247 Copper Equivalent Production First 5 Full Years ktpa 301 313 316 LOM ktpa 262 256 279 C1 Cash Cost First 5 Full Years US$/lb $1.28 $1.29 $1.28 LOM US$/lb $1.39 $1.47 $1.37 AISC First 5 Full Years US$/lb $1.34 $1.40 $1.38 LOM US$/lb $1.43 $1.53 $1.42 Annual EBITDA First 5 Full Years US$B $1.0 $1.0 $1.1 LOM US$B $0.8 $0.7 $0.9 NPV @ 8% US$B $1.3 $2.0 $2.4 IRR % 12% 13% 14% Payback Period years 5.8 5.7 5.6 Mine Life / Payback 4.3 4.9 5.0 Sanction Case Reserve Case 2016 FS (Reserves) After-Tax Economics General OperatingMetrics (AnnualAvg.) 4 6 5 2 2 2 2 2 7 8 3 2 11 Sensitivity Analysis1Changes Since Feasibility Study1 RESERVE CASE8 US$3.00 US$3.25 US$3.50 Annual EBITDA (US$B) First 5 Full Years $1.0 $1.2 $1.3 First 10 Full Years $1.0 $1.1 $1.3 Payback Period (Years)6 5.7 5.0 4.4 NPV at 8% (US$B) $2.0 $2.9 $3.7 Project Unlevered IRR (%) 13% 16% 17% Teck’s Unlevered IRR (%)9 18% 21% 23% Teck’s Levered IRR (%)10 29% 35% 40% SANCTION CASE8 US$3.00 US$3.25 US$3.50 Annual EBITDA (US$B) First 5 Full Years $1.1 $1.2 $1.4 First 10 Full Years $1.0 $1.1 $1.3 Payback Period (Years)6 5.6 4.9 4.4 NPV at 8% (US$B) $2.4 $3.3 $4.2 Project Unlevered IRR (%) 14% 16% 18% Teck’s Unlevered IRR (%)9 19% 21% 24% Teck’s Levered IRR (%)10 30% 35% 40%
- 33. QB2 Reserves and Resources Comparison Reserve Case (as at Nov. 30, 2018)1,2 Sanction Case (as at Nov. 30, 2018)2,4 33 RESERVES Mt Cu Grade % Mo Grade % Silver Grade ppm Proven 409 0.54 0.019 1.47 Probable 793 0.51 0.021 1.34 Reserves 1,202 0.52 0.020 1.38 RESOURCES (EXCLUSIVE OF RESERVES) Mt Cu Grade % Mo Grade % Silver Grade ppm Measured 36 0.42 0.014 1.23 Indicated 1,436 0.40 0.016 1.13 M&I (Exclusive) 1,472 0.40 0.016 1.14 Inferred 3,194 0.37 0.017 1.13 + Inferred in SC pit 199 0.53 0.022 1.21 RESERVES Mt Cu Grade % Mo Grade % Silver Grade ppm Proven 476 0.51 0.018 1.40 Probable 924 0.47 0.019 1.25 Reserves 1,400 0.48 0.018 1.30 RESOURCES (EXCLUSIVE OF RESERVES) Mt Cu Grade % Mo Grade % Silver Grade ppm Measured 36 0.42 0.014 1.23 Indicated 1,558 0.40 0.016 1.14 M&I (Exclusive) 1,594 0.40 0.016 1.14 Inferred 3,125 0.38 0.018 1.15
- 34. ENAMI Interest in QB Organizational Chart • The government of Chile owns a 10% non-funding interest in Compañía Minera Teck Quebrada Blanca S.A. (CMTQB) through its state-run minerals company, Empresa Nacional de Minería (ENAMI) • ENAMI has been a partner at QB since 1989 and is a 10% shareholder of Carmen de Andacollo • ENAMI is not required to fund QB2 development costs • Project equity funding in form of: - 25% Series A Shares - 75% Shareholder Loans • Until shareholder loans are fully repaid, ENAMI is entitled to a minimum dividend, based on net income, that approximates 2.0-2.5% of free cash flow - Thereafter, ENAMI receives 10% of dividends / free cash flow • ENAMI is entitled to board representation 34. CMTQB TRCL ENAMI Teck 10% (Series B) 100% 90% (Series A) JVCo SMM 66.67% 100% 33.33% SC 83.33% 16.67% Chile HoldCo QB1 / QB2 / QB3
- 35. Quebrada Blanca Accounting Treatment Balance Sheet Cash Flow • 100% of project spending included in property, plant and equipment • Debt includes 100% of project financing • Total shareholder funding to be split between loans and equity approximately 75%/25% over the life of the project • Sumitomo (SMM/SC)1 contributions will be shown as advances as a non-current liability and non-controlling interest as part of equity • Teck contributions, whether debt or equity eliminated on consolidation • 100% of project spending included in capital expenditures • In 2019, Sumitomo1 contribution will recorded within financing activities and split approximately 50%/50% as: ‒ Loans recorded as “Advances from Sumitomo” ‒ Equity recorded as “Sumitomo Share Subscriptions” • 100% of draws on project financing included in financing activities • After start-up of operations ‒ 100% of profit in cash flow from operations ‒ Sumitomo’s1 30% and ENAMI’s 10% share of distributions included in non-controlling interest 35 Income Statement • Teck’s income statement will include 100% of QB’s revenues and expenses • Sumitomo’s1 30% and ENAMI’s 10% share of profit will show as profit attributable to non-controlling interests
- 36. Notes - Appendix: Quebrada Blanca Slide 20: QB2 Summary 1. On a go forward basis from January 1, 2019. Based on remaining capital costs of US$4.739 billion after project financing and US$1.2 billion contribution from Sumitomo, in constant Q2 2017 dollars, assuming a CLP:USD exchange rate of 625, not including escalation (estimated at US$300 - $470 million based on 2 - 3% per annum inflation), working capital or interest during construction, but including approximately US$500 million in contingency. 2. Assumes US$1.2 billion of Sumitomo contributions associated with purchase price spent before first draw of project finance facility. Thereafter, project finance facility used to fund all capital costs until target debt : capital ratio achieved on a cumulative basis, after which point project finance and equity contributions are made ratably based on this same debt : capital ratio. 3. Range based on US$3.00-$3.50/lb copper price. Assumes US$10.00/lb molybdenum and US$18.00/oz silver. As at January 1, 2019. Does not include contingent consideration. Slide 21: QB2 Transaction Terms 1. Sumitomo has agreed to make a supplemental payment to Teck of US$50 million if QB2 project throughput reaches 154,000 tonnes per day prior to the earlier of the sanctioning of a major expansion or December 31, 2025. Expansion contingent consideration is payable if project expansion sanction occurs before December 31, 2031 and Sumitomo elects to participate. If Sumitomo elects not to participate in the expansion, its interest in the joint venture will be diluted on a basis that effectively gives Teck 100% of the value of the expansion. Both these supplemental payments are subject to downward adjustment in the event that QB2 mill throughput and copper recoveries do not meet certain targets. Slide 22: QB2 Rebalances Teck’s Portfolio 1. We include 100% of the production and sales from QB and Carmen de Andacollo mines in our production and sales volumes because we fully consolidate their results in our financial statements. We include 22.5% of production and sales from Antamina, representing our proportionate equity interest in Antamina. Copper production includes cathode production at QB. 2. Based on QB2 Sanction Case first five full years of copper production. Slide 23: QB2 Project Highlights 1. All-in sustaining costs (AISC) are calculated as C1 cash costs after by-product credits plus sustaining capital requirements. C1 cash costs are calculated after by-product credits assuming US$10.00/lb molybdenum and US$18.00/oz silver. Net cash unit costs are consistent with C1 cash costs. C1 cash costs for QB2 include stripping costs during operations. Net cash unit cost, C1 cash cost and AISC are non-GAAP financial measures. See “Non-GAAP Financial Measures” slides. 2. Resources figures as at November 30, 2018. Resources are reported separately from, and do not include that portion of resources classified as reserves. See “QB2 Reserves and Resources Comparison” slide for further details. 3. We include 100% of the production and sales from QB and Carmen de Andacollo mines in our production and sales volumes because we fully consolidate their results in our financial statements. We include 22.5% of production and sales from Antamina, representing our proportionate equity interest in Antamina. Copper production includes cathode production at QB. 4. Based on QB2 Sanction Case first five full years of copper production. Slide 24: QB2 is a World Class Copper Opportunity 1. Unless otherwise stated, all metrics assume US$3.00/lb copper, US$10.00/lb molybdenum and US$18.00/oz silver. 2. Range based on US$3.00-$3.50/lb copper price. EBITDA is a non-GAAP financial measure. See “Non-GAAP Financial Measures” slides. 3. As at January 1, 2019. Assumes optimized funding structure. 4. Copper equivalent production calculated assuming US$3.00/lb copper, US$10.00/lb molybdenum and US$18.00/oz silver without adjusting for payability. 5. C1 cash costs are presented after by-product credits assuming US$10.00/lb molybdenum and US$18.00/oz silver. Net cash unit costs are consistent with C1 cash costs. C1 cash costs for QB2 include stripping costs during operations. Net cash unit costs and C1 cash costs are non-GAAP financial measures. See “Non-GAAP Financial Measures” slides. 6. All-in sustaining costs (AISC) are calculated as C1 cash costs after by-product credits plus sustaining capital requirements. C1 cash costs are described above. AISC is a non-GAAP financial measure. See “Non-GAAP Financial Measures” slides. 7. On a 100% go forward basis from January 1, 2019 in constant Q2 2017 dollars and a CLP:USD exchange rate of 625, not including escalation (estimated at US$300 - $470 million based on 2 - 3% per annum inflation), working capital or interest during construction. Includes approximately US$500 million in contingency. At a spot CLP/USD rate of approximately 675 capital would be reduced by approximately US$270 million. 8. The valuation of approximately ~US$3 billion for Teck’s 90% interest prior to the Sumitomo transaction is based on a transaction value of US$1 billion comprising an earn-in contribution of US$800 million and assumed contingent consideration proceeds with a present value of approximately US$200 million. The undiscounted contingent consideration is estimated at US$300 million and comprises: (a) US$50 million relating to achieving the mill throughput optimization target as described in Note 1 on the “QB2 Transaction Terms” slide, assumed to be received in 2024; and (b) 8% of the net present value of the QB3 expansion at sanction, assuming an expansion sanctioned in 2024 which doubles QB2 throughput with further tailings facility construction deferred. At a real copper price of US$3.00/lb, the payment is estimated at approximately US$250 million. Using a real discount rate of 8%, the present value of the contingent consideration, based on the above assumptions is estimated at approximately US$200 million. This estimate is based on a number of significant assumptions in addition to those described above. There can be no assurance that the contingent consideration will approximate the amounts outlined above, or that it will be received at all. 9. Does not include contingent consideration. 36
- 37. Notes - Appendix: Quebrada Blanca Slide 25: Prudent Balance Sheet Management Through QB2 1. Assumes US$1.2 billion of Sumitomo contributions associated with purchase price spent before first draw of project finance facility. Thereafter, project finance facility used to fund all capital costs until target debt : capital ratio achieved on a cumulative basis, after which point project finance and equity contributions are made ratably based on this same debt : capital ratio. 2. On a 100% go forward basis from January 1, 2019 in constant Q2 2017 dollars and a CLP:USD exchange rate of 625, not including escalation (estimated at US$300 - $470 million based on 2 - 3% per annum inflation), working capital or interest during construction. Includes approximately US$500 million in contingency. At a spot CLP/USD rate of approximately 675 capital would be reduced by approximately US$270 million 3. On a go forward basis from January 1, 2019. Slide 26: Increasing Teck's Returns on QB2 1. As at January 1, 2019. Assumes optimized funding structure. Does not include contingent consideration. Assumes US$10.00/lb molybdenum and US$18.00/oz silver. 2. On a 100% go forward basis from January 1, 2019 in constant Q2 2017 dollars and a CLP:USD exchange rate of 625, not including escalation (estimated at US$300 - $470 million based on 2 - 3% per annum inflation), working capital or interest during construction. Includes approximately US$500 million in contingency. At a spot CLP/USD rate of approximately 675 capital would be reduced by approximately US$270 million. 3. On a go forward basis from January 1, 2019. 4. Assumes US$1.2 billion of Sumitomo contributions associated with purchase price spent before first draw of project finance facility. Thereafter, project finance facility used to fund all capital costs until target debt : capital ratio achieved on a cumulative basis, after which point project finance and equity contributions are made ratably based on this same debt : capital ratio. Slide 27: QB2’s Competitive Cost Position 1. Source: Wood Mackenzie. 2. Based on first five full years of copper equivalent production. Copper equivalent production calculated assuming US$3.00/lb copper, US$10.00/lb molybdenum and US$18.00/oz silver without adjusting for payability. 3. C1 cash costs are presented after by-product credits assuming US$10.00/lb molybdenum and US$18.00/oz silver. Net cash unit costs are consistent with C1 cash costs. C1 cash costs for QB2 include stripping costs during operations. Net cash unit costs and C1 cash costs are non-GAAP financial measures. See “Non-GAAP Financial Measures” slides. 4. All-in sustaining costs (AISC) are calculated as C1 cash costs after by-product credits plus sustaining capital requirements. C1 cash costs are described above. AISC is a non-GAAP financial measure. See “Non-GAAP Financial Measures” slides. Slide 28: Vast, Long Life Deposit at QB 1. Resources figures as at November 30, 2018. Resources are reported separately from, and do not include that portion of resources classified as reserves. See “QB2 Reserves and Resources Comparison” slide for further details. Slide 29: QB3 – Long-Term Growth 1. DDH-756 @176.6m, Field of view 2cm. Slide 32: QB2 Project Economics Comparison 1. All metrics on 100% basis and assume US$3.00/lb copper, US$10.00/lb molybdenum and US$18.00/oz silver unless otherwise stated. NPV, IRR and payback on after-tax basis. 2. Life of Mine annual average figures exclude the first and last partial years of operations. 3. Copper equivalent production calculated assuming US$3.00/lb copper, US$10.00/lb molybdenum and US$18.00/oz silver without adjusting for payability. 4. C1 cash costs are presented after by-product credits assuming US$10.00/lb molybdenum and US$18.00/oz silver. Net cash unit costs are consistent with C1 cash costs. C1 cash costs for QB2 include stripping costs during operations. Net cash unit costs and C1 cash costs are non-GAAP financial measures. See “Non-GAAP Financial Measures” slides. 5. All-in sustaining costs (AISC) are calculated as C1 cash costs after by-product credits plus sustaining capital requirements. C1 cash costs are described above. AISC is a non-GAAP financial measure. See “Non-GAAP Financial Measures” slides. 6. Payback from first production. 7. Based on go-forward cash flow from January 1, 2017. Based on all equity funding structure. 8. Based on go-forward cash flow from January 1, 2019. Based on optimized funding structure. 9. Does not consider contingent consideration. 10. Includes impact of US$2.5 billion project financing. Does not consider contingent consideration. 11. EBITDA is a non-GAAP financial measure. See “Non-GAAP Financial Measures” slides. 37
- 38. Notes - Appendix: Quebrada Blanca Slide 33: QB2 Reserves and Resources Comparison 1. Mineral reserves are constrained within an optimized pit shell and scheduled using a variable grade cut-off approach based on NSR cut-off US$13.39/t over the planned life of mine. The life-of-mine strip ratio is 0.41. 2. Both mineral resource and mineral reserve estimates assume long-term commodity prices of US$3.00/lb Cu, US$9.40/lb Mo and US$18.00/oz Ag and other assumptions that include: pit slope angles of 30–44º, variable metallurgical recoveries that average approximately 91% for Cu and 74% for Mo and operational costs supported by the Feasibility Study as revised and updated. 3. Mineral resources are reported using a NSR cut-off of US$11.00/t and include 23.8 million tonnes of hypogene material grading 0.54% copper that has been mined and stockpiled during existing supergene operations. 4. Mineral reserves are constrained within an optimized pit shell and scheduled using a variable grade cut-off approach based on NSR cut-off US$18.95/t over the planned life of mine. The life-of-mine strip ratio is 0.70. 5. Mineral resources are reported using a NSR cut-off of US$11.00/t outside of the reserves pit. Mineral resources include inferred resources within the reserves pit at a US$ 18.95/t NSR cut-off and also include 23.8 million tonnes of hypogene material grading 0.54% copper that has been mined and stockpiled during existing supergene operations. Slide 35: Quebrada Blanca Accounting Treatment 1. Sumitomo Metal Mining Co. Ltd. and Sumitomo Corporation are collectively referred to as Sumitomo. 38
- 40. Consistent Long-Term Strategy 40 • Diversification • Long life assets • Low cost • Appropriate scale • Low risk jurisdictions
- 41. Attractive Portfolio of Long-Life Assets Low risk jurisdictions 41
- 42. Global Customer Base Revenue contribution from diverse markets (2018) 42
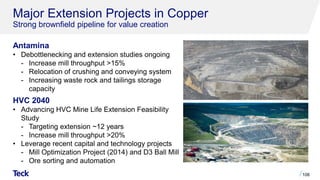
- 43. Diverse Pipeline of Growth Options 43 In Construction Energy Building a new business through partnership Frontier Lease 421 Future OptionsMedium-Term Growth Options Zinc Premier resource with integrated assets Red Dog Satellite Deposits Cirque Red Dog VIP2 Project Teena Coal Well established with capital efficient value options Elk Valley Replacement Brownfield Quintette/Mt. Duke Elk Valley Brownfield Neptune Terminals Expansion Coal Mountain 2 Copper Strong platform with substantial growth options San Nicolás (Cu-Zn) QB2 Zafranal Mesaba NuevaUnión HVC Brownfield Schaft Creek Antamina Brownfield Galore Creek HVC D3 Project Fort Hills Debottlenecking & Expansion QB3
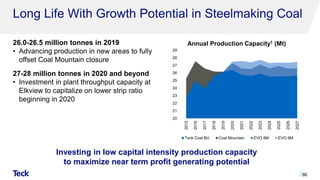
- 44. Production Guidance 44 2018 RESULTS 2019 GUIDANCE1 3 YEAR (2020-2022) GUIDANCE1 Steelmaking Coal 26.2 Mt 26.0-26.5 Mt 26.5-27.5 Mt Copper2,3,4,6 Highland Valley Concentrate 100.8 kt 115-120 kt 135-155 kt Antamina Concentrate 100.4 kt 95-100 kt 90-95 kt Carmen de Andecollo Concentrate + Cathode 67.2 kt 62-67 kt 60 kt Quebrada Blanca Cathode 25.5 kt 20-23 kt - Total Copper Concentrate + Cathode 293.9 kt 290-310 kt 285-305 kt Zinc2,3,5 Red Dog Concentrate 583.2 kt 535-555 kt 500-520 kt Antamina Concentrate 92.1 kt 65-70 kt 100-110 kt Pend Oreille Concentrate 29.7 kt 20-30 kt - Total Zinc Concentrate 705 kt 620-650 kt 600-630 kt Refined Zinc - Trail Refined 302.9 kt 305-310 kt 310-315 kt Bitumen - Fort Hills3,7,8 6.8 Mbbl 12-14 Mbbl 14 Mbbl Lead - Red Dog2 Concentrate 98.4 kt 85-90 kt 85-100 kt Refined Lead - Trail Refined 61 kt 70-75 kt 85-95 kt Molybdenum2,3 Highland Valley Concentrate 8.7 Mlbs 6.0 Mlbs 4.0-5.0 Mlbs Antamina Concentrate 2.3 Mlbs 2.0 Mlbs 2.0-3.0 Mlbs Total Molybdenum Concentrate 11.0 Mlbs 8.0 Mlbs 6.0-8.0 Mlbs Refined Silver - Trail Refined 11.6 Moz 13-14 Moz -
- 45. Sales and Unit Cost Guidance 45 2018 RESULTS 2019 GUIDANCE1 Steelmaking Coal Adjusted site cost of sales2 C$62/t C$62-65/t Transportation costs2 C$37/t C$37-39/t Unit costs2 C$99/t C$99-104/t Copper Total cash unit costs3 US$1.74/lb US$1.70-1.80/lb Net cash unit costs3 US$1.23/lb US$1.45-1.55/lb Zinc Total cash unit costs4 US$0.49/lb US$0.50-0.55/lb Net cash unit costs4 US$0.31/lb US$0.35-0.40/lb Bitumen Adjusted operating costs5 C$32.89/bbl C$26-29/bbl Unit Costs Sales Q1 2019 RESULTS Q2 2019 GUIDANCE1 Steelmaking Coal 6.2 Mt 6.4-6.6 Mt Zinc - Red Dog Zinc in Concentrate 131 kt 80-85 kt
- 46. QB2 Capital Cost Contribution from Sumitomo Project Finance Remaining Sumitomo Equity Remaining Teck Equity 4,7395 (1,200)4 (2,500) (346) 6936 Capital Expenditures Guidance 46 (TECK’S SHARE IN CAD$ MILLIONS) 2018 2019 GUIDANCE1 QB2 Capital Expenditures $ 414 $ 1,930 Total capex, before SMM/SC contribution $ 1,906 $ 3,775 Estimated SMM/SC contributions4 - (1,585) Total Teck spend $ 1,906 $ 2,190 QB2 Capital Costs Before Escalation5 (US$M) Quebrada Blanca 2 (TECK’S SHARE IN CAD$ MILLIONS) 2018 2019 GUIDANCE1 Sustaining Steelmaking coal2 $ 232 $ 540 Copper 157 240 Zinc 225 170 Energy 21 60 Corporate 10 5 $ 645 $ 1,015 Major Enhancement Steelmaking coal2 $ 230 $ 410 Copper 62 70 Zinc 107 60 Energy 69 100 $ 468 $ 640 New Mine Development Copper3 $ 56 $ 130 Zinc 38 30 Energy 285 30 $ 379 $ 190 Sub-total Steelmaking coal2 $ 462 $ 950 Copper3 275 440 Zinc 370 260 Energy 375 190 Corporate 10 5 $ 1,492 $ 1,845 (TECK’S SHARE IN CAD$ MILLIONS) 2018 2019 GUIDANCE1 Capitalized Stripping Steelmaking coal $ 507 $ 410 Copper 161 175 Zinc 39 45 $ 707 $ 630 Capitalized Stripping Sustaining, Major Enhancement, New Mine Development
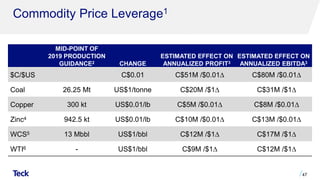
- 47. Commodity Price Leverage1 47 MID-POINT OF 2019 PRODUCTION GUIDANCE2 CHANGE ESTIMATED EFFECT ON ANNUALIZED PROFIT3 ESTIMATED EFFECT ON ANNUALIZED EBITDA3 $C/$US C$0.01 C$51M /$0.01∆ C$80M /$0.01∆ Coal 26.25 Mt US$1/tonne C$20M /$1∆ C$31M /$1∆ Copper 300 kt US$0.01/lb C$5M /$0.01∆ C$8M /$0.01∆ Zinc4 942.5 kt US$0.01/lb C$10M /$0.01∆ C$13M /$0.01∆ WCS5 13 Mbbl US$1/bbl C$12M /$1∆ C$17M /$1∆ WTI6 - US$1/bbl C$9M /$1∆ C$12M /$1∆
- 48. Tax-Efficient Earnings in Canada ~C$3.8 billion in available tax pools1 • Includes: ‒ $2.9 billion in net operating loss carryforwards ‒ $0.7 billion in Canadian Development Expenses (30% declining balance p.a.) ‒ $0.2 billion in allowable capital loss carryforwards • Applies to cash income taxes in Canada • Does not apply to: ‒ Resource taxes in Canada ‒ Cash taxes in foreign jurisdictions 48
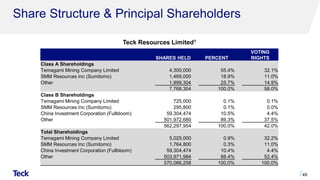
- 49. Share Structure & Principal Shareholders 49 SHARES HELD PERCENT VOTING RIGHTS Class A Shareholdings Temagami Mining Company Limited 4,300,000 55.4% 32.1% SMM Resources Inc (Sumitomo) 1,469,000 18.9% 11.0% Other 1,999,304 25.7% 14.9% 7,768,304 100.0% 58.0% Class B Shareholdings Temagami Mining Company Limited 725,000 0.1% 0.1% SMM Resources Inc (Sumitomo) 295,800 0.1% 0.0% China Investment Corporation (Fullbloom) 59,304,474 10.5% 4.4% Other 501,972,680 89.3% 37.5% 562,297,954 100.0% 42.0% Total Shareholdings Temagami Mining Company Limited 5,025,000 0.9% 32.2% SMM Resources Inc (Sumitomo) 1,764,800 0.3% 11.0% China Investment Corporation (Fullbloom) 59,304,474 10.4% 4.4% Other 503,971,984 88.4% 52.4% 570,066,258 100.0% 100.0% Teck Resources Limited1
- 50. Notes: Appendix – Strategy and Overview Slide 42: Global Customer Base 1. Gross profit before depreciation and amortization is a non-GAAP financial measure. See “Non-GAAP Financial Measures” slides. Slide 44: Production Guidance 1. As at April 22, 2019. See Teck’s Q1 2019 press release. 2. Metal contained in concentrate. 3. We include 100% of production and sales from our Quebrada Blanca and Carmen de Andacollo mines in our production and sales volumes because we fully consolidate their results in our financial statements. We include 22.5% and 21.3% of production and sales from Antamina and Fort Hills, respectively, representing our proportionate ownership interest in these operations. 4. Copper production includes cathode production at Quebrada Blanca and Carmen de Andacollo. 5. Total zinc includes co-product zinc production from our copper business unit. 6. Excludes production from QB2 for three-year guidance 2020–2022. 7. Results for 2018 are effective from June 1, 2018. 8. The 2020–2022 bitumen production guidance does not include potential near-term debottlenecking opportunities. See energy business unit in Q4 2018 press release for more information. Slide 45: Sales and Unit Cost Guidance 1. As at April 22, 2019. See Teck’s Q1 2019 press release. 2. Steelmaking coal unit costs are reported in Canadian dollars per tonne. Adjusted site cost of sales includes site costs, transport costs, and other and does not include deferred stripping or capital expenditures. Adjusted site cost of sales is a non-GAAP financial measure. See “Non-GAAP Financial Measures” slides. 3. Copper unit costs are reported in U.S. dollars per payable pound of metal contained in concentrate. Total cash unit costs are before co- and by-product margins. Copper net cash costs are after by-product margins and include adjusted cash cost of sales, smelter processing charges and cash margin for by-products including co-products. Assumes a zinc price of US$1.30 per pound, a molybdenum price of US$12 per pound, a silver price of US$16.00 per ounce, a gold price of US$1,250 per ounce and a Canadian/U.S. dollar exchange rate of $1.30. See “Non-GAAP Financial Measures” slides. 4. Zinc unit costs are reported in U.S. dollars per payable pound of metal contained in concentrate. Total cash unit costs are before co- and by-product margins. Zinc net cash costs are after by-product margins and are mine costs including adjusted cash cost of sales, smelter processing charges and cash margin for by-products. Assumes a lead price of US$1.00 per pound, a silver price of US$16.00 per ounce and a Canadian/U.S. dollar exchange rate of $1.30. By-products include both by-products and co-products. See “Non-GAAP Financial Measures” slides. 5. Bitumen unit costs are reported in Canadian dollars per barrel. Adjusted operating costs represent costs for the Fort Hills mining and processing operations and do not include the cost of diluent, transportation, storage and blending. See “Non- GAAP Financial Measures” slides. 50
- 51. Notes: Appendix – Strategy and Overview Slide 46: Capital Expenditures Guidance 1. As at April 22, 2019. See Teck’s Q1 2019 press release. 2. For steelmaking coal, sustaining capital includes Teck’s share of water treatment charges of $57 million in 2018. Sustaining capital guidance includes Teck’s share of water treatment charges related to the Elk Valley Water Quality Plan, which are approximately $235 million in 2019. Steelmaking coal major enhancement capital guidance includes $175 million relating to the facility upgrade at Neptune Bulk Terminals that will be funded by Teck. 3. For copper, new mine development guidance for 2019 includes QB3 scoping, Zafranal, San Nicolás and Galore Creek. 4. Total estimated SMM and SC contributions are $1.77 billion. The difference will be in cash at December 31, 2019. Total estimated contributions are US$1.2 billion as disclosed and US$142 million for their share of expenditures from January 1, 2019 to March 31, 2019. 5. On a 100% go forward basis from January 1, 2019 in constant Q2 2017 dollars and a CLP:USD exchange rate of 625, not including escalation (estimated at US$300 - $470 million based on 2 - 3% per annum inflation), working capital or interest during construction. Includes approximately US$500 million in contingency. At a spot CLP/USD rate of approximately 675 capital would be reduced by approximately US$270 million 6. On a go forward basis from January 1, 2019. Slide 47: Commodity Price Leverage 1. As at April 22, 2019. Before pricing adjustments, based on our current balance sheet, our expected 2019 mid-range production estimates, current commodity prices and a Canadian/U.S. dollar exchange rate of $1.32. See Teck’s Q1 2019 press release. 2. All production estimates are subject to change based on market and operating conditions. 3. The effect on our profit attributable to shareholders and on EBITDA of commodity price and exchange rate movements will vary from quarter to quarter depending on sales volumes. Our estimate of the sensitivity of profit and EBITDA to changes in the U.S. dollar exchange rate is sensitive to commodity price assumptions. EBITDA is a non-GAAP financial measure. See “Non-GAAP Financial Measures” slides. 4. Zinc includes 307,500 tonnes of refined zinc and 635,000 tonnes of zinc contained in concentrate. 5. Bitumen volumes from our energy business unit. 6. Our WTI oil price sensitivity takes into account our interest in Fort Hills for respective change in revenue, partially offset by the effect of the change in diluent purchase costs as well as the effect on the change in operating costs across our business units, as our operations use a significant amount of diesel fuel. Slide 48: Tax-Efficient Earnings In Canada 1. As at December 31, 2018. Slide 49: Share Structure & Principal Shareholders 1. As at December 31, 2018. 51
- 52. Sustainability
- 53. Sustainability Strategy • Strong sustainability performance enabled by a strategy built around developing opportunities and managing risks • Implementing a sustainability strategy with short-term, five-year goals and long-term goals stretching out to 2030 Goals cover the six areas of focus representing the most significant sustainability issues and opportunities facing our company 53 Community Water Our People Biodiversity Energy and Climate Change Air
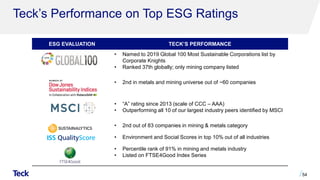
- 54. Teck’s Performance on Top ESG Ratings ESG EVALUATION TECK’S PERFORMANCE • Named to 2019 Global 100 Most Sustainable Corporations list by Corporate Knights • Ranked 37th globally; only mining company listed • 2nd in metals and mining universe out of ~60 companies • “A” rating since 2013 (scale of CCC – AAA) • Outperforming all 10 of our largest industry peers identified by MSCI • 2nd out of 83 companies in mining & metals category • Environment and Social Scores in top 10% out of all industries • Percentile rank of 91% in mining and metals industry • Listed on FTSE4Good Index Series 54
- 55. Why Sustainability Matters 55 • Increased access to capital at a lower cost • Increased cost savings and productivity • Higher financial returns • Brand value and reputation • Reduced risk of operations disruption • Efficient project and permit approvals • Meet rising supply chain and societal expectations • Employee retention and recruitment Driving Growth and Managing Risk
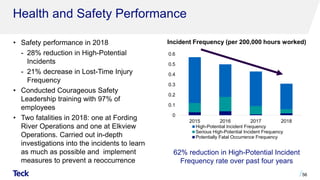
- 56. Health and Safety Performance • Safety performance in 2018 - 28% reduction in High-Potential Incidents - 21% decrease in Lost-Time Injury Frequency • Conducted Courageous Safety Leadership training with 97% of employees • Two fatalities in 2018: one at Fording River Operations and one at Elkview Operations. Carried out in-depth investigations into the incidents to learn as much as possible and implement measures to prevent a reoccurrence 56 0 0.1 0.2 0.3 0.4 0.5 0.6 2015 2016 2017 2018 High-Potential Incident Frequency Serious High-Potential Incident Frequency Potentially Fatal Occurrence Frequency Incident Frequency (per 200,000 hours worked) 62% reduction in High-Potential Incident Frequency rate over past four years
- 57. Leading Practices in Tailings Management Transparency • Details on all tailings facilities available online • Dam Safety Inspections publically available on our website Collaboration • Actively engaged on the International Council on Mining and Metals (ICMM) Tailings Position Statement and Governance Framework • Participant in ICMM’s leadership work on an aspirational goal of reducing reliance on conventional tailings practices 57 Full table and additional information available at www.teck.com/tailings
- 58. Reducing Freshwater Use Teck in top 10 of 50+ companies ranked by DJSI • Water recycled average of 3 times at mining operations in 2018 • Target to reduce freshwater use at Chilean operations by 15% by 2020 • Desalinated seawater for Quebrada Blanca 2 project in place of freshwater; 26.5 million m3 per year 58 0 10 20 30 40 50 60 70 80 90 100 percentilerankings: lowesttohighestscores Teck (84th percentile) Related SASB1 Metric: EM-MM-140a.1 | Link to Data DJSI Water Related Risk Assessment 2018 Percentile Rankings2
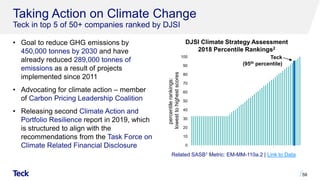
- 59. Taking Action on Climate Change Teck in top 5 of 50+ companies ranked by DJSI • Goal to reduce GHG emissions by 450,000 tonnes by 2030 and have already reduced 289,000 tonnes of emissions as a result of projects implemented since 2011 • Advocating for climate action – member of Carbon Pricing Leadership Coalition • Releasing second Climate Action and Portfolio Resilience report in 2019, which is structured to align with the recommendations from the Task Force on Climate Related Financial Disclosure 59 Related SASB1 Metric: EM-MM-110a.2 | Link to Data 0 10 20 30 40 50 60 70 80 90 100 percentilerankings: lowesttohighestscores Teck (95th percentile) DJSI Climate Strategy Assessment 2018 Percentile Rankings2
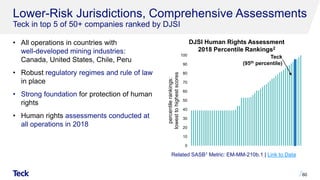
- 60. Lower-Risk Jurisdictions, Comprehensive Assessments Teck in top 5 of 50+ companies ranked by DJSI • All operations in countries with well-developed mining industries: Canada, United States, Chile, Peru • Robust regulatory regimes and rule of law in place • Strong foundation for protection of human rights • Human rights assessments conducted at all operations in 2018 60 Related SASB1 Metric: EM-MM-210b.1 | Link to Data Teck (95th percentile) 0 10 20 30 40 50 60 70 80 90 100 percentilerankings: lowesttohighestscores DJSI Human Rights Assessment 2018 Percentile Rankings2
- 61. • Agreements in place at all mining operations within or adjacent to Indigenous Peoples’ territories • Achieved agreements with all Indigenous communities near the QB2 project ‒ 8 of 8 agreements with Indigenous communities ‒ 7 of 7 agreements with fishermen’s unions • Achieved agreements with 14 out of 14 potentially affected Indigenous groups near our Frontier project • Working with UN Women in Chile to advance economic opportunities for Indigenous women 61 Strengthening Relationships with Indigenous Peoples Related SASB1 Metric: EM-MM-210a.3 | Link to Data
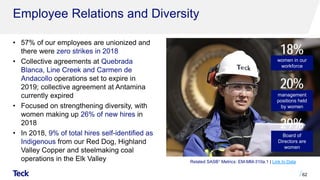
- 62. • 57% of our employees are unionized and there were zero strikes in 2018 • Collective agreements at Quebrada Blanca, Line Creek and Carmen de Andacollo operations set to expire in 2019; collective agreement at Antamina currently expired • Focused on strengthening diversity, with women making up 26% of new hires in 2018 • In 2018, 9% of total hires self-identified as Indigenous from our Red Dog, Highland Valley Copper and steelmaking coal operations in the Elk Valley 62 Employee Relations and Diversity 18% women in our workforce 29% Board of Directors are women Related SASB1 Metrics: EM-MM-310a.1 | Link to Data 20% management positions held by women
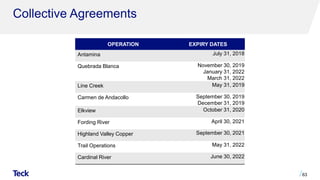
- 63. Collective Agreements OPERATION EXPIRY DATES Antamina July 31, 2018 Quebrada Blanca November 30, 2019 January 31, 2022 March 31, 2022 Line Creek May 31, 2019 Carmen de Andacollo September 30, 2019 December 31, 2019 Elkview October 31, 2020 Fording River April 30, 2021 Highland Valley Copper September 30, 2021 Trail Operations May 31, 2022 Cardinal River June 30, 2022 63
- 64. Notes: Sustainability Slide 58: Reducing Freshwater Use 1. Sustainability Accounting Standards Board Standards. https://www.sasb.org/ 2. SAM Corporate Sustainability Assessment 2018. Slide 59: Taking Action on Climate Change 1. Sustainability Accounting Standards Board Standards. https://www.sasb.org/ 2. SAM Corporate Sustainability Assessment 2018. Slide 60: Lower-Risk Jurisdictions, Comprehensive Assessments 1. Sustainability Accounting Standards Board Standards. https://www.sasb.org/ 2. SAM Corporate Sustainability Assessment 2018. Slide 61: Strengthening Relationships with Indigenous Peoples 1. Sustainability Accounting Standards Board Standards. https://www.sasb.org/ Slide 62: Employee Relations and Diversity 1. Sustainability Accounting Standards Board Standards. https://www.sasb.org/ 64
- 65. Innovation
- 66. Changing Landscape in the Mining Sector 66 Teck is pursuing a transformation of our business – called RACE21 TM with some elements already underway With the expansion in analytics, automation and digital tools, we can now transform mining, adopt a manufacturing model to unlock significant value and competitive advantage While technology has been a driving force of improvement in mining, the basic operating system has remained unchanged for decades In most industries, companies that move slowly to seize digital and analytics opportunities are falling behind or even disappearing
- 67. Teck is Actively Pursuing a Transformation Of Our Business Through Technology 67 RENEW Modernize Teck’s technology foundation AUTOMATE Accelerate and scale autonomy program CONNECT Develop digital platform for sensing and analytics EMPOWER Design future operating model to empower our employees RACE21TM
- 68. RACE21TM Moving to a manufacturing model 68 Our conviction is that the potential exists to transform mining, adopt a manufacturing model to unlock significant economic value and competitive advantage
- 69. Why Pursue a Technology Transformation? Technology leadership could create multiple opportunities 69 A source of strategic advantage to identify undervalued assets, and attract the best partners WITHIN THE INDUSTRY We could leverage our capabilities to explore opportunities in the broader global innovation ecosystem BEYOND THE MINING INDUSTRY A new operating model and capabilities to extract more value from the long-life resources Teck owns for a more sustainable future INTERNALLY
- 70. Significant Value To Be Captured 70 COST Reduced operational costs by achieving manufacturing levels of variability PROFITABILITY Step-change impact to profitability SAFETY Transformational safety impact with fewer people in high risk environments PRODUCTIVITY Increased productivity through new technologies and internal innovation Example value capture areas: Autonomy, Integrated Operations, Advanced Analytics, Real Time Data Systems A Sustainable Future
- 71. Steelmaking Coal Business Unit & Markets
- 72. Our Market is Seaborne Hard Coking Coal2: ~200 Million Tonnes Steelmaking Coal Facts Global Coal Production1: 7.5 billion tonnes Steelmaking Coal Production2: ~1,140 million tonnes Export Steelmaking Coal2: ~330 million tonnes Seaborne Steelmaking Coal2: ~290 million tonnes 72 • ~0.7 tonnes of steelmaking coal is used to produce each tonne of steel3 • Up to 100 tonnes of steelmaking coal is required to produce the steel in the average wind turbine4
- 73. Strong Chinese Steel Margins Support steelmaking coal prices China Hot Rolled Coil (HRC) Margins and Steelmaking Coal (HCC) Prices1 (US$/t) 73 -50 0 50 100 150 200 250 300 350 China HRC Gross Margins China Domestic HCC Price Argus Premium HCC CFR China
- 74. 140 65 50 35 0 0 20 40 60 80 100 120 140 160 2016-2020 target 2016 actual 2017 actual 2018 actual Remaining 800 290 250 270 0 0 100 200 300 400 500 600 700 800 900 2016-2020 target 2016 actual 2017 actual 2018 actual Remaining Capacity Reductions in China Support Pricing 74 Steel Capacity Reduction Achieved1 (Mt) • Steel: Profitable steel industry supports raw materials pricing • Coal: Capacity reductions support seaborne imports Coal Capacity Reduction Achieved1 (Mt)
- 75. Large Users in China Increasing Imports ~2/3 of China crude steel produced on coast; projects support imports 75 Seaborne Coking Coal Imports1 (Mt) HBIS LAOTING PROJECT • Inland plant relocating to coastal area • Capacity: crude steel 20 Mt • Status: Construction started in 2017; completion in 2020 ZONGHENG FENGNAN PROJECT • Inland plant relocating to coastal area • Capacity: crude steel 8 Mt • Status: Construction started in 2017; completion in 2021 SHOUGANG JINGTANG PLANT • Expansion • Capacity: crude steel 9.4 Mt (phase 2) • Status: Construction started in 2015; completion in H1 2019 SHANDONG STEEL RIZHAO PROJECT • Greenfield project • Capacity: crude steel 8.5 Mt • Status: Construction started in 2015; BF #1 completed in 2017; BF #2 completion in 2019 LIUSTEEL FANGCHENG PROJECT • Greenfield project • Capacity: Phase 1 crude steel ~10 Mt • Status: Construction started in 2017 BAOWU ZHANJIANG PLANT • Expansion • Capacity: crude steel 3.6 Mt (phase 2) • Status: Construction started in 2019 BAOWU YANCHENG PROJECT • Inland plant relocating to coastal area • Capacity: crude steel 20 Mt • Status: Construction to start in 2019 11 6 10 21 21 22 25 25 24 21 19 25 39 26 13 11 18 13 0 10 20 30 40 50 60 70 2010 2012 2014 2016 2018 15 users Non-15 users
- 76. Chinese Scrap Use to Increase Slowly EAF share in crude steel production to recover only to 2016’s level Construction 55-60% Machinery 15-20% Auto 5-10% Others 15-20% 76 78% 72% 55% 40% 39% 35% 32% 23% 37% 18% 0% 20% 40% 60% 80% 100% 0 200 400 600 800 1000 2014 2015 2016 2017 2018 2019 2020 2021 2022 2023 China’s Scrap Ratio was ~1/2 of World Average in 20171 (%) Crude Steel Electric Arc Furnace Hot Metal China Steel Use By Sector (2000-2017)2 Crude Steel and Electric Arc Furnace Production3 (Mt)
- 77. Chinese Steelmaking Coal Imports Seaborne Q1 2019 imports up by +2 Mt 77 32 25 34 60 48 35 36 44 37 15 20 19 15 15 13 24 26 28 0 10 20 30 40 50 60 70 80 Landborne Coking Coal Imports Seaborne Coking Coal Imports 380 400 420 440 460 480 500 520 0 100 200 300 400 500 600 700 800 900 1000 CSP (LHS) HMP (LHS) Coking Coal Production (RHS) Chinese Coking Coal Imports2 (Mt) Chinese Crude Steel Production (CSP), Hot Metal Production (HMP) and Coal Production (Mt)1
- 78. 0 20 40 60 80 100 120 0 10 20 30 40 50 60 Indian Steelmaking Coal Imports Imports supported by secular demand and government growth targets 78 Indian Seaborne Coking Coal Imports2 (Mt)Indian Crude Steel Production1 (Mt)
- 79. 0 20 40 60 80 100 120 140 160 180 200 0 10 20 30 40 50 60 70 US Coal Producers are Swing Suppliers 79 US Steelmaking Coal Exports1 (Mt)Australian Steelmaking Coal Exports1 (Mt)
- 80. 0 5 10 15 20 25 30 35 40 0 1 2 3 4 5 6 7 8 Canadian & Mozambique Steelmaking Coal Exports 80 Mozambique Exports1 (Mt)Canadian Exports1 (Mt)
- 81. Steelmaking Coal Demand Growth Forecast Growth drivers: Western Europe, India and Southeast Asia Seaborne Steelmaking Coal Imports1 (Mt) Change 2019 vs. 2018 81 310 315 314-318 4 1 1 3 2 1 280 290 300 310 320 330 2018 W. Europe S.E. Asia Others 2019, ex. India, E Europe & China India E. Europe China 2019 Includes: • Western Europe: Growth mostly from Italy, France, Turkey, Germany • Southeast Asia: Growth mostly from Vietnam • India: Analyst views ranging from +2 Mt to +4 Mt2 • Eastern Europe: Analyst views on Ukraine and Poland ranging from -3 Mt to +1 Mt3 • China: Analyst views ranging from -1 Mt to -2 Mt3
- 82. Steelmaking Coal Supply Growth Forecast Most growth comes from Australia Seaborne Steelmaking Coal Exports1 (Mt) Change 2019 vs. 2018 82 Includes: • Australia: Growth from existing mines (Caval Ridge/Peak Downs, Grosvenor, Appin, Byerwen) and mine restarts (Burton, Russel Vale) • Mozambique: Vale Moatize ramp up • Canada: Restarted mines ramp up • Indonesia: Analyst views ranging from +0.5 Mt to +2 Mt2 • USA: Analyst views ranging from -8 Mt to flat3 310 318 312-3186 1 1 1 4 280 290 300 310 320 330 2018 Australia Mozambique Canada 2019, ex. Indonesia & USA Indonesia USA 2019
- 83. 0 10 20 30 40 50 60 2019 2020 2021 2022 2023 2024 Highly probable projects Possible restarts Probable projects Includes: • Highly probable projects: Russia (~45%), Australia (~30%), USA (~25%) • Possible restarts: Australia (~60%), Canada (~20%), ROW (~20%) • Probable projects: Australia (~45%), Canada (~35%), ROW (~20%) Steelmaking Coal Supply / Demand Balance Coal gap is developing unless projects progress 83 Possible Restarts and Projects1 (Mt)Supply & Demand from Existing Mines1 (Mt) 275 295 315 335 355 375 2018 2019 2020 2021 2022 2023 2024 USA: Analyst views ranging from -8Mt to flat Existing mines Demand: base case (WoodMac) Demand: high case (AME) ~30-55 Mt needed from restarts and projects by 2024 Gap to base case Additional gap to high case Includes: • Existing mines: expansion (~35Mt) and depletion (~40Mt) • Expansions: Australia (~50%), Indonesia/Russia/Mozambique/Canada/ROW (~10% each) • Depletion: Australia (~50%), USA (~30%), ROW (~20%)
- 84. 2nd Largest Seaborne Steelmaking Coal Supplier Competitively positioned to supply steel producers worldwide 84 CHINA 2013: ~30% 2017: ~15% 2018: ~10% INDIA 2013: ~5% 2017: ~10% 2018: ~15% Sales Distribution NORTH AMERICA ~5% EUROPE 2013: ~15% 2017: ~20% 2018: ~15% ASIA EXCL. CHINA & INDIA 2013: ~40% 2017: ~45% 2018: ~50% LATIN AMERICA ~5% Sales to India Exceeded China from 2018
- 85. An Integrated Long Life Coal Business 85 Prince Rupert Ridley Terminal Vancouver Prince George Edmonton Calgary Westshore Terminal Quintette Cardinal River Elk Valley Kamloops British Columbia Alberta Seattle Elkford Sparwood Hosmer Fernie Fording River Greenhills Line Creek Elkview Coal Mountain Elco ELK VALLEY 1,150 km Neptune Terminal Coal Mountain Phase 2 • 940 million tonnes of reserves support ~27 Mt of production for many years • Geographically concentrated in the Elk Valley • Established infrastructure and capacity with mines, railways and terminals
- 86. Long Life With Growth Potential in Steelmaking Coal 26.0-26.5 million tonnes in 2019 • Advancing production in new areas to fully offset Coal Mountain closure 27-28 million tonnes in 2020 and beyond • Investment in plant throughput capacity at Elkview to capitalize on lower strip ratio beginning in 2020 86 20 21 22 23 24 25 26 27 28 29 2015 2016 2017 2018 2019 2020 2021 2022 2023 2024 2025 2026 2027 Teck Coal BU Coal Mountain EVO 8M EVO 9M Annual Production Capacity1 (Mt) Investing in low capital intensity production capacity to maximize near term profit generating potential
- 87. Maximizing Cash Flow in Any Steelmaking Coal Market High Price Environment • Production focus to capture high margins and maximize free cash flow1 ‒ Utilize higher cost equipment, contractor labour, internal overtime, & intersite processing to increase production Low Price Environment • Cost focus to protect margins and maximize free cash flow1 ‒ Parking higher cost equipment, reduced contractor trades and mining reliance, hiring freeze, lower material movement ‒ Emphasis on cost reduction initiatives 87 Cost of Sales and Realized Sales Price ($/t) $57 $50 $51 $45 $43 $52 $62 $652 $194 $153 $126 $117 $153 $226 $243 $224 $0 $50 $100 $150 $200 $250 2012 2013 2014 2015 2016 2017 2018 2019B Cost of Sales ($/t) Realized CAD Sales Price ($/t)
- 88. 6 8 10 12 Setting Up for Strong Long-Term Cash Flows In Steelmaking Coal Strip ratio increase planned in 2019 to advance clean coal expansion • Future strip ratio on par with historical average Elkview Operations driving the increase in clean coal strip ratio to advance ability to produce at 9 million tonne rate by 2021 • Elkview strip ratio drops from 11.8 in 2019 to 6.9 by 2023 ‒ 2018-2029 average of 9.2 88 Clean Strip Ratio1 11.8 6.9 6 8 10 12 2018 2019 2020 2021 2022 2023 2024 Coal Elkview Clean Strip Ratio1 6 Year Average
- 89. Reinvesting to Maintain Productivities And Manage Costs in Steelmaking Coal Maintaining historical dollar per tonne sustaining investment levels 2010-2016: Average spend of ~$6 per tonne1 • Reinvestment in 5 shovels, 50+ haul trucks 2017-2023: Average spend of ~$6 per tonne1 • Reinvestment in equipment fleets and technology to increase mining productivity and processing capacity 89 Cost of Sales and Realized Sales Price ($/t) $- $2 $4 $6 $8 $10 $12 $14 2010 2011 2012 2013 2014 2015 2016 2017 2018 2019 2020 2021 2022 2023 Sustaining Excl. Water 2010-2016 Avg $/t 2017-2023 Avg $/t Sustaining Capital, Excluding Water Treatment1 ($/t) Long term run rate for sustaining capital is ~$6 per tonne
- 90. Major Enhancement Capital Expenditures1,2 ($M) Investing In Production Capacity in Steelmaking Coal Major enhancement projects increasing long-term production capacity: • SWIFT at Fording River Operations • Baldy Ridge Extension at Elkview Operations • 9 Million project at Elkview Operations 2010-2016: Average spend of ~$160 million2 per year • Increased production capacity by ~3.5 million tonnes 2017-2023: Average spend of ~$134 million2 per year • Increasing production capacity for 2020-2026 production by ~3 million tonnes per year ‒ Increasing plant capacity at Elkview Operations (EVO 9M) 90 - 50 100 150 200 250 300 350 400 2010 2011 2012 2013 2014 2015 2016 2017 2018 2019 2020 2021 2022 2023 Major Enhancement Swift Baldy Ridge EVO 9M 2010-2016 Avg 2017-2023 Avg
- 91. Progress on Reducing Long-Term Water Treatment Costs Saturated Rock Fills (SRF) demonstrated to be a direct replacement for current Active Water Treatment Facilities (AWTF), subject to regulatory approval SRF strategy could reduce water capital to $600 million to $650 million in 2018-20221 • SRF capital costs ~20% of current permitted treatment option (AWTF) • SRF operating costs are ~50% of AWTF Currently permitting second phase of Elkview’s SRF to 20,000 m3 per day and advancing first pilot at Fording River 91 Use and Enhancement of Biological Process Present in Backfill Pits
- 92. Water Treatment Capital 92 - 100 200 300 400 2018 2019 2020 2021 2022 - 100 200 300 400 2018 2019 2020 2021 2022 - 100 200 300 400 2018 2019 2020 2021 2022 Water Capital ($M) Worst Case1,2 Water Capital ($M) Previous Guidance1,2 Water Capital ($M) Best Case1,2 SRF permitted would reduce water capital to $600 million to $650 million3 • 1 LCO4 AWTF completed • EVO4 SRF • FRO4 AWTF–South • Replacing FRO AWTF-North with SRF capacity Previous guidance of $850 million to $900 million • 1 LCO AWTF completed • Construction of 3 AWTFs ‒ EVO AWTF ‒ FRO AWTF-North ‒ FRO AWTF-South AWTF revised requires ~$250 million in additional capital • Needed if SRF strategy is not permitted • Design scope change at EVO AWTF • Increased design capacity at FRO AWTF–North
- 93. SALES MIX • ~40% quarterly contract price • ~60% shorter than quarterly pricing mechanisms (including “spot”) PRODUCT MIX • ~75% of production is high-quality HCC • ~25% is a combination of SHCC, SSCC, PCI and a small amount of thermal • Varies quarter-to-quarter based on the mine plans KEY FACTORS IMPACTING TECK’S AVERAGE REALIZED PRICES • Variations in our product mix • Timing of sales • Direction and underlying volatility of the daily price assessments • Spreads between various qualities of steelmaking coal • Arbitrage between FOB Australia and CFR China pricing Teck’s Pricing Mechanisms Coal sales book generally moves with the market 93 Index Linked Sales • Quarterly contract sales index linked • Contract sales index linked • Contract sales with index fallback • Spot sales index linked Fixed Price Sales • Contract sales spot priced • Contract sales with index fallback • Spot sales with fixed price 80% 20% Index Linked Fixed Price Pricing Mechanisms (%)
- 94. Quality and Basis Spreads Impact Teck’s average realized steelmaking coal prices 94 0 25 50 75 100 0 50 100 150 200 250 300 350 HCC (LHS) SHCC (LHS) HCC / SHCC spread (RHS) -60 -40 -20 0 20 40 0 50 100 150 200 250 300 350 HCC FOB Australia (LHS) HCC CFR China (LHS) CFR / FOB spread (RHS) HCC FOB / CFR Prices and Spread2 (US$/t)HCC / SHCC Prices and Spread1 (US$/t)
- 95. ~75 Mtpa of West Coast Port Capacity Planned Teck port capacity exceeds current production plans, including Quintette 95 0 10 20 30 40 Ridley Neptune Westshore Current Capacity Planned Growth • Current capacity 33 Mtpa • ~$275 million upgrade to 35 Mtpa by 2019 • Teck is largest customer at 19 Mtpa • Contract expires March 31, 2021 WESTSHORE TERMINALS • Teck / Canpotex Joint Venture • Current capacity 12.5 Mtpa • ~$470 million investment to upgrade and rejuvenate • Planned growth to > 18.5 Mtpa NEPTUNE COAL TERMINAL • Current capacity 16 Mtpa • Teck contracted at 3 Mtpa • Planned growth to > 20 Mtpa RIDLEY TERMINALS West Coast Port Capacity (Nominal Mt)
- 96. Notes: Appendix – Steelmaking Coal Slide 72: Steelmaking Coal Facts 1. Source: IEA. 2. Source: CRU. 3. Source: World Coal Association. Assumes all of the steel required is produced by blast furnace-basic oxygen furnace route. 4. Source: The Coal Alliance. Assumes all of the steel required is produced by blast furnace-basic oxygen furnace route. Slide 73: Strong Chinese Steel Margins 1. Source: China HRC Gross Margins is estimated by Mysteel. China Domestic HCC Price is Liulin #4 price sourced from Sxcoal and is normalized to CFR China equivalent. Seaborne HCC Price (CFR China) is based on Argus Premium HCC CFR China. Plotted to April 26, 2019. Slide 74: Capacity Reductions in China Support Pricing 1. Source: Governmental announcements. Slide 75: Large Users in China Increasing Seaborne Imports 1. Source: China Customs, Fenwei, Teck. Slide 76: Chinese Scrap Use to Increase Slowly 1. Source: WSA. 2. Source: China Metallurgy Industry Planning and Research Institute. 3. Source: CRU. Slide 77: Chinese Steelmaking Coal Imports 1. Source: NBS, Fenwei. 2. Source: China Customs, Fenwei. Slide 78: Indian Steelmaking Coal Imports 1. Source: WSA. 2. Source: Global Trade Atlas. Slide 79: US Coal Producers are Swing Suppliers 1. Source: Global Trade Atlas. US exports do not include exports to Canada. Slide 80: Canadian and Mozambique Steelmaking Coal Exports 1. Source: Global Trade Atlas. 2. Source: CRU. 96