IoT with Azure Machine Learning and InfluxDB
- 1. April 22 IoT with InfluxDB and Azure ML Storing and Processing Time Series Data for IoT
- 2. About me • Project Manager @ o 15 years professional experience o .NET Web Development MCPD • External Expert Horizon 2020 • External Expert Eurostars & IFD • Business Interests o Web Development, SOA, Integration o Security & Performance Optimization o IoT, Computer Intelligence • Contact o ivelin.andreev@icb.bg o www.linkedin.com/in/ivelin o www.slideshare.net/ivoandreev
- 3. Agenda Time Series o Why Time Series o InfluxDB vs Competitors o Key Concepts o Demo Machine Learning o Azure ML vs Competitors o Choosing the right algorithm o Algorithm Performance o Demo
- 4. IoT Data • IoT (buzzword of the year) • 30 billion “things” by 2020 (Forbes) • Top IoT Industries • Manufacturing • Healthcare • What are the benefits from IoT? • The discussion has shifted • How to make IoT work? • How to gain insight on hidden relations? • How to get actionable results?
- 6. Azure ML • Part of Cortana Intelligence Suite • How SSAS Compares? o Similar algorithms o No web based environment (ML Studio) o Limited to RDBMS for mining models o Limited client applications (no web service)
- 7. Main Players Azure ML BigML Amazon ML Google Prediction IBM Watson ML Flexibility High High Low Low Low Usability High Med High Low High Training time Low Low High Med High Accuracy (AUC) High High High Med High Cloud/ On-premises +/- +/+ +/- +/- +/- Algorithms Classification Regression Clustering Anomaly detect Recommendations Classification Regression Clustering Anomaly Recommend Classification Regression Classification Regression Semantic mining Hypothesis rank Regression Customizations Model parameters R-script Evaluation support Own models C#, R, Node.js Few parameters
- 8. 1. Dataset Azure ML Flow 2. Training Experiment 3. Predictive Experiment 4. Publish Web Service 5. Retrain Model
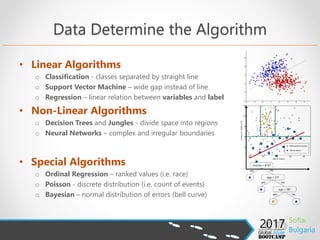
- 10. Data Determine the Algorithm • Linear Algorithms o Classification - classes separated by straight line o Support Vector Machine – wide gap instead of line o Regression – linear relation between variables and label • Non-Linear Algorithms o Decision Trees and Jungles - divide space into regions o Neural Networks – complex and irregular boundaries • Special Algorithms o Ordinal Regression – ranked values (i.e. race) o Poisson - discrete distribution (i.e. count of events) o Bayesian – normal distribution of errors (bell curve)
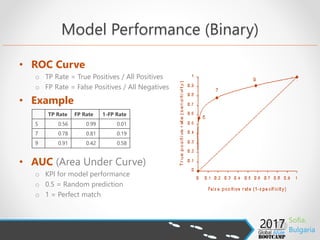
- 11. • ROC Curve o TP Rate = True Positives / All Positives o FP Rate = False Positives / All Negatives • Example • AUC (Area Under Curve) o KPI for model performance o 0.5 = Random prediction o 1 = Perfect match Model Performance (Binary) TP Rate FP Rate 1-FP Rate 5 0.56 0.99 0.01 7 0.78 0.81 0.19 9 0.91 0.42 0.58
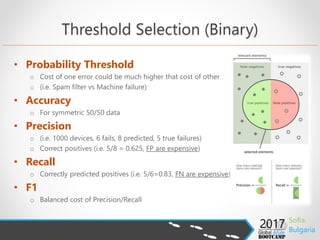
- 12. • Probability Threshold o Cost of one error could be much higher that cost of other o (i.e. Spam filter vs Machine failure) • Accuracy o For symmetric 50/50 data • Precision o (i.e. 1000 devices, 6 fails, 8 predicted, 5 true failures) o Correct positives (i.e. 5/8 = 0.625, FP are expensive) • Recall o Correctly predicted positives (i.e. 5/6=0.83, FN are expensive) • F1 o Balanced cost of Precision/Recall Threshold Selection (Binary)
- 13. Model Performance (Regression) • Coefficient of Determination (R2) o Single numeric KPI – how well data fits model o R2>0.6 – good, R2>0.8 – very good R2=1 – perfect • Mean Absolute Error / Root Mean Squared Error o Deviation of the estimates from the observed values o Compare model errors measure in the SAME units • Relative Absolute Error / Relative Squared Error o % deviation from real value o Compare model errors measure in the DIFFERENT units
- 14. Azure ML DEMO
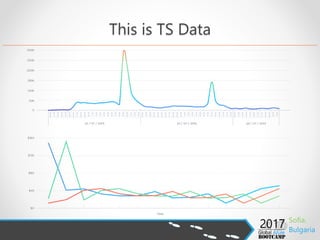
- 15. This is TS Data
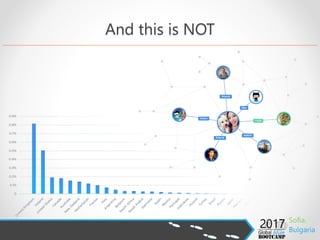
- 16. And this is NOT
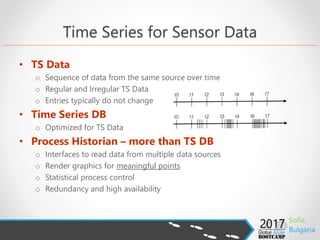
- 17. Time Series for Sensor Data • TS Data o Sequence of data from the same source over time o Regular and Irregular TS Data o Entries typically do not change • Time Series DB o Optimized for TS Data • Process Historian – more than TS DB o Interfaces to read data from multiple data sources o Render graphics for meaningful points o Statistical process control o Redundancy and high availability
- 18. When TS overperform RDBMS • Target scenarios o High I/O rate o Number of tags o Volume of data o Aggregation of irregular data o Compression & De-duplication • Requires a learning o Do you expect that many data? o Do you need to plot? o Do you need to aggregate?
- 19. • Open-source distributed TS database • Key Features o Easy setup, no external dependencies, implemented in Go o Comprehensive documentation o Scalable, highly efficient o REST API (JSON) o Supports .NET o SQL-like syntax o On-premise and cloud • Top ranked TS DB
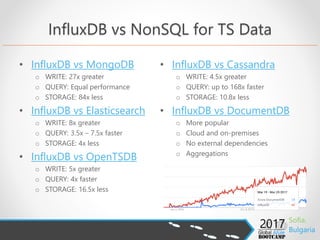
- 20. InfluxDB vs NonSQL for TS Data • InfluxDB vs MongoDB o WRITE: 27x greater o QUERY: Equal performance o STORAGE: 84x less • InfluxDB vs Elasticsearch o WRITE: 8x greater o QUERY: 3.5x – 7.5x faster o STORAGE: 4x less • InfluxDB vs OpenTSDB o WRITE: 5x greater o QUERY: 4x faster o STORAGE: 16.5x less • InfluxDB vs Cassandra o WRITE: 4.5x greater o QUERY: up to 168x faster o STORAGE: 10.8x less • InfluxDB vs DocumentDB o More popular o Cloud and on-premises o No external dependencies o Aggregations
- 21. Scalability • Single node or cluster o Single node is open source and free • Recommendations • Query complexity (Moderate) o Multiple functions, few regular expressions o Complex GROUP BY clause or sampling over weeks o Runtime 500ms – 5sec Load Resources Writes/Sec Moderate Queries/Sec. Unique Series Low Cores: 2-4; RAM: 2-4 GB 0 - 5K 0 - 5 0 – 100K Moderate Cores: 4-6; RAM: 8-32 GB 5K - 250K 5 - 25 100K - 1M High Cores: 8+; RAM: 32+ 250K – 750K 25 - 100 1M - 10M
- 22. Key Concepts Term Description Measurement Container Point Single record for timestamp Field Set Required; Not-indexed Field key Define what is measured Field value Actual measured value (string, bool, int64, float64) Tag Set Metadata about the point Optional; Indexed; Key-value; Tag key Unique per measurement Tag value Unique per tag key Series Data points with common tag set • Aggregation functions • Retention policies • Downsampling • Continuous queries
- 23. Functions Aggregations Selectors Transformations Predictors COUNT() BOTTOM() CEILING() HOLT_WINTERS() DISTINCT() FIRST() CUMULATIVE_SUM() INTEGRAL() LAST() DERIVATIVE() MEAN() MAX() DIFFERENCE() MEDIAN() MIN() ELAPSED() MODE() PERCENTILE() FLOOR() SPREAD() SAMPLE() HISTOGRAM() STDDEV() TOP() MOVING_AVERAGE() SUM() NON_NEGATIVE_DERIVATIVE()
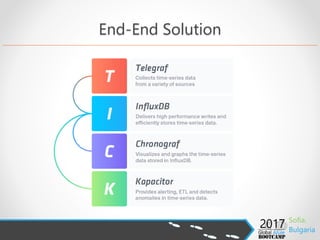
- 24. End-End Solution
- 26. Takeaways • Time Series o Time-series for monitoring and sensor data o InfluxData performance and design papers o InfluxDB hardware sizing guide o InfluxDB concepts o InfluxDB schema • Machine Learning o Choosing the right algorithm (Infographic) o Cortana Intelligence Gallery (3700 Sample Azure ML Projects) o Evaluating model performance o Azure ML documentation (full) o Azure ML video guidelines
- 27. Thanks to our Sponsors: Global Sponsor: Platinum Sponsors: Swag Sponsors: Media Partners: With the support of:
- 28. Upcoming events SQLSaturday #519 in may! http://www.sqlsaturday.com/519/


