


Landslides mapping
- 1. Based on the findings of the paper “Landslide Mapping and Characterization through Infrared Thermography (IRT): Suggestions for a Methodological Approach from Some Case Studies” by William Frodella et al. (2017) Md Asif Hasan
- 2. In recent years, amongst the new methods for accurate landslide mapping, ground-based technologies such as digital photogrammetry (DP), terrestrial laser scanning (TLS), ground-based interferometric synthetic aperture radar (GB-InSAR) and infrared have been increasingly used as efficient remote surveying techniques for the prompt characterization and mapping of slopes affected by instability processes. In this paper, the potential of Infrared Thermography (IRT) as a novel operational tool for landslide surveying, mapping and characterization was tested and demonstrated in different case studies.
- 3. Landslide mapping, hazard assessment and risk evaluation are important goals for scientists, planners, decision makers and land developers. In this context, the availability of new remote sensing technologies, based primarily on satellite, aerial and terrestrial remote sensing platforms, can allow systematic and easily updatable acquisitions of data over wide areas therefore may improve the production of landslide maps reduce costs and optimize field work
- 4. Theoretical Principles IRT (or thermal imaging) is the branch of remote sensing dealing with measuring the radiant temperature of the Earth’s surface features from a distance and can map the pattern evolution of the investigated scenario’s surface temperature.
- 6. 1. Satellite Imagery 2. Aerial Photos 3. IR thermally calibrated cameras: capable of detecting radiation in the electromagnetic spectrum within the infrared wavelengths, and converting it in digital images of that radiation (thermograms or thermographic images) Materials Fig: FLIR SC620 Thermal camera
- 7. In the context of IRT applied for the analysis of slope instability phenomena, the presence of - • fractures • subsurface voids • moisture and • seepage zones will influence the material thermal characteristics (density, thermal capacity and conductivity) modifying its heat transfer. Therefore, the presence of an inhomogeneity will be displayed in the corresponding radiant temperature map as an irregular thermal pattern with respect to the surroundings (a “thermal anomaly”).
- 8. In slope instability phenomena, a qualitative analysis of thermographic images, based on the detection and interpretation of thermal anomalies can reveal the presence of potential criticalities such as I. Structural discontinuities (due to the cooling/heating effect of air circulating within open fractures; different thermal transfer capacity of the infilling material with respect to the exposed sound rock) II. Moisture or seepage zones (due to the surface cooling caused by water evaporation) III. Ledge-niche protruding systems, scarps (due to the slope aspect and topographic roughness, which creates shadowing effects during a daily cycle of solar radiation) IV. Loose coarse debris cover sectors (due to the cooling effect of air circulating within the voids).
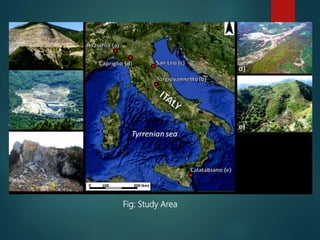
- 10. Fig: Study Area
- 11. • Since the thermal inertia of a sound rock is greater than that of a highly fractured rock or rock debris cover, the presence of discontinuities, voids or fracturing can be detected through a multi-temporal thermographic survey. • Within this work, the potential of IRT for landslide mapping and characterization (used in a passive approach) was explored by analyzing different kinds of slope mass movements, such as rock slide-falls, earth flows and composite movements located in the Italian territory Methodology
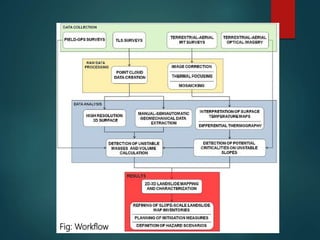
- 12. Fig: Workflow
- 13. The research activities were carried out from terrestrial and airborne platforms in combination with other geomatics methods such as TLS and GPS, in order to establish an operative methodology to be used in various applications and risk management phases. In this context, the obtained products (2D-3D surface temperature maps) were analyzed for a qualitative detection of landslide criticalities (such as open fractures, seepage and moisture sectors), and geo-rectified to be used in a Geographic Information System (GIS). A quantitative analysis was also applied, by creating differential surface temperature maps in order to detect potentially unstable debris cones and ledge-niche systems, and by analyzing the 24 h average surface temperature evolution of different slope sectors.
- 14. Depending on the hazard context of the study areas, the collected remotely sensed data were validated through field inspections. The adopted thermal calibration parameters (air temperature-humidity, distance and material emissivity) are reported in following table previous Table. Air temperature-humidity values were obtained by means of a pocket thermo-hygrometer.
- 15. Fig: 2D surface temperature maps of the investigated quarry sector acquired at h 08:00 (a) and 13:00 (b) in the month of July. Optical image acquired by the built-in digital camera (c) and 2D differential surface temperature map (d) between (a,b).
- 16. Fig: 3D maps of the investigated quarry sector: a) fracture pattern traced on terrestrial laser scanning (TLS) point cloud b) thickness of the potentially unstable wedge on high resolution surface
- 19. Fig: Thermogram of the San Leo rock cliff acquired on 9 April 2014 (a) with corresponding optical image (b) Obtained 3D surface temperature map (c) Comparison between 7 March 2014 and 18 December TLS scans. (seepage sectors 1– 4 are highlighted by black dashed ovals). (d) locating the occurring detached rock block sectors (in yellow) and rock wall sector characterized by toppling phenomena (orange-yellow areas).
- 20. Fig: 3D surface temperature maps of the San Leo rock cliff: (a) 11 June 2014, h 20:30 (b) 12 June 2014, h 05:00 (c) graph showing the 24 h average surface temperature evolution of different rock cliff sectors. Finally, a 3D differential surface temperature map of the rock mass cooling phase was obtained.
- 21. Fig: 3D differential surface temperature map highlighting open fractures (black ovals), niches (red ovals) and overhangs (green ovals) (a) manual extraction of discontinuity set on high resolution 3D surface (b) and resulting stereographic projection
- 22. Fig: Areal picture of the Caprigleo earthflow a) landslide upper sector b) Showing the Villeges at the landslide toe
- 23. Fig : Mosaicked high resolution aerial optical image acquired through a Nikon D-600 camera
- 24. Fig: surface temperature map of the investigated earth flow
- 25. Fig: Resulting map of the landslide ponds, drainage network and scarps
- 26. Fig: Image of the Calatabiano landslide acquired on 10 November 2015 from the continuous monitoring Results
- 27. Discussion Landslide maps can document the extent of landslide phenomena from a small or large watershed to a regional scale, and show information that can be exploited to determine landslide susceptibility, hazard, vulnerability and risk, as well as study the evolution of landscapes dominated by mass-wasting processes The traditional geomorphological field approach is part of the standard knowledge process is hampered by the difficulty of detecting features of instability phenomena in the field due to: • The size of the landslide (often too large to be accurately surveyed) • The viewpoint of the researcher (often unsuitable to observe all of the landslide sectors with the same level of detail) • The strong influence of external causes (thick vegetation cover, dismantling and erosional processes and anthropic activities) For these reasons, a distant remote surveying analysis like the IRT on unstable and hazardous areas can provide both the safety of the operator and a more accurate and complete landslide mapping
- 28. Benefit of IRT Remote sensing: no direct contact is required between the camera and the investigated scenario, therefore permitting the measurement of hazardous areas safely. Visibility: no external source of illumination is necessary, both diurnal and nocturnal operations are possible. Thermal radiation can also penetrate smoke and mist better than visible radiation. Large monitoring capacity: IRT is capable of simultaneously measuring temperature in correspondence to different points within a scenario.
- 29. Portability and versatility: IRT cameras are lightweight and can be easily carried. This allows to choose different fixed installations leading to different field of views and spatial resolution of the investigated scenario. Easy and fast data collection and processing: the recorded data can be easily collected, monitored and processed on laptops using dedicated imaging software, therefore allowing the measurements’ repeatability. Fast response rate: thermal imaging equipment used with a multi- temporal approach can detect and monitor rapid thermal fluctuations.
- 30. Disadvantages of this method- Orientation of the slope with respect to solar illumination: the slope aspect has an influence on the intensity and the time of exposure of the solar illumination which affects the slope. Surface temperature differences will be greater in sun-exposed surfaces. Orientation and distance of the slope with respect to the operator: IRT camera field of view and the thermograms’ spatial resolution strongly depend on the distance between the target and the object. Logistical problematics may impede a picture of the whole investigated scenario. The slope surface orientation with respect to the viewer also influences the amount of emitted and reflected thermal radiation measured by the sensor (the more the line of sight is perpendicular to the surface the higher the measured thermal radiation).
- 31. Dependence on weather conditions: high surface temperature differences are more easily detectable during warm spring and summer seasons. IRT camera measurements are negatively affected by strong wind (due to air convection) and rain (due to evaporation and subsequent cooling). The multi-temporal approach is not always suitable when it is necessary to acquire data as fast as possible. Bureaucratic restrictions: airborne thermal measurements are also affected by bureaucratic issues because flights are not allowed over prohibited, restricted or temporarily forbidden areas for safety reasons, particularly during emergencies.
- 32. Conclusion Given the portability and cost-effectiveness of modern thermal cameras, as well as the fast acquisition and processing times of thermographic data, IRT can be profitably applied in the field of landslide analysis, for the remote rapid mapping of surface temperature patterns with high spatial resolution. The use of modern high resolution thermal cameras, employed both in terrestrial (hand-held, tripod-mounted) or airborne based modes, can lead to the detection of landslides’ structural and morphologic potentially hazardous features (structural discontinuities and open fractures, scarps, seepage and moisture zones, landslide drainage network and ponds).