

Lec13 Clustering.pptx
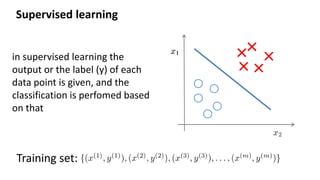
- 2. Supervised learning Training set: in supervised learning the output or the label (y) of each data point is given, and the classification is perfomed based on that
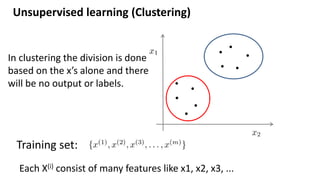
- 3. Unsupervised learning (Clustering) Training set: In clustering the division is done based on the x’s alone and there will be no output or labels. Each X(i) consist of many features like x1, x2, x3, ...
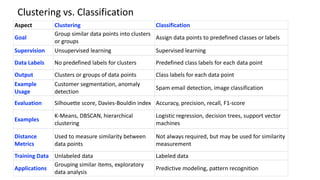
- 4. Aspect Clustering Classification Goal Group similar data points into clusters or groups Assign data points to predefined classes or labels Supervision Unsupervised learning Supervised learning Data Labels No predefined labels for clusters Predefined class labels for each data point Output Clusters or groups of data points Class labels for each data point Example Usage Customer segmentation, anomaly detection Spam email detection, image classification Evaluation Silhouette score, Davies-Bouldin index Accuracy, precision, recall, F1-score Examples K-Means, DBSCAN, hierarchical clustering Logistic regression, decision trees, support vector machines Distance Metrics Used to measure similarity between data points Not always required, but may be used for similarity measurement Training Data Unlabeled data Labeled data Applications Grouping similar items, exploratory data analysis Predictive modeling, pattern recognition Clustering vs. Classification
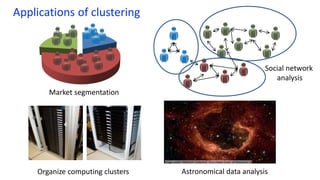
- 5. Applications of clustering Organize computing clusters Social network analysis Image credit: NASA/JPL-Caltech/E. Churchwell (Univ. of Wisconsin, Madison) Astronomical data analysis Market segmentation
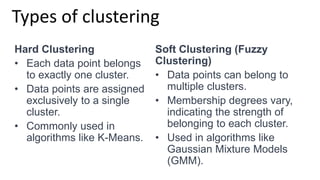
- 6. Types of clustering Hard Clustering • Each data point belongs to exactly one cluster. • Data points are assigned exclusively to a single cluster. • Commonly used in algorithms like K-Means. Soft Clustering (Fuzzy Clustering) • Data points can belong to multiple clusters. • Membership degrees vary, indicating the strength of belonging to each cluster. • Used in algorithms like Gaussian Mixture Models (GMM).
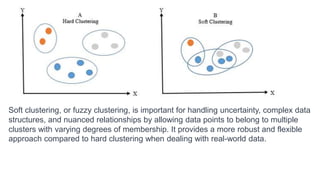
- 7. Soft clustering, or fuzzy clustering, is important for handling uncertainty, complex data structures, and nuanced relationships by allowing data points to belong to multiple clusters with varying degrees of membership. It provides a more robust and flexible approach compared to hard clustering when dealing with real-world data.
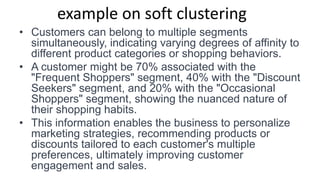
- 8. example on soft clustering • Customers can belong to multiple segments simultaneously, indicating varying degrees of affinity to different product categories or shopping behaviors. • A customer might be 70% associated with the "Frequent Shoppers" segment, 40% with the "Discount Seekers" segment, and 20% with the "Occasional Shoppers" segment, showing the nuanced nature of their shopping habits. • This information enables the business to personalize marketing strategies, recommending products or discounts tailored to each customer's multiple preferences, ultimately improving customer engagement and sales.
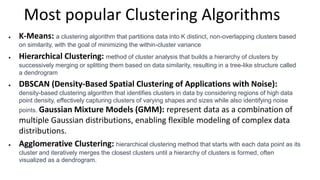
- 9. Most popular Clustering Algorithms K-Means: a clustering algorithm that partitions data into K distinct, non-overlapping clusters based on similarity, with the goal of minimizing the within-cluster variance Hierarchical Clustering: method of cluster analysis that builds a hierarchy of clusters by successively merging or splitting them based on data similarity, resulting in a tree-like structure called a dendrogram DBSCAN (Density-Based Spatial Clustering of Applications with Noise): density-based clustering algorithm that identifies clusters in data by considering regions of high data point density, effectively capturing clusters of varying shapes and sizes while also identifying noise points. Gaussian Mixture Models (GMM): represent data as a combination of multiple Gaussian distributions, enabling flexible modeling of complex data distributions. Agglomerative Clustering: hierarchical clustering method that starts with each data point as its cluster and iteratively merges the closest clusters until a hierarchy of clusters is formed, often visualized as a dendrogram.
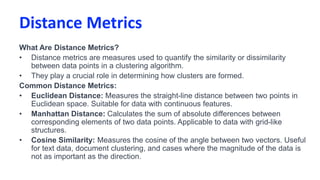
- 10. Distance Metrics What Are Distance Metrics? • Distance metrics are measures used to quantify the similarity or dissimilarity between data points in a clustering algorithm. • They play a crucial role in determining how clusters are formed. Common Distance Metrics: • Euclidean Distance: Measures the straight-line distance between two points in Euclidean space. Suitable for data with continuous features. • Manhattan Distance: Calculates the sum of absolute differences between corresponding elements of two data points. Applicable to data with grid-like structures. • Cosine Similarity: Measures the cosine of the angle between two vectors. Useful for text data, document clustering, and cases where the magnitude of the data is not as important as the direction.
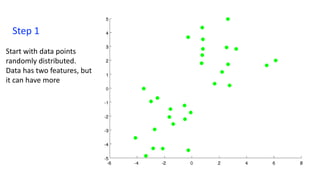
- 13. Step 1 Start with data points randomly distributed. Data has two features, but it can have more
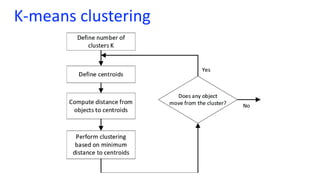
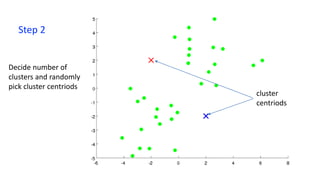
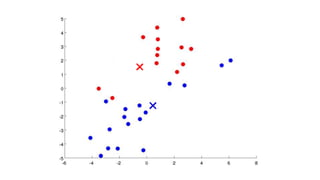
- 14. Step 2 Decide number of clusters and randomly pick cluster centriods cluster centriods
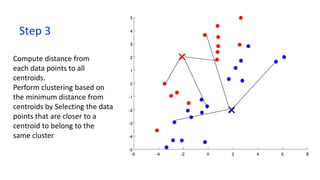
- 15. Step 3 Compute distance from each data points to all centroids. Perform clustering based on the minimum distance from centroids by Selecting the data points that are closer to a centroid to belong to the same cluster
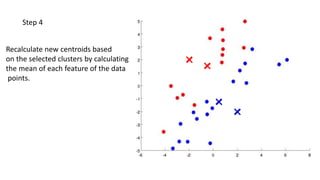
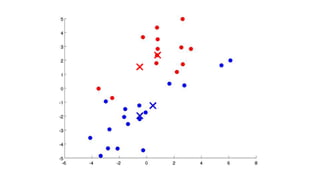
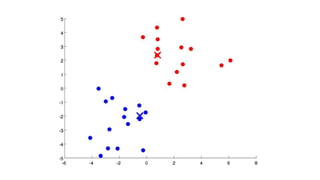
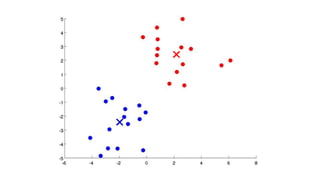
- 16. Step 4 Recalculate new centroids based on the selected clusters by calculating the mean of each feature of the data points.
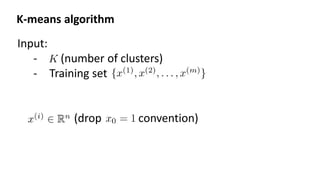
- 22. Input: - (number of clusters) - Training set (drop convention) K-means algorithm
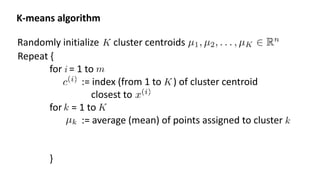
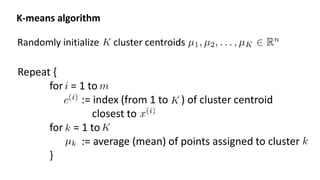
- 23. Randomly initialize cluster centroids K-means algorithm Repeat { for = 1 to := index (from 1 to ) of cluster centroid closest to for = 1 to := average (mean) of points assigned to cluster }
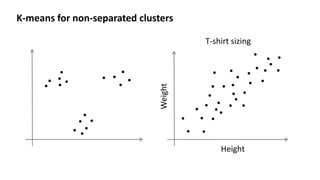
- 24. K-means for non-separated clusters T-shirt sizing Height Weight
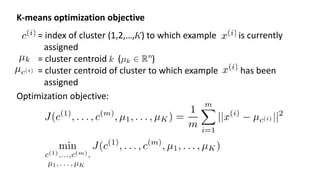
- 26. K-means optimization objective = index of cluster (1,2,…, ) to which example is currently assigned = cluster centroid ( ) = cluster centroid of cluster to which example has been assigned Optimization objective:
- 27. Randomly initialize cluster centroids K-means algorithm Repeat { for = 1 to := index (from 1 to ) of cluster centroid closest to for = 1 to := average (mean) of points assigned to cluster }
- 29. Randomly initialize cluster centroids K-means algorithm Repeat { for = 1 to := index (from 1 to ) of cluster centroid closest to for = 1 to := average (mean) of points assigned to cluster }
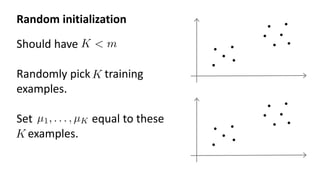
- 30. Random initialization Should have Randomly pick training examples. Set equal to these examples.
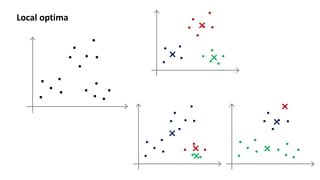
- 31. Local optima
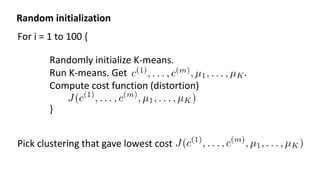
- 32. For i = 1 to 100 { Randomly initialize K-means. Run K-means. Get . Compute cost function (distortion) } Pick clustering that gave lowest cost Random initialization
- 33. Clustering Choosing the number of clusters
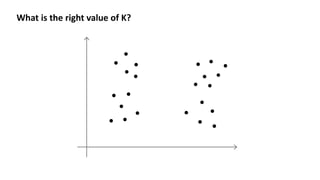
- 34. What is the right value of K?
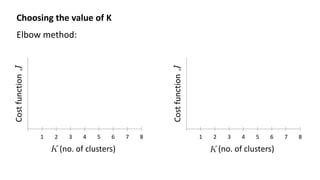
- 35. Choosing the value of K Elbow method: 1 2 3 4 5 6 7 8 Cost function (no. of clusters) 1 2 3 4 5 6 7 8 Cost function (no. of clusters)
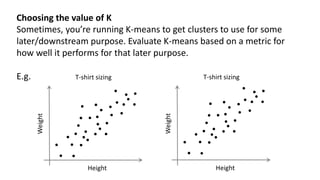
- 36. Choosing the value of K Sometimes, you’re running K-means to get clusters to use for some later/downstream purpose. Evaluate K-means based on a metric for how well it performs for that later purpose. E.g. T-shirt sizing Height Weight T-shirt sizing Height Weight
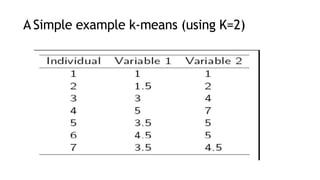
- 37. A Simple example k-means (using K=2)
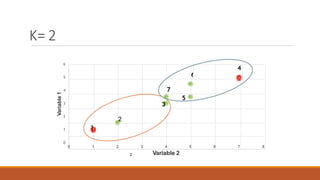
- 38. 6 4 7 3 5 2 1 6 5 4 3 2 1 0 0 1 2 3 4 Variable 2 5 6 7 8 Variable 1 K= 2 2
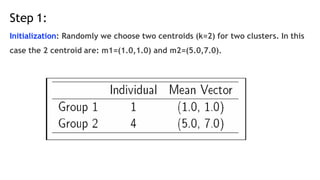
- 39. Step 1: Initialization: Randomly we choose two centroids (k=2) for two clusters. In this case the 2 centroid are: m1=(1.0,1.0) and m2=(5.0,7.0).
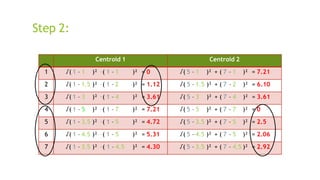
- 40. Centroid 1 Centroid 2 1 √( 1 – 1 )² + ( 1 – 1 )² = 0 √( 5 – 1 )² + ( 7 – 1 )² = 7.21 2 √( 1 – 1.5 )² + ( 1 – 2 )² = 1.12 √( 5 – 1.5 )² + ( 7 – 2 )² = 6.10 3 √( 1 – 3 )² + ( 1 – 4 )² = 3.61 √( 5 – 3 )² + ( 7 – 4 )² = 3.61 4 √( 1 – 5 )² + ( 1 – 7 )² = 7.21 √( 5 – 5 )² + ( 7 – 7 )² = 0 5 √( 1 – 3.5 )² + ( 1 – 5 )² = 4.72 √( 5 – 3.5 )² + ( 7 – 5 )² = 2.5 6 √( 1 – 4.5 )² + ( 1 – 5 )² = 5.31 √( 5 – 4.5 )² + ( 7 – 5 )² = 2.06 7 √( 1 – 3.5 )² + ( 1 – 4.5 )² = 4.30 √( 5 – 3.5 )² + ( 7 – 4.5 )² = 2.92 Step 2:
- 41. Step 2:
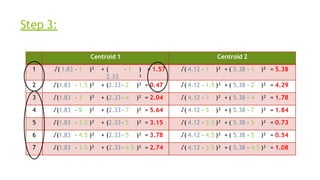
- 42. Step 3: Centroid 1 Centroid 2 1 √( 1.83 – 1 )² + ( 2.33 – 1 ) ² = 1.57 √( 4.12 – 1 )² + ( 5.38 – 1 )² = 5.38 2 √(1.83 – 1.5 )² + (2.33 – 2 )² = 0.47 √( 4.12 – 1.5 )² + ( 5.38 – 2 )² = 4.29 3 √(1.83 – 3 )² + (2.33 – 4 )² = 2.04 √( 4.12 – 3 )² + ( 5.38 – 4 )² = 1.78 4 √(1.83 – 5 )² + (2.33 – 7 )² = 5.64 √( 4.12 – 5 )² + ( 5.38 – 7 )² = 1.84 5 √(1.83 – 3.5 )² + (2.33 – 5 )² = 3.15 √( 4.12 – 3.5 )² + ( 5.38 – 5 )² = 0.73 6 √(1.83 – 4.5 )² + (2.33 – 5 )² = 3.78 √( 4.12 – 4.5 )² + ( 5.38 – 5 )² = 0.54 7 √(1.83 – 3.5 )² + (2.33 – 4.5 )² = 2.74 √( 4.12 – 3.5 )² + ( 5.38 – 4.5 )² = 1.08
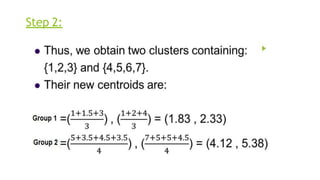
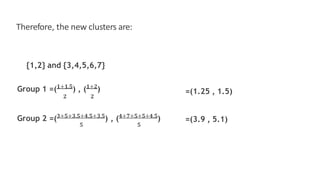
- 43. Therefore, the new clusters are: {1,2} and {3,4,5,6,7} =(1.25 , 1.5) Group 1 =(𝟏+𝟏.𝟓 ) , (𝟏+𝟐 ) 𝟐 𝟐 Group 2 =(𝟑+𝟓+𝟑.𝟓+𝟒.𝟓+𝟑.𝟓 ) , (𝟒+𝟕+𝟓+𝟓+𝟒.𝟓 ) 𝟓 𝟓 =(3.9 , 5.1)
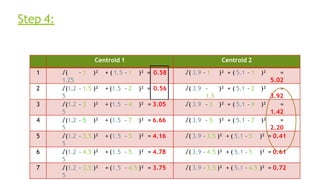
- 44. Step 4: Centroid 1 Centroid 2 1 √( 1.25 – 1 )² + ( 1.5 – 1 )² = 0.58 √( 3.9 – 1 )² + ( 5.1 – 1 )² = 5.02 2 √(1.2 5 – 1.5 )² + (1.5 – 2 )² = 0.56 √( 3.9 – 1.5 )² + ( 5.1 – 2 )² = 3.92 3 √(1.2 5 – 3 )² + (1.5 – 4 )² = 3.05 √( 3.9 – 3 )² + ( 5.1 – 4 )² = 1.42 4 √(1.2 5 – 5 )² + (1.5 – 7 )² = 6.66 √( 3.9 – 5 )² + ( 5.1 – 7 )² = 2.20 5 √(1.2 5 – 3.5 )² + (1.5 – 5 )² = 4.16 √( 3.9 – 3.5 )² + ( 5.1 – 5 )² = 0.41 6 √(1.2 5 – 4.5 )² + (1.5 – 5 )² = 4.78 √( 3.9 – 4.5 )² + ( 5.1 – 5 )² = 0.61 7 √(1.2 5 – 3.5 )² + (1.5 – 4.5 )² = 3.75 √( 3.9 – 3.5 )² + ( 5.1 – 4.5 )² = 0.72
- 45. ▶ Therefore, there is no change in the cluster . ▶ Thus, the algorithm comes to a halt here and final result consist of 2 clusters {1,2} and {3,4,5,6,7}.
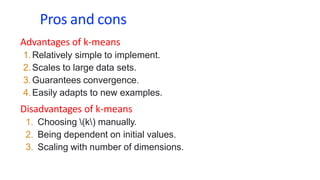
- 46. Pros and cons Advantages of k-means 1.Relatively simple to implement. 2.Scales to large data sets. 3.Guarantees convergence. 4.Easily adapts to new examples. Disadvantages of k-means 1. Choosing (k) manually. 2. Being dependent on initial values. 3. Scaling with number of dimensions.
Editor's Notes
- Swap: market seg and organize clusters
- Get rid of the legacy points
- Get rid of the legacy points
- Replace with normal text, size with LATEX fonts
- Change numbers to LATEX as well
- Replace as previous; change spacing to fill page
- Replace as previous; change spacing to fill page
- LATEX font