Lecture_3_k-mean-clustering.ppt
- 2. INTRODUCTION- What is clustering? Clustering is the classification of objects into different groups, or more precisely, the partitioning of a data set into subsets (clusters), so that the data in each subset (ideally) share some common trait - often according to some defined distance measure.
- 3. K-MEANS CLUSTERING The k-means algorithm is an algorithm to cluster n objects based on attributes into k partitions, where k < n.
- 4. An algorithm for partitioning (or clustering) N data points into K disjoint subsets Sj (k clusters) containing data points so as to minimize the sum-of-squares criterion where xi is a vector representing the the nth data point and cj is the geometric centroid of the data points in Sj (kth cluster) K-MEANS CLUSTERING
- 5. Simply speaking k-means clustering is an algorithm to classify or to group the objects based on attributes/features into K number of group. K is positive integer number. The grouping is done by minimizing the sum of squares of distances between data and the corresponding cluster centroid. K-MEANS CLUSTERING
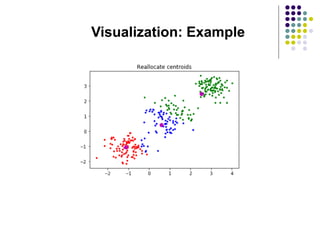
- 6. How the K-Mean Clustering algorithm works? Initialization: once the number of groups, k has been chosen, k centroids are established in the data space, for instance, choosing them randomly. Assignment of objects to the centroids: each object of the data is assigned to its nearest centroid. Centroids update: The position of the centroid of each group is updated taking as the new centroid the average position of the objects belonging to said group.
- 7. Step 1: Begin with a decision on the value of k = number of clusters. Step 2: Put any initial partition that classifies the data into k clusters. You may assign the training samples randomly, or systematically as the following: 1. Take the first k training sample as single-element clusters 2. Assign each of the remaining (N-k) training sample to the cluster with the nearest centroid. After each assignment, recompute the centroid of the clusters. K-MEANS CLUSTERING
- 8. Step 3: Take each sample in sequence and compute its distance from the centroid of each of the clusters. If a sample is not currently in the cluster with the closest centroid, switch this sample to that cluster and update the centroid of the cluster gaining the new sample and the cluster losing the sample. Step 4 . Repeat step 3 until convergence is achieved, that is until a pass through the training sample causes no new assignments. K-MEANS CLUSTERING
- 9. A Simple example showing the implementation of k-means algorithm (using K=2)
- 10. Step 1: Initialization: Randomly we choose following two centroids (k=2) for two clusters. In this case the 2 centroid are: m1 = (1.0,1.0) and m2 = (5.0,7.0)
- 11. Step 2: Thus, we obtain two clusters containing: {1,2,3} and {4,5,6,7}. Their new centroids are: Individual Centroid 1 Centroid 2 1 0 7.21 2 1.12 6.10 3 3.61 3.61 4 7.21 0 5 4.72 2.5 6 5.31 2.06 7 4.30 2.92 Distance from individual points to the two centroids
- 12. Step 3: Now using these centroids we compute the Euclidean distance of each object, as shown in table. Therefore, the new clusters are: {1,2} and {3,4,5,6,7} Next centroids are: m1=(1.25,1.5) and m2 = (3.9,5.1) Individual Centroid 1 Centroid 2 1 1.57 5.38 2 0.47 4.28 3 2.04 1.78 4 5.64 1.84 5 3.15 0.73 6 3.78 0.54 7 2.74 1.08 Distance from individual points to the two centroids
- 13. Step 4 : The clusters obtained are: {1,2} and {3,4,5,6,7} Therefore, there is no change in the cluster. Thus, the algorithm comes to a halt here and final result consist of 2 clusters {1,2} and {3,4,5,6,7}. Individual Centroid 1 Centroid 2 1 0.56 5.02 2 0.56 3.92 3 3.05 1.42 4 6.66 2.20 5 4.16 0.41 6 4.78 0.61 7 3.75 0.72
- 14. PLOT
- 15. (with K=3) Step 1 Step 2
- 16. PLOT
- 17. Elbow Method (choosing the number of clusters) Another Method - silhouette coefficient (self study) Elbow Method
- 18. Weaknesses of K-Mean Clustering 1. When the numbers of data are not so many, initial grouping will determine the cluster significantly. 2. The number of cluster, K, must be determined before hand. Its disadvantage is that it does not yield the same result with each run, since the resulting clusters depend on the initial random assignments. 3. We never know the real cluster, using the same data, because if it is inputted in a different order it may produce different cluster if the number of data is few. 4. It is sensitive to initial condition. Different initial condition may produce different result of cluster. The algorithm may be trapped in the local optimum.
- 19. Applications of K-Mean Clustering It is relatively efficient and fast. k-means clustering can be applied to machine learning or data mining Used on acoustic data in speech understanding to convert waveforms into one of k categories or Image Segmentation.
- 37. Segmentation


