Location via proxy:   [ UP ]  
[Report a bug]   [Manage cookies]                
SlideShare a Scribd company logo

1

Building Shareholder Returns by
Maximizing the Potential of Currently Held Assets

                                    NASDAQ: MPET

                                         July 2012

2

Forward Looking Statements

This presentation contains forward-looking statements that involve risks and uncertainties. Our forward-looking statements express our current
expectations or forecasts of possible future results or events, including projections of future performance, statements of management’s plans and
objectives, future contracts, and forecasts of trends and other matters. Forward-looking statements speak only as of the date of this presentation, and
we undertake no obligation to update or revise such statements to reflect new circumstances or unanticipated events as they occur, except as may be
required by securities laws You can identify these statements by the fact that they do not relate strictly to historic or current facts and often use words
                       laws.
such as “anticipate”, “estimate”, “expect”, “believe”, “will”, “outlook”, “project”, and other words and expressions of similar meaning. No assurance can
be given that the results expressed or implied by any forward-looking statements will be achieved, and actual results could be affected by one or more
factors, which could cause them to differ materially. For these statements, we claim the protection of the safe harbor for forward-looking statements
contained in the Private Securities Litigation Reform Act of 1995.
Among these risks and uncertainties are: (1) the ability of Magellan to fully realize the expected benefits from the asset swap with Santos in the
Amadeus B i and th related gas sales agreement; (2) whether th C
A d        Basin d the l t d             l              t      h th the Company can successfully achieve cost savings while d li i revenue
                                                                                                 f ll  hi        t    i      hil delivering
growth; (3) whether the workovers, recompletions, and other drilling at Poplar will result in increased production and cash generation and/or will
otherwise successfully assist in the development of Poplar; (4) whether a CO2 enhanced recovery program in the Charles formation will be viable; and
(5) the production levels from the properties in which Magellan, through its subsidiaries, have interests, the recoverable reserves at those properties,
and the prices that will ultimately be applied to the sale of such reserves. For a more complete discussion of the risk factors that may apply to any
forward looking statements, you are directed to the Risk Factors section of the Company’s Form 10-K for the year ended June 30, 2011 and
subsequent form 10-Q’s. Any forward-looking information provided in this presentation should be considered with these factors in mind. Although
                  10 Q s.       forward looking
Magellan may from time to time voluntarily update its prior forward looking statements, Magellan assumes no obligation to update any forward-looking
statements contained in this presentation, whether as a result of new information, future events, or otherwise, except as may be required by securities
laws.


Reserves

The U.S. Securities and Exchange Commission permits oil and gas companies, in their filings with the SEC, to disclose only proved, probable, and
possible reserves. We may use in this presentation the term "reserves" or "potential reserves" in connection with quantities of oil and natural gas that
we cannot include in our SEC filings. Reserves are estimated remaining quantities of oil and natural gas and related substances anticipated to be
economically producible, as of a given date, by application of development projects to known accumulations (subject to other conditions). Potential
reserves are our internal estimates of quantities of oil and natural gas that are potentially recoverable. Quantities of reserves and potential reserves
are by their nature significantly more uncertain than proved probable and possible reserves and accordingly are subject to substantially greater risk
                                                      proved, probable,                reserves,
of not actually being realized by Magellan.


                                                                                                                                                        1

3

Magellan Is…


…executing a turnaround strategy focused on maximizing the value of
 existing oil and gas assets in the United States, Australia, and the United
 Kingdom


                                                                          2

4

Investment Considerations

 Pro forma cash and equivalents of
   approximately $45 million
                                                                                             $ 61 m
 More than 10 MMBoe net proved reserves
 Several near-term opportunities to significantly
   increase reserves                                                                                         $ 45 m
                                                                                                              Adj (2)
 22 000 net unitized acres covering Poplar
  22,000
   Dome, the largest geologic structure in the
   western Williston Basin, Montana
 Rationalization of Australian natural gas assets
                                        g
                                                                                                              Cash,
   generates long-term stable revenue with                                                                  31 Mar (2)
   potential upside
 Long-term potential from onshore UK and off-
   shore A t li projects
    h    Australia j t
 Lower fixed operating costs in FY131; most
                                                                                          Market cap          Cash
   capex discretionary                                                                 (25 Jul, $1.14/sh)   ($0.83/sh)

 Experienced management team

 1. June 30 fiscal year end.
 2. Cash includes Santos asset swap proceeds. Transaction adjustments received in Q4 FY12.                               3

5

Turnaround Leadership

Robin West (65) – Chairman                    Tom Wilson (60) – CEO
 Founder, CEO of PFC Energy                   Former President of KMOC and Anderman
 Former Reagan Administration Assistant        International
  Secretary of the Interior (1981-83),         Former First Vice President and director of
  responsible for U.S. offshore oil policy      Young Energy Prize
 Member of National Petroleum Council and     Previously, led new international strategy
  Council on Foreign Relations                  for Apache and served as a Project
 Director of Key Energy Services and           Manager for Shell Oil
  formerly of Cheniere Energy


Antoine Lafargue (37) – CFO                   Randy Pharo (59) – General Counsel &
                                                Secretary
 Former CFO of Falcon Gas Storage based
  in Houston, TX
             ,                                 Former General Counsel of SM Energy
                                                                                 gy
 Previously, a principal with Arcapita, a     Member of management team that grew
  private equity fund focused on the energy     SM market cap. from ~$120 m to ~$4 bn
  and infrastructure sectors                   Over 32 years of in-house and outside
 Previously held investment banking            counsel oil and gas legal experience
  positions with DLJ/Credit Suisse and Bank
  of America
                                                                                         4

6

Poplar

          22,000 net unitized
           acres covering
           largest geologic
           structure in western
           Williston Basin
          Substantially all
           acreage held by
           production, and
           capex is mainly
           discretionary
          Bakken Play is
           moving west t
               i     t to
           Poplar


                               5

7

Poplar

                              Judith River
                               Shallow gas opportunity

                              Greenhorn
                               Oil potential – similar to Eagleford play

                              Amsden
                               New oil pool discovery Jan 12
                               First well in development

                              Tyler
                               4 current wells
                               Additional potential

                              Charles
                               250 bbls/day
                               CO2-EOR: pilot project in FY13
                                    EOR:

         Several reserve development opportunities
                                                                            6

8

Poplar – VAALCO Farm-Out

 VAALCO farm-out in Sep 2011 to explore and develop deeper formations
 at Poplar
  – 100% carry f 3 wells i calendar 2012
               for   ll in l d
  – 35% interest in all wells to Magellan

 Objective and rationale:
  – Prove up reserves and value of deeper formations of Poplar, with
    limited capital exposure through the exploration phase
  – Remain focused on Charles and shallower formations
  – Benefit from VAALCO’s horizontal well drilling expertise

 Timing:
  – First well drilled in Q1 and completion operations will be completed by
    July - preliminary results encouraging
  – Second well commenced as a horizontal well to test Bakken/Three
    Forks in June 2012
                                                                          7

9

Poplar – CO2 Enhanced Oil Recovery

 Evidence points to Charles formation being a prime candidate for CO2
  enhanced oil recovery program
 Offers the potential to increase reserves from current 10 MMbbls to 40 to
  60 MMbbls
 Initial miscibility tests confirm oil from Charles formation has requisite
                    y                                                q
  miscibility for successful CO2 enhancement
 Project assessment milestones:
  – Laboratory tests ongoing until July 2012

  – Physical injectivity test in May 2012

  – 5 well pilot project t start i FY13
        ll il t     j t to t t in


       Potential additional proved reserves of 30 to 50 MMbbls
                                                                               8

10

Australian Onshore Assets
Palm Valley
 145 km SW of Alice Springs
 11 Bcf of proved gas reserves and
    14 Bcf of probable gas reserves
 ~$100 m revenue contract over 17
    years with price upside
 100% owner / operator
 Connected to Darwin pipeline

Dingo
   65 km south of Alice Springs
   Material gas resource
   3 appraisal wells (’84 and ’90)
   100% owner / operator
   Marketing gas to mining industry

Mereenie
 Opportunity to earn up to A$17.5
    million in bonus payments from
    Santos                             9

11

Longer Term: Bonaparte Basin

NT/P82
 Long term development
  opportunity
 Potential reserves of ~3
  Tcf
 100% held exploration
  block
 3D seismic survey to be
  conducted in Q1 FY13
 1 exploration well by
    e p o at o   e
  2015


                               10

12

Longer Term: UK Shale
                                                     Northern operated (22.5% – 40%)
            240,000 net acres – 12 licenses
                                                      Markwells Wood – production
                                                       test ongoing
                                                      Several drilling prospects
                                                       identified
                                                      PEDL 240 (Isle of Wight) –
                                                       Wytch Farm extension play


                                                     Celtique operated (50%)
                                                      Acquired 175 km 2D seismic in
                                                       July 2011
                                                      Conventional plays: shallow oil
                                                       and deep gas
                                                      Unconventional plays: Shale oil
                                                       and gas potential in Liassic and
                                                       Kimmeridge shales
  Magellan operated :   3 licenses,   100% WI
  Celtique operated :   4 licenses,   50% WI
  Northern operated :   5 licenses,   22.5%-40% WI   Magellan operated (100%)
                                                      Deep gas potential at Horse Hill
                                                                                         11

13

Historical Financials1

                                 Revenue                    Net income (loss)                          EBITDAX

               28.5


                                                              18.2
                                    11.7                                                                     11.7
  $m


                         (1.4)
                                                                                   (4.8)
                                                                                                                      (8.2)   (7.5)


                                                                        (32.4)


                       FY10                                           FY11                                March 2012 YTD
Production
  Oil (Mbbls)             139                                          123                                              99
  Gas (Bcf)               3.4
                          34                                           0.7
                                                                       07                                               0.4
                                                                                                                        04
  Total (Mboe)            711                                          241                                              166
  boepd                  1,947                                         661                                              606

   1. June 30 fiscal year end.
   2. See Appendix: EBITDAX Reconciliation for reconciliation to net income and for further information on EBITDAX.                   12

14

Operational Milestones
Milestone                                           FY2013               FY2014
                                        Sep   Dec            Mar   Jun

Poplar
  Charles infill – EPU 119 and others

  Amsden – EPU 117 testing

  VAALCO – three test wells

  CO2-EOR – laboratory testing

  CO2-EOR – pilot


Australia
  Palm Valley – new gas contracts

  Dingo – develop marketing strategy

  NT/P82 – 3D seismic


UK
  Markwells Wood – production testing

  Unconventional – assessment

                                                                              13

15

Poised for Improved Cash Flow

12-Month revenue enhancement opportunities
 Replacement gas contracts for Palm Valley
 Increased Charles production
 Amsden potential production
 VAALCO potential production


12-Month operating cost savings
 Lower Palm Valley operating costs
 Eli i t d M
  Eliminated Mereenie operating costs
                   i       ti      t
 Reduced G&A expenses
 Australian stock exchange listing expenses

                                               14

16

Appendix


       15

17

EBITDAX Reconciliation
       EBITDAX: Non-GAAP financial measure and reconciliation to net income (loss)
                                                                                 Fiscal Years Ended June 30,             Nine Months Ended March 31,
                                                                                  2011                2010                 2012              2011
                                                                                                            (In thousands)
Net (loss) attributable to Magellan                                          $       (32,432)    $         (1,446) $           (8,207)    $       (5,560)
Depletion, depreciation, amortization, and accretion expense                            2,890                5,428               1,242              1,694
Exploration expense                                                                     2,854                1,273               3,619              1,481
Stock-based compensation expense                                                        1,670                6,582               1,282              1,812
Foreign transaction loss (gain)                                                           951                  677             (1,045)                606
Impairment expense                                                                        173                2,050
                                                                                                             2 050                    -               123
Loss on Evans Shoal                                                                    15,893                      -                  -                  -
(Gain) on sale of assets                                                                (969)              (6,817)             (4,029)              (954)
Warrant expense                                                                              -               4,276                    -                  -
Net interest (income)                                                                   (923)                      -             (357)              (659)
Other (income)                                                                               -             (3,013)                  (5)                  -
Income tax provision (benefit)                                                          5,141
                                                                                        5 141                2,646
                                                                                                             2 646                    -           (1,502)
                                                                                                                                                  (1 502)
Net (income) loss attributable to non-controlling interest in subsidiaries                 (5)                   11                (15)               (16)
EBITDAX                                                                      $        (4,757)    $         11,667   $          (7,515)    $       (2,974)


We define EBITDAX as net (loss) attributable to Magellan, plus (1) depletion, depreciation, amortization, and accretion expense, (2) exploration
expense, (3) stock based compensation expense, (4) foreign transaction loss (gain), (5) impairment expense, (6) loss on Evans Shoal, (7) (gain) on
sale of assets, (8) warrant expense, (9) net i t
   l f       t              t                 t interest (i
                                                       t (income), (10) other (i
                                                                )        th (income), (11) i
                                                                                   )       income t provision (b
                                                                                                  tax    i i (benefit), and (12) net (i
                                                                                                                    fit)  d        t (income) l
                                                                                                                                            ) loss
attributable to non-controlling interest in subsidiaries. EBITDAX is not a measure of net income or cash flow as determined by GAAP, and excludes
certain items that we believe affect the comparability of operating results.
Our EBITDAX measure provides additional information which may be used to better understand our operations. EBITDAX is one of several metrics
that we use as a supplemental financial measurement in the evaluation of our business and should not be considered as an alternative to, or more
meaningful than, net income (loss) as an indicator of our operating performance. Certain items excluded from EBITDAX are significant components in
understanding and assessing a company's fi
   d t di         d         i              ' financial performance, such as th hi t i cost of d
                                                    i l   f              h    the historic   t f depreciable and d l t bl assets. EBITDAX, as used
                                                                                                        i bl   d depletable    t EBITDAX          d
by us, may not be comparable to similarly titled measures reported by other companies. We believe that EBITDAX is a widely followed measure of
operating performance and is one of many metrics used by our management team and by other users of our consolidated financial statements. For
example, EBITDAX can be used to assess our operating performance and return on capital in comparison to other independent exploration and
production companies without regard to financial or capital structure, and to assess the financial performance of our assets and our company without
regard to historical cost basis and items affecting the comparability of period to period operating results.
                                                                                                                                                       16

More Related Content

Magellan Petroleum Investor Presentation

  • 1. Building Shareholder Returns by Maximizing the Potential of Currently Held Assets NASDAQ: MPET July 2012
  • 2. Forward Looking Statements This presentation contains forward-looking statements that involve risks and uncertainties. Our forward-looking statements express our current expectations or forecasts of possible future results or events, including projections of future performance, statements of management’s plans and objectives, future contracts, and forecasts of trends and other matters. Forward-looking statements speak only as of the date of this presentation, and we undertake no obligation to update or revise such statements to reflect new circumstances or unanticipated events as they occur, except as may be required by securities laws You can identify these statements by the fact that they do not relate strictly to historic or current facts and often use words laws. such as “anticipate”, “estimate”, “expect”, “believe”, “will”, “outlook”, “project”, and other words and expressions of similar meaning. No assurance can be given that the results expressed or implied by any forward-looking statements will be achieved, and actual results could be affected by one or more factors, which could cause them to differ materially. For these statements, we claim the protection of the safe harbor for forward-looking statements contained in the Private Securities Litigation Reform Act of 1995. Among these risks and uncertainties are: (1) the ability of Magellan to fully realize the expected benefits from the asset swap with Santos in the Amadeus B i and th related gas sales agreement; (2) whether th C A d Basin d the l t d l t h th the Company can successfully achieve cost savings while d li i revenue f ll hi t i hil delivering growth; (3) whether the workovers, recompletions, and other drilling at Poplar will result in increased production and cash generation and/or will otherwise successfully assist in the development of Poplar; (4) whether a CO2 enhanced recovery program in the Charles formation will be viable; and (5) the production levels from the properties in which Magellan, through its subsidiaries, have interests, the recoverable reserves at those properties, and the prices that will ultimately be applied to the sale of such reserves. For a more complete discussion of the risk factors that may apply to any forward looking statements, you are directed to the Risk Factors section of the Company’s Form 10-K for the year ended June 30, 2011 and subsequent form 10-Q’s. Any forward-looking information provided in this presentation should be considered with these factors in mind. Although 10 Q s. forward looking Magellan may from time to time voluntarily update its prior forward looking statements, Magellan assumes no obligation to update any forward-looking statements contained in this presentation, whether as a result of new information, future events, or otherwise, except as may be required by securities laws. Reserves The U.S. Securities and Exchange Commission permits oil and gas companies, in their filings with the SEC, to disclose only proved, probable, and possible reserves. We may use in this presentation the term "reserves" or "potential reserves" in connection with quantities of oil and natural gas that we cannot include in our SEC filings. Reserves are estimated remaining quantities of oil and natural gas and related substances anticipated to be economically producible, as of a given date, by application of development projects to known accumulations (subject to other conditions). Potential reserves are our internal estimates of quantities of oil and natural gas that are potentially recoverable. Quantities of reserves and potential reserves are by their nature significantly more uncertain than proved probable and possible reserves and accordingly are subject to substantially greater risk proved, probable, reserves, of not actually being realized by Magellan. 1
  • 3. Magellan Is… …executing a turnaround strategy focused on maximizing the value of existing oil and gas assets in the United States, Australia, and the United Kingdom 2
  • 4. Investment Considerations  Pro forma cash and equivalents of approximately $45 million $ 61 m  More than 10 MMBoe net proved reserves  Several near-term opportunities to significantly increase reserves $ 45 m Adj (2)  22 000 net unitized acres covering Poplar 22,000 Dome, the largest geologic structure in the western Williston Basin, Montana  Rationalization of Australian natural gas assets g Cash, generates long-term stable revenue with 31 Mar (2) potential upside  Long-term potential from onshore UK and off- shore A t li projects h Australia j t  Lower fixed operating costs in FY131; most Market cap Cash capex discretionary (25 Jul, $1.14/sh) ($0.83/sh)  Experienced management team 1. June 30 fiscal year end. 2. Cash includes Santos asset swap proceeds. Transaction adjustments received in Q4 FY12. 3
  • 5. Turnaround Leadership Robin West (65) – Chairman Tom Wilson (60) – CEO  Founder, CEO of PFC Energy  Former President of KMOC and Anderman  Former Reagan Administration Assistant International Secretary of the Interior (1981-83),  Former First Vice President and director of responsible for U.S. offshore oil policy Young Energy Prize  Member of National Petroleum Council and  Previously, led new international strategy Council on Foreign Relations for Apache and served as a Project  Director of Key Energy Services and Manager for Shell Oil formerly of Cheniere Energy Antoine Lafargue (37) – CFO Randy Pharo (59) – General Counsel & Secretary  Former CFO of Falcon Gas Storage based in Houston, TX ,  Former General Counsel of SM Energy gy  Previously, a principal with Arcapita, a  Member of management team that grew private equity fund focused on the energy SM market cap. from ~$120 m to ~$4 bn and infrastructure sectors  Over 32 years of in-house and outside  Previously held investment banking counsel oil and gas legal experience positions with DLJ/Credit Suisse and Bank of America 4
  • 6. Poplar  22,000 net unitized acres covering largest geologic structure in western Williston Basin  Substantially all acreage held by production, and capex is mainly discretionary  Bakken Play is moving west t i t to Poplar 5
  • 7. Poplar Judith River  Shallow gas opportunity Greenhorn  Oil potential – similar to Eagleford play Amsden  New oil pool discovery Jan 12  First well in development Tyler  4 current wells  Additional potential Charles  250 bbls/day  CO2-EOR: pilot project in FY13 EOR: Several reserve development opportunities 6
  • 8. Poplar – VAALCO Farm-Out  VAALCO farm-out in Sep 2011 to explore and develop deeper formations at Poplar – 100% carry f 3 wells i calendar 2012 for ll in l d – 35% interest in all wells to Magellan  Objective and rationale: – Prove up reserves and value of deeper formations of Poplar, with limited capital exposure through the exploration phase – Remain focused on Charles and shallower formations – Benefit from VAALCO’s horizontal well drilling expertise  Timing: – First well drilled in Q1 and completion operations will be completed by July - preliminary results encouraging – Second well commenced as a horizontal well to test Bakken/Three Forks in June 2012 7
  • 9. Poplar – CO2 Enhanced Oil Recovery  Evidence points to Charles formation being a prime candidate for CO2 enhanced oil recovery program  Offers the potential to increase reserves from current 10 MMbbls to 40 to 60 MMbbls  Initial miscibility tests confirm oil from Charles formation has requisite y q miscibility for successful CO2 enhancement  Project assessment milestones: – Laboratory tests ongoing until July 2012 – Physical injectivity test in May 2012 – 5 well pilot project t start i FY13 ll il t j t to t t in Potential additional proved reserves of 30 to 50 MMbbls 8
  • 10. Australian Onshore Assets Palm Valley  145 km SW of Alice Springs  11 Bcf of proved gas reserves and 14 Bcf of probable gas reserves  ~$100 m revenue contract over 17 years with price upside  100% owner / operator  Connected to Darwin pipeline Dingo  65 km south of Alice Springs  Material gas resource  3 appraisal wells (’84 and ’90)  100% owner / operator  Marketing gas to mining industry Mereenie  Opportunity to earn up to A$17.5 million in bonus payments from Santos 9
  • 11. Longer Term: Bonaparte Basin NT/P82  Long term development opportunity  Potential reserves of ~3 Tcf  100% held exploration block  3D seismic survey to be conducted in Q1 FY13  1 exploration well by e p o at o e 2015 10
  • 12. Longer Term: UK Shale Northern operated (22.5% – 40%) 240,000 net acres – 12 licenses  Markwells Wood – production test ongoing  Several drilling prospects identified  PEDL 240 (Isle of Wight) – Wytch Farm extension play Celtique operated (50%)  Acquired 175 km 2D seismic in July 2011  Conventional plays: shallow oil and deep gas  Unconventional plays: Shale oil and gas potential in Liassic and Kimmeridge shales Magellan operated : 3 licenses, 100% WI Celtique operated : 4 licenses, 50% WI Northern operated : 5 licenses, 22.5%-40% WI Magellan operated (100%)  Deep gas potential at Horse Hill 11
  • 13. Historical Financials1 Revenue Net income (loss) EBITDAX 28.5 18.2 11.7 11.7 $m (1.4) (4.8) (8.2) (7.5) (32.4) FY10 FY11 March 2012 YTD Production Oil (Mbbls) 139 123 99 Gas (Bcf) 3.4 34 0.7 07 0.4 04 Total (Mboe) 711 241 166 boepd 1,947 661 606 1. June 30 fiscal year end. 2. See Appendix: EBITDAX Reconciliation for reconciliation to net income and for further information on EBITDAX. 12
  • 14. Operational Milestones Milestone FY2013 FY2014 Sep Dec Mar Jun Poplar Charles infill – EPU 119 and others Amsden – EPU 117 testing VAALCO – three test wells CO2-EOR – laboratory testing CO2-EOR – pilot Australia Palm Valley – new gas contracts Dingo – develop marketing strategy NT/P82 – 3D seismic UK Markwells Wood – production testing Unconventional – assessment 13
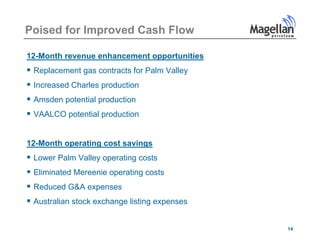
  • 15. Poised for Improved Cash Flow 12-Month revenue enhancement opportunities  Replacement gas contracts for Palm Valley  Increased Charles production  Amsden potential production  VAALCO potential production 12-Month operating cost savings  Lower Palm Valley operating costs  Eli i t d M Eliminated Mereenie operating costs i ti t  Reduced G&A expenses  Australian stock exchange listing expenses 14
  • 16. Appendix 15
  • 17. EBITDAX Reconciliation EBITDAX: Non-GAAP financial measure and reconciliation to net income (loss) Fiscal Years Ended June 30, Nine Months Ended March 31, 2011 2010 2012 2011 (In thousands) Net (loss) attributable to Magellan $ (32,432) $ (1,446) $ (8,207) $ (5,560) Depletion, depreciation, amortization, and accretion expense 2,890 5,428 1,242 1,694 Exploration expense 2,854 1,273 3,619 1,481 Stock-based compensation expense 1,670 6,582 1,282 1,812 Foreign transaction loss (gain) 951 677 (1,045) 606 Impairment expense 173 2,050 2 050 - 123 Loss on Evans Shoal 15,893 - - - (Gain) on sale of assets (969) (6,817) (4,029) (954) Warrant expense - 4,276 - - Net interest (income) (923) - (357) (659) Other (income) - (3,013) (5) - Income tax provision (benefit) 5,141 5 141 2,646 2 646 - (1,502) (1 502) Net (income) loss attributable to non-controlling interest in subsidiaries (5) 11 (15) (16) EBITDAX $ (4,757) $ 11,667 $ (7,515) $ (2,974) We define EBITDAX as net (loss) attributable to Magellan, plus (1) depletion, depreciation, amortization, and accretion expense, (2) exploration expense, (3) stock based compensation expense, (4) foreign transaction loss (gain), (5) impairment expense, (6) loss on Evans Shoal, (7) (gain) on sale of assets, (8) warrant expense, (9) net i t l f t t t interest (i t (income), (10) other (i ) th (income), (11) i ) income t provision (b tax i i (benefit), and (12) net (i fit) d t (income) l ) loss attributable to non-controlling interest in subsidiaries. EBITDAX is not a measure of net income or cash flow as determined by GAAP, and excludes certain items that we believe affect the comparability of operating results. Our EBITDAX measure provides additional information which may be used to better understand our operations. EBITDAX is one of several metrics that we use as a supplemental financial measurement in the evaluation of our business and should not be considered as an alternative to, or more meaningful than, net income (loss) as an indicator of our operating performance. Certain items excluded from EBITDAX are significant components in understanding and assessing a company's fi d t di d i ' financial performance, such as th hi t i cost of d i l f h the historic t f depreciable and d l t bl assets. EBITDAX, as used i bl d depletable t EBITDAX d by us, may not be comparable to similarly titled measures reported by other companies. We believe that EBITDAX is a widely followed measure of operating performance and is one of many metrics used by our management team and by other users of our consolidated financial statements. For example, EBITDAX can be used to assess our operating performance and return on capital in comparison to other independent exploration and production companies without regard to financial or capital structure, and to assess the financial performance of our assets and our company without regard to historical cost basis and items affecting the comparability of period to period operating results. 16