Location via proxy:   [ UP ]  
[Report a bug]   [Manage cookies]                
SlideShare a Scribd company logo

1

Research Design: Definition A  research design  is a framework or blueprint for conducting the marketing research project.  It details the procedures necessary for obtaining the information needed to structure or solve marketing research problems.

2

Components of a Research Design Define the information needed. Design the exploratory, descriptive, and/or causal phases of the research. Specify the measurement and scaling procedures. Construct and pretest a questionnaire (interviewing form) or an appropriate form for data collection. Specify the sampling process and sample size. Develop a plan of data analysis.

3

Classification of Marketing Research Designs Single Cross-Sectional Design Multiple Cross-Sectional Design Fig. 3.1 Research Design Conclusive Research Design Exploratory Research Design Descriptive Research Causal  Research Cross-Sectional Design Longitudinal Design

4

Exploratory & Conclusive Research Differences Objective: Character-istics: Findings /Results: Outcome: To provide insights and understanding. Information needed is defined only loosely. Research process is flexible and unstructured.  Sample is small and non-representative.  Analysis of primary data is qualitative. Tentative. Generally followed by further exploratory or conclusive research. To test specific hypotheses and examine relationships. Information needed is clearly defined. Research process is formal and structured. Sample is large and representative. Data analysis is quantitative. Conclusive. Findings used as input into decision making. Exploratory Conclusive Table 3.1

5

A Comparison of Basic Research Designs Objective: Characteristics: Methods: Discovery of ideas and insights Flexible, versatile Often the front end of total research design Expert surveys Pilot surveys Secondary data Qualitative research Describe market characteristics or functions Marked by the prior formulation of specific hypotheses Preplanned and structured design Secondary data Surveys Panels Observation and other data Determine cause and effect relationships Manipulation of one or more independent variables Control of other mediating variables Experiments Exploratory Descriptive Causal Table 3.2

6

Uses of Exploratory Research Formulate a problem or define a problem more precisely. Identify alternative courses of action. Develop hypotheses. Isolate key variables and relationships for further examination. Gain insights for developing an approach to the problem. Establish priorities for further research.

7

Methods of Exploratory Research Survey of experts. Pilot surveys. Secondary data analyzed in a qualitative way. Qualitative research.

8

Use of Descriptive Research To describe the characteristics of relevant groups, such as consumers, salespeople, organizations, or market areas.  To estimate the percentage of units in a specified population exhibiting a certain behavior.  To determine the perceptions of product characteristics. To determine the degree to which marketing variables are associated. To make specific predictions

9

Methods of Descriptive Research Secondary data analyzed in a quantitative as opposed to a qualitative manner. Surveys. Panels. Observational and other data.

10

Cross-sectional Designs Involve the collection of information from any given sample of population elements only once.  In  single cross-sectional designs,  there is only one sample of respondents and information is obtained from this sample only once. In  multiple cross-sectional designs , there are two or more samples of respondents, and information from each sample is obtained only once.  Often, information from different samples is obtained at different times.  Cohort analysis  consists of a series of surveys conducted at appropriate time intervals, where the cohort serves as the basic unit of analysis.  A cohort is a group of respondents who experience the same event within the same time interval.

11

Longitudinal Designs A fixed sample (or samples) of population elements is measured repeatedly on the same variables. A longitudinal design differs from a cross-sectional design in that the sample or samples remain the same over time.

12

Relative Advantages and Disadvantages of  Longitudinal and Cross-Sectional Designs Evaluation Criteria Cross-Sectional Design Longitudinal Design Detecting Change Large amount of data collection Accuracy Representative Sampling Response bias - - - + + + + + - - Note: A “+” indicates a relative advantage over the other design, whereas a “-” indicates a relative disadvantage. Table 3.4

13

Uses of Casual Research To understand which variables are the cause (independent variables) and which variables are the effect (dependent variables) of a phenomenon. To determine the nature of the relationship between the causal variables and the effect to be predicted. METHOD: Experiments.

14

Potential Sources of Error in Research Designs Fig. 3.2 Surrogate Information Error Measurement Error Population Definition Error Sampling Frame Error Data Analysis Error Respondent Selection Error Questioning Error Recording Error Cheating Error Inability Error Unwillingness Error Total Error Non-sampling  Error Random Sampling Error Non-response  Error Response  Error Interviewer  Error Respondent  Error Researcher  Error

15

Errors in Marketing Research The  total error  is the variation between the true mean value in the population of the variable of interest and the observed mean value obtained in the marketing research project.  Random sampling error  is the variation between the true mean value for the population and the true mean value for the original sample.  Non-sampling errors  can be attributed to sources other than sampling, and they may be random or nonrandom: including errors in problem definition, approach, scales, questionnaire design, interviewing methods, and data preparation and analysis.  Non-sampling errors consist of non-response errors and response errors. Non-response error  arises when some of the respondents included in the sample do not respond.  Response error  arises when respondents give inaccurate answers or their answers are misrecorded or misanalyzed.

More Related Content

Malhotra02.....

  • 1. Research Design: Definition A research design is a framework or blueprint for conducting the marketing research project. It details the procedures necessary for obtaining the information needed to structure or solve marketing research problems.
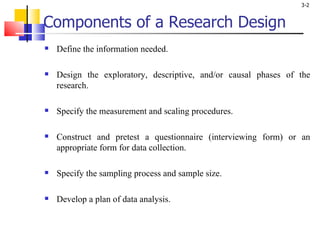
  • 2. Components of a Research Design Define the information needed. Design the exploratory, descriptive, and/or causal phases of the research. Specify the measurement and scaling procedures. Construct and pretest a questionnaire (interviewing form) or an appropriate form for data collection. Specify the sampling process and sample size. Develop a plan of data analysis.
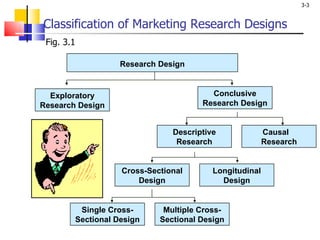
  • 3. Classification of Marketing Research Designs Single Cross-Sectional Design Multiple Cross-Sectional Design Fig. 3.1 Research Design Conclusive Research Design Exploratory Research Design Descriptive Research Causal Research Cross-Sectional Design Longitudinal Design
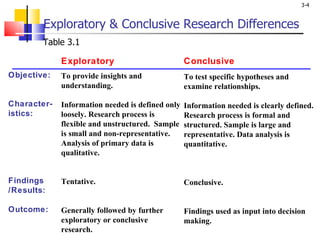
  • 4. Exploratory & Conclusive Research Differences Objective: Character-istics: Findings /Results: Outcome: To provide insights and understanding. Information needed is defined only loosely. Research process is flexible and unstructured. Sample is small and non-representative. Analysis of primary data is qualitative. Tentative. Generally followed by further exploratory or conclusive research. To test specific hypotheses and examine relationships. Information needed is clearly defined. Research process is formal and structured. Sample is large and representative. Data analysis is quantitative. Conclusive. Findings used as input into decision making. Exploratory Conclusive Table 3.1
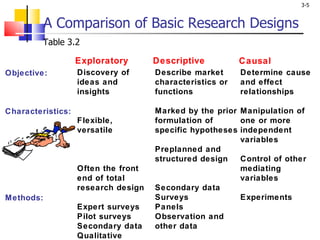
  • 5. A Comparison of Basic Research Designs Objective: Characteristics: Methods: Discovery of ideas and insights Flexible, versatile Often the front end of total research design Expert surveys Pilot surveys Secondary data Qualitative research Describe market characteristics or functions Marked by the prior formulation of specific hypotheses Preplanned and structured design Secondary data Surveys Panels Observation and other data Determine cause and effect relationships Manipulation of one or more independent variables Control of other mediating variables Experiments Exploratory Descriptive Causal Table 3.2
  • 6. Uses of Exploratory Research Formulate a problem or define a problem more precisely. Identify alternative courses of action. Develop hypotheses. Isolate key variables and relationships for further examination. Gain insights for developing an approach to the problem. Establish priorities for further research.
  • 7. Methods of Exploratory Research Survey of experts. Pilot surveys. Secondary data analyzed in a qualitative way. Qualitative research.
  • 8. Use of Descriptive Research To describe the characteristics of relevant groups, such as consumers, salespeople, organizations, or market areas. To estimate the percentage of units in a specified population exhibiting a certain behavior. To determine the perceptions of product characteristics. To determine the degree to which marketing variables are associated. To make specific predictions
  • 9. Methods of Descriptive Research Secondary data analyzed in a quantitative as opposed to a qualitative manner. Surveys. Panels. Observational and other data.
  • 10. Cross-sectional Designs Involve the collection of information from any given sample of population elements only once. In single cross-sectional designs, there is only one sample of respondents and information is obtained from this sample only once. In multiple cross-sectional designs , there are two or more samples of respondents, and information from each sample is obtained only once. Often, information from different samples is obtained at different times. Cohort analysis consists of a series of surveys conducted at appropriate time intervals, where the cohort serves as the basic unit of analysis. A cohort is a group of respondents who experience the same event within the same time interval.
  • 11. Longitudinal Designs A fixed sample (or samples) of population elements is measured repeatedly on the same variables. A longitudinal design differs from a cross-sectional design in that the sample or samples remain the same over time.
  • 12. Relative Advantages and Disadvantages of Longitudinal and Cross-Sectional Designs Evaluation Criteria Cross-Sectional Design Longitudinal Design Detecting Change Large amount of data collection Accuracy Representative Sampling Response bias - - - + + + + + - - Note: A “+” indicates a relative advantage over the other design, whereas a “-” indicates a relative disadvantage. Table 3.4
  • 13. Uses of Casual Research To understand which variables are the cause (independent variables) and which variables are the effect (dependent variables) of a phenomenon. To determine the nature of the relationship between the causal variables and the effect to be predicted. METHOD: Experiments.
  • 14. Potential Sources of Error in Research Designs Fig. 3.2 Surrogate Information Error Measurement Error Population Definition Error Sampling Frame Error Data Analysis Error Respondent Selection Error Questioning Error Recording Error Cheating Error Inability Error Unwillingness Error Total Error Non-sampling Error Random Sampling Error Non-response Error Response Error Interviewer Error Respondent Error Researcher Error
  • 15. Errors in Marketing Research The total error is the variation between the true mean value in the population of the variable of interest and the observed mean value obtained in the marketing research project. Random sampling error is the variation between the true mean value for the population and the true mean value for the original sample. Non-sampling errors can be attributed to sources other than sampling, and they may be random or nonrandom: including errors in problem definition, approach, scales, questionnaire design, interviewing methods, and data preparation and analysis. Non-sampling errors consist of non-response errors and response errors. Non-response error arises when some of the respondents included in the sample do not respond. Response error arises when respondents give inaccurate answers or their answers are misrecorded or misanalyzed.