Management of Risk & Reward
- 1. Enterprise Risk Management Amy Brinkley Chief Risk Officer
- 2. Forward Looking Statements This presentation contains forward-looking statements, including statements about the financial conditions, results of operations and earnings outlook of Bank of America Corporation. The forward- looking statements involve certain risks and uncertainties. Factors that may cause actual results or earnings to differ materially from such forward-looking statements include, among others, the following: 1) projected business increases following process changes and other investments are lower than expected; 2) competitive pressure among financial services companies increases significantly; 3) general economic conditions are less favorable than expected; 4) political conditions including the threat of future terrorist activity and related actions by the United States abroad may adversely affect the company’s businesses and economic conditions as a whole; 5) changes in the interest rate environment reduce interest margins and impact funding sources; 6) changes in foreign exchange rates increases exposure; 7) changes in market rates and prices may adversely impact the value of financial products; 8) legislation or regulatory environments, requirements or changes adversely affect the businesses in which the company is engaged; 9) changes in accounting standards, rules or interpretations, 10) litigation liabilities, including costs, expenses, settlements and judgments, may adversely affect the company or its businesses; 11) mergers and acquisitions and their integration into the company; and 12) decisions to downsize, sell or close units or otherwise change the business mix of any of the company. For further information regarding Bank of America Corporation, please read the Bank of America reports filed with the SEC and available at www.sec.gov. 2
- 3. Our Core Capability is Managing Risk to Enable Growth • Begins with a culture of performance management and accountability • Comprehensive & dynamic: Credit, Market, Operational and Strategic • Forward-looking: Insight and information to define risk appetite and to grow Sustainable growth 3
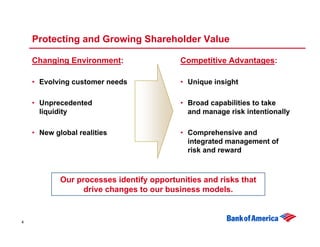
- 4. Protecting and Growing Shareholder Value Changing Environment: Competitive Advantages: • Evolving customer needs • Unique insight • Unprecedented • Broad capabilities to take liquidity and manage risk intentionally • New global realities • Comprehensive and integrated management of risk and reward Our processes identify opportunities and risks that drive changes to our business models. 4
- 5. Positioning our Economic Capital for Growth 2000 2006 Capital Net Income Capital Net Income 100% 100% 100% 100% GCSBB 29% • Capital well aligned to 48% 50% 53% earnings and clients • Supports consumer growth initiatives GCIB 50% • Focused reduction in GCIB credit capital 36% 33% 32% • Created more capital GWIM 6% velocity in GCIB 8% 8% Other 11% 15% 8% 9% 4% 5
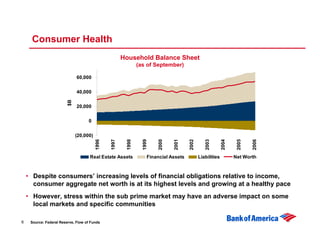
- 6. Consumer Health Household Balance Sheet (as of September) 60,000 40,000 $B 20,000 0 (20,000) 1996 1997 1998 1999 2000 2001 2002 2003 2004 2005 2006 Real Estate Assets Financial Assets Liabilities Net Worth • Despite consumers’ increasing levels of financial obligations relative to income, consumer aggregate net worth is at its highest levels and growing at a healthy pace • However, stress within the sub prime market may have an adverse impact on some local markets and specific communities 6 Source: Federal Reserve, Flow of Funds
- 7. Our Managed Consumer Portfolio is a Balanced Mix of Traditional Products Total Consumer Average Balances $553.6B Other Consumer DFS 6% 3% Consumer Finance 4% Foreign Consumer Card 5% Residential Mortgage 42% US Consumer Card 25% Home Equity 15% • 8% YOY Growth • 57% Consumer Real Estate • 30% Consumer Card 7
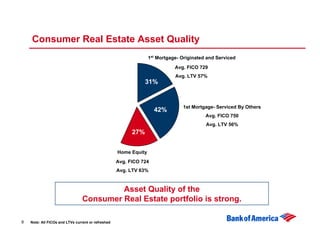
- 8. Consumer Real Estate Asset Quality 1st Mortgage- Originated and Serviced Avg. FICO 729 Avg. LTV 57% 31% 1st Mortgage- Serviced By Others 42% Avg. FICO 750 Avg. LTV 56% 27% Home Equity Avg. FICO 724 Avg. LTV 63% Asset Quality of the Consumer Real Estate portfolio is strong. 8 Note: All FICOs and LTVs current or refreshed
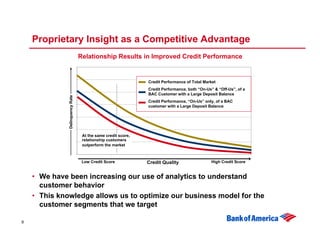
- 9. Proprietary Insight as a Competitive Advantage Relationship Results in Improved Credit Performance Credit Performance of Total Market Credit Performance, both “On-Us” & “Off-Us”, of a BAC Customer with a Large Deposit Balance Delinquency Rate Credit Performance, “On-Us” only, of a BAC customer with a Large Deposit Balance At the same credit score, relationship customers outperform the market Low Credit Score Credit Quality High Credit Score • We have been increasing our use of analytics to understand customer behavior • This knowledge allows us to optimize our business model for the customer segments that we target 9
- 10. Commercial Health Current vs. Projected S&P Earnings Growth • Corporate profits continue to grow Quarterly S&P 500 Earnings Growth Projected Growth Start of Quarter Actual (blended) Growth 30% • Credit statistic trends remain First Call Analyst 25% favorable Estimates 20% • Market liquidity is strong 15% 10% 5% E E 03 04 05 03 04 05 06 06 07 2Q 2Q 4Q 4Q 4Q 2Q 2Q 4Q 2Q Source: Thompson Financial High Grade Leverage and Coverage High Yield Leverage and Coverage Median Ratio LTM EBITDA to LTM Interest Expense Median Ratio LTM EBITDA to LTM Interest Expense Median Net Leverage Median Coverage Med Net Debt Leverage Med Coverage Median Ratio of Net Debt to LTM EBITDA Median Ratio of Net Debt to LTM EBITDA 8.0 2.7 4.3 4.1 7.5 4.1 3.9 2.5 7.0 3.9 3.7 2.3 3.7 6.5 3.5 3.5 2.1 3.3 6.0 3.3 1.9 3.1 5.5 3.1 2.9 2.9 1.7 5.0 2.7 2.7 1.5 4.5 2.5 2.5 2 4 6 8 6 0 0 2 4 96 04 06 95 97 98 99 00 01 02 03 05 -9 -9 -9 -9 -0 -9 -0 -0 -0 ar ar ar ar ar ar ar ar ar 1Q 1Q 1Q 1Q 1Q 1Q 1Q 1Q 1Q 1Q 1Q 1Q M M M M M M M M M Source: Banc of America Securities, LLC and Factset. Source: Banc of America Securities, LLC and Factset. 10
- 11. Managing Commercial Credit Risk Our Strengths Advantages in Managing Risk • Breadth of client access • Industry insights and focus • Capital markets and • Market knowledge enabling distribution an originate to distribute strategy • Integrated risk structure • Managing risk globally across products and client segments 11
- 12. Commercial Credit Risk Profile Commitments as of 12/31/06 Average Funded Commitments 4Q06 $618.0B $238.5B Business Capital 2% DFS Business Capital Aviation Aviation 4% DFS Corporate Banking 2% 1% Business Banking 0% Corporate Banking 3% 23% 4% 44% Business Banking 7% GIB Leasing GMG 5% Leasing 18% 5% CREB GIB 11% 33% 9% CB Regions CREB GMG Other 22% 14% 11% 17% Other CB Regions Commercial Banking 10% 22% Other 46% 17% Commercial Banking Other 60% 10% • Rebalanced the portfolio • Improved risk evaluation and monitoring tools 12
- 13. Commercial Credit Industry Profile Commitments by Industry 12/31/06 Technology* 3% Other* Real Estate 7% 12% Energy* 6% Media & Telecom* Diversified financials 4% 11% Food Products* 4% Commercial services Retailing & and supplies Consumer Products* 4% 9% Materials Government & public 5% education 6% Individuals and trusts 5% Capital Goods Healthcare 6% Consumer services equipment and 5% Banks & insurance* services 8% 5% • Effective management of industry and single name concentrations • Increased distribution risk in high-return leveraged finance activities • Improved revenue mix and more efficient use of capital 13
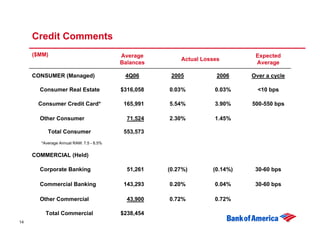
- 14. Credit Comments ($MM) Average Expected Actual Losses Balances Average CONSUMER (Managed) 4Q06 2005 2006 Over a cycle Consumer Real Estate $316,058 0.03% 0.03% <10 bps Consumer Credit Card* 165,991 5.54% 3.90% 500-550 bps Other Consumer 71,524 2.30% 1.45% Total Consumer 553,573 *Average Annual RAM: 7.5 - 8.5% COMMERCIAL (Held) Corporate Banking 51,261 (0.27%) (0.14%) 30-60 bps Commercial Banking 143,293 0.20% 0.04% 30-60 bps Other Commercial 43,900 0.72% 0.72% Total Commercial $238,454 14
- 15. Managing Market Risk VaR • Directionality New Products • Volatility • Risk forums • Correlation • New Products • Concentration Committee Market Risk Stress Analysis Counter Party Risk • Historical simulation • Ongoing due diligence • Event specific scenarios • Market focused • Hypothetical scenario • Collateral requirements • Business specific Proactive Risk Mitigation stress • Market focused • Structuring risk • Hedging • Integrated Risk Management (Market, Credit, Structuring) aligned with each business line • Risk limits set to encourage velocity and distribution 15
- 16. Improved Revenue Generation From Market Based Activities Histogram of Daily Market Related Trading Revenue 90 2005 2006 80 70 Number of Days 60 50 40 30 20 10 0 less than -20 to - -10 to 0 0 to 10 10 to 20 20 to 30 30 to 40 40 to 50 greater -20 10 than 50 Revenue ($MM) • 96% of days with positive revenue in 2006 vs. 86% in 2005 • No trading days in 2006 with losses greater than $10mm • VaR maintained at ~$41mm 16
- 17. Managing Operational Risk • Information security • Business continuity • Vendor management • Talent 17
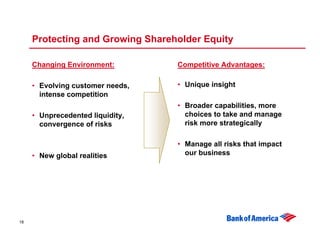
- 18. Protecting and Growing Shareholder Equity Changing Environment: Competitive Advantages: • Evolving customer needs, • Unique insight intense competition • Broader capabilities, more • Unprecedented liquidity, choices to take and manage convergence of risks risk more strategically • Manage all risks that impact • New global realities our business 18
