Mba om 08_inventory_management
- 1. Operations Management Author: Prof. Niranjana K.R. B.E. (Mech), PGDM, SSBB, LA ISO9001 & AS9100, Member – PMI & QCFI Email: niranjanakoodavalli@gmail.com
- 3. References 1. Operations Management – An Integrated Approach, by R. Dan Reid, Nada R. Sanders, 5th Edition, Wiley ,2012. 2. Operations Management For Competitive Advantage – 11th edition – Richard B. Chase, F. Robert Jacobs, Nicholas J. Aquilano 3. Operations Management, 10th edition Author(s): Jay Heizer, Barry Render 4. Production/Operations Management – 5th Ed. – Willian J. Stevenson 24-08-2016 Author: Niranjana K R 3
- 4. Operations Management Inventory Management Author: Prof. Niranjana K.R. B.E. (Mech), PGDM, SSBB, LA ISO9001 & AS9100, Member – PMI & QCFI Email: niranjanakoodavalli@gmail.com
- 5. Learning Objectives (1 of 2) After studying this chapter you should be able to - 1. Describe the different types and uses of inventory. 2. Describe the objectives of inventory management. 3. Calculate inventory performance measures. 4. Understand the relevant costs associated with inventory. 5. Perform ABC inventory control and analysis. 6. Understand the role of cycle counting in inventory record accuracy. 7. Understand the role of inventory in service organizations. Continued .. Author: Niranjana K R24-08-2016 5
- 6. Learning Objectives (2 of 2) Continued .. After studying this chapter you should be able to – 8. Calculate order quantities. 9. Evaluate the total relevant costs of different inventory policies. 10. Understand why companies don’t always use the optimal order quantity. 11. Understand how to justify smaller order sizes. 12. Calculate appropriate safety stock inventory policies. 13. Calculate order quantities for single-period inventory. Author: Niranjana K R24-08-2016 6
- 7. Just think! • What happens when a cashier of a super market scans the label of the items purchased by you? • What does the cashier do when you have purchased multiple quantities of the same item? 24-08-2016 Author: Niranjana K R 7
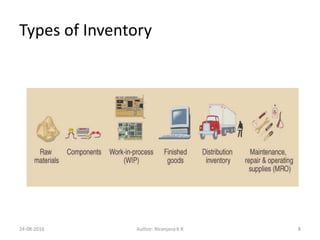
- 8. Types of Inventory 24-08-2016 8Author: Niranjana K R
- 9. Definitions • Inventory – A Stock or store of goods • Raw materials – Purchased items or extracted materials transformed into components or products. Ex.: Steel bar, Ferrous powder, Plastic, metal strip etc. • Components – Parts or subassemblies used in the final product. Ex: Capacitor, screws, nuts etc. • Work-in-process (WIP) – Items in process throughout the plant. • Finished goods – Products sold to customers. Ex.: Bycycle, stereos, CD, automobile etc. • Distribution inventory – Finished goods in the distribution system. Ex: Stored in warehouse or in transit between warehouses and consumers. 24-08-2016 Author: Niranjana K R 9
- 10. Independent vs. Dependent Demand • A major distinction in the way inventory planning and control are managed is whether demand for items in inventory is independent or dependent. • Independent demand is the Demand for items that are finished goods or other items sold to someone outside the company • Dependent demand for items in inventory that are subassemblies or component parts to be used in the production of finished goods. 24-08-2016 10Author: Niranjana K R
- 11. Six ways of using Inventory by Company’s 1. Anticipation or Seasonal - Inventory built in anticipation of future demand. 2. Fluctuation Inventory or Safety stock - Provides a cushion against unexpected demand. 3. Lot-size or cycle stock: A result of the quantity ordered or produced. 4. Transportation or Pipeline - Inventory in movement between locations. 5. Speculative or Hedge - Used to protect against some future event. 6. Maintenance, Repair, and Operating (MRO) - Items used in support of manufacturing and maintenance. 24-08-2016 11Author: Niranjana K R
- 12. Functions of Inventory Anticipation inventory Items built in anticipation of future demand. Allows company to maintain a level production strategy. Fluctuation inventory Protects against unexpected demand variations. Assures customer service levels. Lot-size inventory Results from the actual quantity purchased. Allows for lower unit costs. Transportation inventory Items in movement between locations. Inventory moves from manufacturer to distribution facilities. Speculative inventory Extra inventory built up or purchased to protect against some future events. Allows for continuous supply. MRO Includes maintenance supplies, spare parts, lubricants, cleaning agents, and daily operating supplies. Facilitates day-to-day operations. 24-08-2016 Author: Niranjana K R 12
- 13. Objectives of Inventory Management • Provide acceptable level of customer service (on-time delivery) • Allow cost-efficient operations • Minimize inventory investment 24-08-2016 13Author: Niranjana K R
- 14. Customer Service – Measures • Customer service is a company’s ability to satisfy the needs of its customers. Following are measures of Customer Service: • Percentage of orders shipped on schedule : A customer service measure appropriate for use when orders have similar value. • Percentage of line items shipped on schedule: A customer service measure appropriate when customer orders vary in number of line items ordered. • Percentage of dollar volume shipped on schedule: A customer service measure appropriate when customer orders vary in value. • Idle Time Due to Material and Component Shortages applies to internal customer service. 24-08-2016 Author: Niranjana K R 14
- 15. Cost-Efficient Operations • Use work-in-process (WIP) inventory to buffer operations • Building inventory in advance of seasonal demands • Building inventory in long production runs • Buy in larger quantities at a discount 24-08-2016 Author: Niranjana K R 15
- 16. Minimum Inventory Investment (1 of 4) • Minimum Inventory investment is measured by inventory turnover. • A measure of inventory policy effectiveness. • This ratio should be compared with that achieved by other companies in the industry. • Higher the number, the more effectively the company is using its inventory. 24-08-2016 Author: Niranjana K R 16
- 17. Minimum Inventory Investment (2 of 4) • One measure of the level of demand that can be satisfied by on-hand inventory is weeks of supply. 24-08-2016 Author: Niranjana K R 17
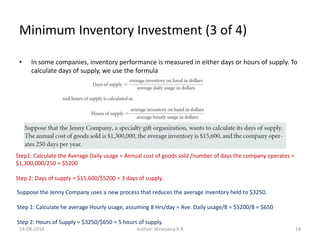
- 18. Minimum Inventory Investment (3 of 4) • In some companies, inventory performance is measured in either days or hours of supply. To calculate days of supply, we use the formula 24-08-2016 Author: Niranjana K R 18 Step1: Calculate the Average Daily usage = Annual cost of goods sold /number of days the company operates = $1,300,000/250 = $5200 Step 2: Days of supply = $15,600/$5200 = 3 days of supply. Suppose the Jenny Company uses a new process that reduces the average inventory held to $3250. Step 1: Calculate he average Hourly usage, assuming 8 Hrs/day = Ave. Daily usage/8 = $5200/8 = $650 Step 2: Hours of Supply = $3250/$650 = 5 hours of supply.
- 19. Minimum Inventory Investment (4 of 4) 24-08-2016 Author: Niranjana K R 19
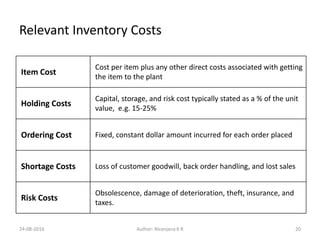
- 20. Relevant Inventory Costs Item Cost Cost per item plus any other direct costs associated with getting the item to the plant Holding Costs Capital, storage, and risk cost typically stated as a % of the unit value, e.g. 15-25% Ordering Cost Fixed, constant dollar amount incurred for each order placed Shortage Costs Loss of customer goodwill, back order handling, and lost sales Risk Costs Obsolescence, damage of deterioration, theft, insurance, and taxes. 24-08-2016 Author: Niranjana K R 20
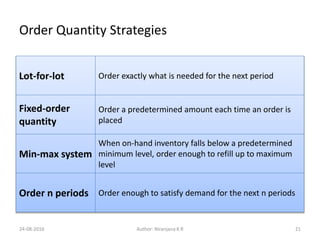
- 21. Order Quantity Strategies Lot-for-lot Order exactly what is needed for the next period Fixed-order quantity Order a predetermined amount each time an order is placed Min-max system When on-hand inventory falls below a predetermined minimum level, order enough to refill up to maximum level Order n periods Order enough to satisfy demand for the next n periods 24-08-2016 Author: Niranjana K R 21
- 22. Examples of Ordering Approaches Lot for Lot Example 1 2 3 4 5 6 7 8 Requirements 70 70 65 60 55 85 75 85 Projected-on-Hand (30) 0 0 0 0 0 0 0 Order Placement 40 70 65 60 55 85 75 85 Fixed Order Quantity Example with Order Quantity of 200 1 2 3 4 5 6 7 8 Requirements 70 70 65 60 55 85 75 85 Projected-on-Hand (30) 160 90 25 165 110 25 150 65 Order Placement 200 200 200 Min-Max Example with min.= 50 and max.= 250 units 1 2 3 4 5 6 7 8 Requirements 70 70 65 60 55 85 75 85 Projected-on-Hand (30) 180 110 185 125 70 165 90 165 Order Placement 220 140 180 160 Order n Periods with n = 3 periods 1 2 3 4 5 6 7 8 Requirements 70 70 65 60 55 85 75 85 Projected-on-Hand (30) 135 65 0 140 85 0 85 0 Order Placement 175 200 160 24-08-2016 22Author: Niranjana K R
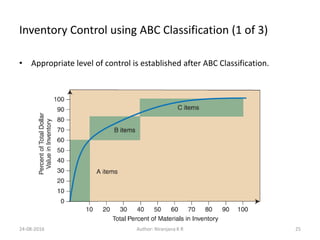
- 23. ABC Inventory Classification • ABC classification is a method for determining level of control and frequency of review of inventory items – Pareto’s law (for inventory) implies that about 20% of the inventory items will account for about 80% of the inventory value. – A Pareto analysis can be done to segment items into value categories depending on annual dollar volume. • A Items – typically 20% of the items accounting for 80% of the inventory value-use Q system • B Items – typically an additional 30% of the items accounting for 15% of the inventory value-use Q or P • C Items – Typically the remaining 50% of the items accounting for only 5% of the inventory value-use P 24-08-2016 23Author: Niranjana K R
- 24. ABC Example: the table below shows a solution to an ABC analysis. The information that is required to do the analysis is: Item #, Unit $ Value, and Annual Unit Usage. The analysis requires a calculation of Annual Usage $ and sorting that column from highest to lowest $ value, calculating the cumulative annual $ volume, and grouping into typical ABC classifications. Item Annual Usage ($) Percentage of Total $ Cumulative Percentage of Total $ Item Classification 106 16,500 34.4 34.4 A 110 12,500 26.1 60.5 A 115 4500 9.4 69.9 B 105 3200 6.7 76.6 B 111 2250 4.7 81.3 B 104 2000 4.2 85.5 B 114 1200 2.5 88 C 107 1000 2.1 90.1 C 101 960 2 92.1 C 113 875 1.8 93.9 C 103 750 1.6 95.5 C 108 600 1.3 96.8 C 112 600 1.3 98.1 C 102 500 1 99.1 C 109 500 1 100.1 C 24-08-2016 24Author: Niranjana K R
- 25. Inventory Control using ABC Classification (1 of 3) • Appropriate level of control is established after ABC Classification. 24-08-2016 Author: Niranjana K R 25
- 26. Inventory Control using ABC Classification (2 of 3) • Expensive A items need : – Very tight control – Highly accurate inventory records – Frequent or Continuous review – Continuous review system • Updates inventory balances after each inventory transaction • Keeps track of an inventory item 24/7 • EOQ model is used • B items need normal control – Moderately accurate inventory records – A reasonable time period between reviews – Periodic review system • Requires regular periodic reviews (daily, weekly, monthly) of the on-hand quantity to determine the size of the replenishment order. 24-08-2016 Author: Niranjana K R 26
- 27. Inventory Control using ABC Classification (3 of 3) • C items require the least amount of control – Possible options are: Two-bin system or an infrequent periodic review system • Two-bin system – A two-bin system splits an incoming replenishment order into two separate bins. – One bin with enough stock to satisfy demand during replenishment time is kept in the storeroom; – The other bin is placed on the manufacturing floor so that, workers can take what they need. – This second bin should have enough items to cover normal demand during the replenishment lead time. • Lead time – Time from order placement to order receipt. 24-08-2016 Author: Niranjana K R 27
- 28. Inventory Record Accuracy • Inaccurate inventory records can cause: – Lost sales – Disrupted operations – Poor customer service – Lower productivity – Planning errors and expediting • Two methods are available for checking record accuracy – Periodic counting-physical inventory – Cycle counting-daily counting of pre-specified items provides the following advantages: • Timely detection and correction of inaccurate records • Elimination of lost production time due to unexpected stock outs • Structured approach using employees trained in cycle counting 24-08-2016 Author: Niranjana K R 28
- 29. Determining Order Quantities (1 of 6) • The objectives of inventory management are – – To provide the desired level of customer service, – Enable cost-efficient operations, and – Minimize the inventory investment. • How to achieve these objectives? • We must first determine how much of an item to order at a time. 24-08-2016 Author: Niranjana K R 29
- 30. Determining Order Quantities (2 of 6) • Inventory management and control are done at the level of the individual item • This is called Stock-keeping unit (SKU) • An SKU is a specific item at a particular geographic location. • Examples: – A pair of jeans, size 32 X 32, in inventory at the plant and also eight different warehouses, represents nine different SKUs. – A pair of the same jeans held at the same locations but a different size (32 X 34) represents nine additional SKUs. – The same style of jeans in a different colour represents additional SKUs. 24-08-2016 Author: Niranjana K R 30
- 31. Determining Order Quantities (3 of 6) • Approaches for Determining SKU order: 24-08-2016 Author: Niranjana K R 31
- 32. Determining Order Quantities (4 of 6) • Lot-for-lot – Lot-for-lot is ordering exactly what you need. – Adjust the ordering quantity to our ordering needs, which ensures that you will not have leftover inventory. – We use lot-for-lot when demand is not constant and you have information about expected needs. • Fixed-order quantity – Fixed-order quantity specifies the number of units to order each time you place an order for a certain SKU or item. – The quantity may be arbitrary (ex: 100 units at a time), or it may be the result of how the item is packaged or prepared (such as 144 per box or a loaf of bread). – The advantage of this system is that it is easily understood; – The disadvantage is that it does not minimize inventory costs. 24-08-2016 Author: Niranjana K R 32
- 33. Determining Order Quantities (5 of 6) • Min-Max system – Min-Max system places a replenishment order when the on-hand inventory falls below the predetermined minimum level. – An order is placed to bring the inventory back up to the maximum inventory level. – Example: • If the minimum is set at 50 units, • The maximum is set at 250 units, • The quantity available at the time of the order is 40 units, • The order quantity is 210 units (250 − 40). • With this system, both the time between orders and the quantity ordered can vary. 24-08-2016 Author: Niranjana K R 33
- 34. Determining Order Quantities (6 of 6) • Order n periods – In Order n periods - The order quantity is determined by total demand for the item for the next n periods. • For example, – Let’s say that you have to order enough each time you place an order to satisfy your company’s requirements for the next three periods. • Requirements for the next three weeks are 60, 45, and 100, your order is for 60+45+100 = 205 units. – A concern with this system is determining the number of periods to include in the order. 24-08-2016 Author: Niranjana K R 34
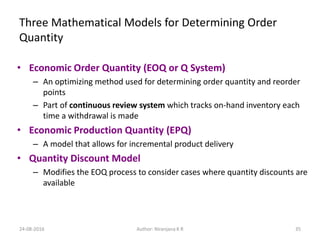
- 35. Three Mathematical Models for Determining Order Quantity • Economic Order Quantity (EOQ or Q System) – An optimizing method used for determining order quantity and reorder points – Part of continuous review system which tracks on-hand inventory each time a withdrawal is made • Economic Production Quantity (EPQ) – A model that allows for incremental product delivery • Quantity Discount Model – Modifies the EOQ process to consider cases where quantity discounts are available 24-08-2016 35Author: Niranjana K R
- 36. EOQ Model 24-08-2016 Author: Niranjana K R 36
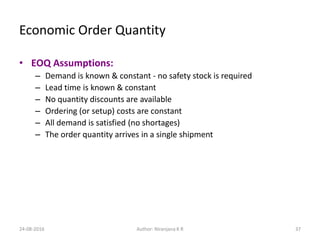
- 37. Economic Order Quantity • EOQ Assumptions: – Demand is known & constant - no safety stock is required – Lead time is known & constant – No quantity discounts are available – Ordering (or setup) costs are constant – All demand is satisfied (no shortages) – The order quantity arrives in a single shipment 24-08-2016 Author: Niranjana K R 37
- 38. EOQ: Total Cost Equation • The formula for calculating the total relevant annual costs for the basic EOQ model is: 24-08-2016 Author: Niranjana K R 38 costsetuporordering costholdingannual orderedbeoquantity t demandannual costannualtotal 2 S H Q D TC Where H Q S Q D TCEOQ
- 39. EOQ Total Costs Total annual costs = annual ordering costs + annual holding costs 24-08-2016 39Author: Niranjana K R
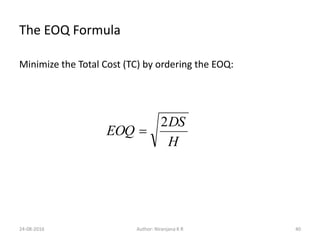
- 40. The EOQ Formula Minimize the Total Cost (TC) by ordering the EOQ: H DS EOQ 2 24-08-2016 40Author: Niranjana K R
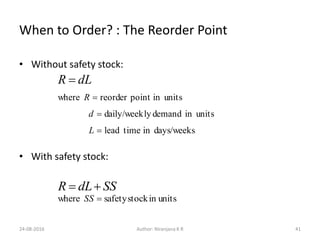
- 41. When to Order? : The Reorder Point • Without safety stock: • With safety stock: 24-08-2016 Author: Niranjana K R 41 days/weeksintimelead unitsindemandlydaily/week unitsinpointreorderwhere L d R dLR unitsinstocksafetywhere SS SSdLR
- 42. EOQ Example • Weekly demand = 240 units • No. of weeks per year = 52 • Ordering cost = $50 • Unit cost = $15 • Annual carrying charge = 20% • Lead time = 2 weeks 24-08-2016 42Author: Niranjana K R
- 43. EOQ Example Solution 24-08-2016 Author: Niranjana K R 43 yearunitsD /480,1224052 yearperunitperH 3$152.0 units H DS Q 64598.644 3 50480,1222 unitsdLR H Q S Q D TC 4802240 $1,934.945.96744.967 3 2 645 50 645 480,12 2
- 44. EPQ (Economic Production Quantity) Assumptions • Same as the EOQ except: inventory arrives in increments & is drawn down as it arrives 24-08-2016 44Author: Niranjana K R
- 45. EPQ Equations • Adjusted total cost: • Maximum inventory: • Adjusted order quantity: H I S Q D TC MAX EPQ 2 p d QIMAX 1 p d H DS EPQ 1 2 24-08-2016 45Author: Niranjana K R
- 46. EPQ Example • Annual demand = 18,000 units • Production rate = 2500 units/month • Setup cost = $800 • Annual holding cost = $18 per unit • Lead time = 5 days • No. of operating days per month = 20 24-08-2016 46Author: Niranjana K R
- 47. EPQ Example Solution (1 of 2) monthunitspmonthunitsd /2500;/1500 12 000,18 units p d H DS Q 2000 2500 1500 118 800000,182 1 2 units p d QIMAX 800 2500 1500 120001 400,14200,7200,7 18 2 800 800 2000 000,18 2 H I S Q D TC MAX 24-08-2016 47Author: Niranjana K R
- 48. • The reorder point: • With safety stock of 200 units: EPQ Example Solution (2 of 2) unitsSSdLR 5752005 20 1500 24-08-2016 Author: Niranjana K R 48 unitsdLR 3755 20 1500
- 49. Quantity Discount Model Assumptions • Same as the EOQ, except: – Unit price depends upon the quantity ordered • Adjusted total cost equation: PDH Q S Q D TCQD 2 24-08-2016 49Author: Niranjana K R
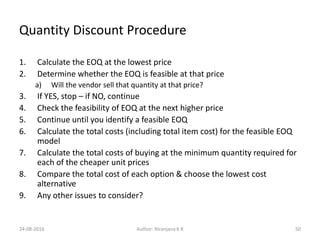
- 50. Quantity Discount Procedure 1. Calculate the EOQ at the lowest price 2. Determine whether the EOQ is feasible at that price a) Will the vendor sell that quantity at that price? 3. If YES, stop – if NO, continue 4. Check the feasibility of EOQ at the next higher price 5. Continue until you identify a feasible EOQ 6. Calculate the total costs (including total item cost) for the feasible EOQ model 7. Calculate the total costs of buying at the minimum quantity required for each of the cheaper unit prices 8. Compare the total cost of each option & choose the lowest cost alternative 9. Any other issues to consider? 24-08-2016 50Author: Niranjana K R
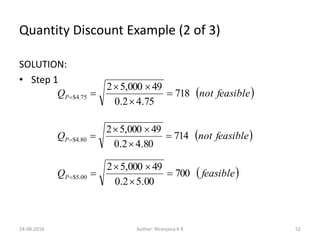
- 51. Quantity Discount Example (1 of 3) • Annual Demand = 5000 units • Ordering cost = $49 • Annual carrying charge = 20% • Unit price schedule: Quantity Unit Price 0 to 999 $5.00 1000 to 1999 $4.80 2000 and over $4.75 24-08-2016 51Author: Niranjana K R
- 52. SOLUTION: • Step 1 feasiblenotQP 718 75.42.0 49000,52 75.4$ feasiblenotQP 714 80.42.0 49000,52 80.4$ feasibleQP 700 00.52.0 49000,52 00.5$ 24-08-2016 52Author: Niranjana K R Quantity Discount Example (2 of 3)
- 53. • Step 2 700,25$500000.500.52.0 2 700 49 700 000,5 700 QTC 725,24$500080.480.42.0 2 1000 49 1000 000,5 1000 QTC 50.822,24$500075.475.42.0 2 2000 49 2000 000,5 2000 QTC 24-08-2016 53Author: Niranjana K R Quantity Discount Example (3 of 3)
- 54. What if Demand is Uncertain? 24-08-2016 54Author: Niranjana K R
- 55. Safety Stock and Service Level • Order-cycle service level is the probability that demand during lead time won’t exceed on-hand inventory. • Risk of a stockout = 1 – (service level) • More safety stock means greater service level and smaller risk of stockout 24-08-2016 55Author: Niranjana K R
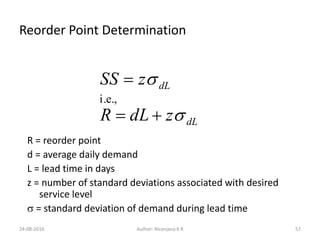
- 56. Safety Stock and Reorder Point • Without safety stock: • With safety stock: daysintimelead unitsindemanddaily unitsinpointreorderwhere L d R dLR unitsinstocksafetywhere SS SSdLR 24-08-2016 56Author: Niranjana K R
- 57. Reorder Point Determination R = reorder point d = average daily demand L = lead time in days z = number of standard deviations associated with desired service level s = standard deviation of demand during lead time dL dL zdLR zSS s s i.e., 24-08-2016 57Author: Niranjana K R
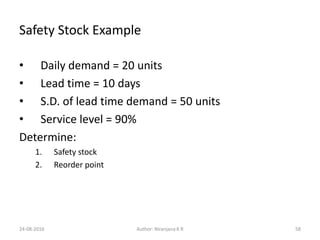
- 58. Safety Stock Example • Daily demand = 20 units • Lead time = 10 days • S.D. of lead time demand = 50 units • Service level = 90% Determine: 1. Safety stock 2. Reorder point 24-08-2016 58Author: Niranjana K R
- 59. Step 1 – determine z Step 2 – determine safety stock Step 3 – determine reorder point Safety Stock Solution units264641020 SSdLR 28.1:BAppendixFrom z units645028.1 SS 24-08-2016 59Author: Niranjana K R
- 60. 24-08-2016 60Author: Niranjana K R
- 61. 24-08-2016 Author: Niranjana K R 61
Editor's Notes
- Companies can achieve cost-efficient operations by using inventory in the following ways: First, Companies use work-in-process (WIP) inventory to buffer operations. Suppose one of the Hewlett-Packard (HP) printed circuit board (PCB) manufacturing facilities runs two or more operations in a sequence at different rates of output. In this case, buffer inventories build up between the workstations to ensure that each of the operations runs efficiently. For example, PCBs flow from Ken’s workstation (tasks take 120 seconds) to Barbara’s workstation (tasks take only 90 seconds). If there are no PCBs between the two workstations, Barbara will be idle for 30 seconds out of every 120 seconds because she finishes her tasks 30 seconds before Ken finishes his. If the floor supervisor, Maria, ensures that there is buffer stock between the workstations, Barbara’s idle time will be eliminated so she can produce more PCBs. Second, inventories allow manufacturing organizations to maintain a level workforce throughout the year despite seasonal demand for production. A company can do this by building inventory in advance of seasonal demands. This in turn allows the company to maintain a level workforce throughout the year and to reduce the costs of overtime, hiring and firing, training, subcontracting, and additional capacity. Third, by building inventory in long production runs, the setup cost is spread over a larger number of units, decreasing the per unit setup cost. Setup costs include the cost of scrap (wasted material and labor), calibration, and downtime to prepare the equipment and materials for the next product to be manufactured. Longer runs mean that the equipment does not need as many setups, so less machine time is lost preparing for production. Fourth, a company that is willing to acquire inventory can buy in larger quantities at a discount. These larger purchases decrease the ordering cost per unit. For example, the Rustic Garden Furniture Company needs 50,000 pieces of wrought iron annually. Rustic’s supplier has offered a unit price of $1.10 if Rustic buys the wrought iron in orders of 10,000 or more pieces at a time. If Rustic chooses to buy in smaller quantities, the unit price is $1.29.


