Measures of Epidemiolgy GMC CLASS.pptx
•
0 likes•82 views

This document discusses various measures used in epidemiology to quantify disease frequency and mortality. It defines rates, ratios and proportions as the main measures of frequency. Rates include crude death rate, specific rates and standardized rates. Ratios include odds ratio and relative risk. Proportions measure parts of a whole. Incidence and prevalence are discussed as measures of morbidity along with their uses. Mortality indicators covered include crude death rate, specific death rates, case fatality rates and proportional mortality. Standardized death rates are also defined.
Report
Share


Measures of Epidemiolgy GMC CLASS.pptx
- 1. MBBS.USMLE, DPH, Dip-Card, M.Phil, FCPS Professor Community Medicine/Epidemiolgy Ex- Professor Community Medicine UmulQurrah University Makka Saudi Arabia
- 3. Measures in Epidemiology Numbers of cases Proportional mortality Proportional mortality ratio Actual/Crude prevalence and incidence rates Specific prevalence and incidence rates Standardised rates Standardised ratios Relative risk Odds ratio Attributable risks Numbers needed to treat and prevent Life years lost Disability adjusted life year (DALY) Quality adjusted life year (QALY) 2/4/2018 3 DR M Tauseef Javed SIMS Lahore
- 4. Components of epidemiology:- Disease frequency. Distribution determinants. Disease frequency. Distribution. Determinants. 2/4/2018 4 DR M Tauseef Javed SIMS Lahore
- 5. Scope of measurement:- Mortality. Morbidity. Disability. Presence & absence or distribution of.. Medical needs. Utilization of health services. Demographic variables. 2/4/2018 5 DR M Tauseef Javed SIMS Lahore
- 6. Tools of measurements- Rate Ratio Proportion 2/4/2018 6 DR M Tauseef Javed SIMS Lahore
- 7. Rate Measures the occurrence of an event or disease in a given population during a given period (one Year). (Birth rate, growth rate, accident rate) Usually expressed per 100 or per1000 population. It has a time dimension, whereas a PROPORTION does not. 2/4/2018 7 DR M Tauseef Javed SIMS Lahore
- 8. A fraction is made up of 2 numbers. The top number is called the NUMERATOR and the bottom number is called the DENOMINATOR. In the fraction ¾ the 3 is the numerator and the 4 is the denominator. 2/4/2018 8 DR M Tauseef Javed SIMS Lahore
- 9. Rate comprises- No of death in one year Death rate= -------------------- X 1000 Total mid year population Numerator Denominator. Time specification Multiplier (Numerator is part of denominator ) 2/4/2018 9 DR M Tauseef Javed SIMS Lahore
- 10. 10 Rate: when we say that there were 500 deaths from motor vehicle accidents in city A during 2014, its nothing more than counting deaths in that city during that particular year. It conveys no meaning to an epidemiologist who is interested in comparing the frequency of accidents in city A with that in city B. To allow such comparisons, the frequency must be expressed as a rate. It is the basic measure of disease occurrence 2/4/2018 DR M Tauseef Javed SIMS Lahore
- 11. 1. Rate: = No. of events in a specified period x K Pop. at risk in a specified period A rate comprises a numerator, denominator, time specification & multiplier. The time dimension is usually a calendar year. Rate is expressed per 1000, 10,000 or 100,000 selected according to convenience to avoid fractions Rate is used to estimate probability or risk of occurrence of a disease or to assess the accessibility or coverage of healthcare system. Example Crude death rate= Number of deaths in one year X1000 Mid – year Population 11 2/4/2018 DR M Tauseef Javed SIMS Lahore
- 12. Ratio The value obtained by dividing one quantity by another- X/Y. Male to female ratio. A ratio often compares two rates, death rates for women and men at a given age. 2/4/2018 12 DR M Tauseef Javed SIMS Lahore
- 13. Ratio- Ratio also expresses relation of size between the two quantities. Numerator is not part of Denominator. Expressed as X / Y. Doctor : Population ratio. Male : Female ratio. 2/4/2018 13 DR M Tauseef Javed SIMS Lahore
- 14. 14 2. Ratio: Relationship b/w 2 numbers expressed as x:y or x/y e.g ratio of males to females 2:3. The numerator is not a component of the denominator. E.g. Ratio of WBCs to RBCs is 1:600 or 1/600 Other examples include: doctor-population ratio, child-woman ratio, etc. 2/4/2018 DR M Tauseef Javed SIMS Lahore
- 15. Proportion - A part/share or number considered in comparative relation to a whole. "the proportion of greenhouse gases in the atmosphere is rising” Usually expressed as a percentage % 2/4/2018 15 DR M Tauseef Javed SIMS Lahore
- 16. Proportion- This is also relation /magnitude between two quantities, And numerator is always part of denominator. And expressed as percentage -Proportion of female students . -Proportion of anemic mothers (60% mothers are anemic) 2/4/2018 16 DR M Tauseef Javed SIMS Lahore
- 17. 1. Proportion: Specific type of ratio in which numerator is included in the denominator and the resultant value is expressed as %age. E.g 1: If there are 1000 boys and 800 girls in a school, the proportion of boys: Boys / Boys+ Girls= 1000 x 100 = 55% 1000+800 E.g 2: From 7,999 females aged 16 – 45 y, 2,496 use modern contraceptive methods. The proportion of those who use modern contraceptive methods = 2,496 / 7,999 x 100 = 31.2% 17 2/4/2018 DR M Tauseef Javed SIMS Lahore
- 19. Measurement of morbidity- Incidence Occurrence of new cases • Prevalence Existence of all new & old cases. 2/4/2018 19 DR M Tauseef Javed SIMS Lahore
- 20. Prevalence vs. Incidence Prevalence:- how many people in a population currently have the disease (Photograph) Incidence:- how many people are diagnosed each year (Film) 2/4/2018 20 DR M Tauseef Javed SIMS Lahore
- 21. Cure rate 2/4/2018 21 DR M Tauseef Javed SIMS Lahore
- 22. Figure 7.4 Incident cases Deaths, emigrations and recovery Prevalent cases 2/4/2018 22 DR M Tauseef Javed SIMS Lahore
- 23. New cases 2/4/2018 23 DR M Tauseef Javed SIMS Lahore
- 24. Figure 7.7 Incident cases Prevalent cases Recoveries Emigrant cases, unmeasured cases occurring abroad, and deaths Recoveries Population reservoir Immigration Births Emigrant and non- measured cases, deaths 2/4/2018 24 DR M Tauseef Javed SIMS Lahore
- 25. INCIDENCE RATE Like prevalence, divided into two types: 1. Cumulative incidence rate 2. Incidence density 2/4/2018 25 DR M Tauseef Javed SIMS Lahore
- 26. Number of new cases of disease occurring over a specified period of time in a population at risk at the beginning of the interval. 1. Cumulative incidence rate: 2/4/2018 26 DR M Tauseef Javed SIMS Lahore
- 27. EXAMPLE OF CUMULATIVE INCIDENCE RATE If we count all new cases of influenza occurring in MSU undergraduates from September 1, 1997 - August 31, 1998, and we take as the denominator all undergraduates enrolled in September 1, 1997, we would be describing the cumulative incidence rate of influenza. 2/4/2018 27 DR M Tauseef Javed SIMS Lahore
- 28. Number of new cases of disease occurring over a specified period of time in a population at risk throughout the interval. 2. Incidence density: 2/4/2018 28 DR M Tauseef Javed SIMS Lahore
- 29. The numerator does not differ between the two types of incidence However, the denominator can differ in incidence density from cumulative incidence because it takes account of (in the example): •Students who left school during the year •Students who died •Students who had influenza once and will not have it again the same season •Students who entered school later in the year 2/4/2018 29 DR M Tauseef Javed SIMS Lahore
- 30. Incidence density requires us to add up the period of time each individual was present in the population, and was at risk of becoming a new case of disease. Incidence density characteristically uses as the denominator person-years at risk. (Time period can be person-months, days, or even hours, depending on the disease process being studied.) 2/4/2018 30 DR M Tauseef Javed SIMS Lahore
- 31. Types of prevalence- • Prevalence at any given point of time. • 4% TB cases on 1st April Point prevalence • Prevalence at a given period of time. • Period will be 1year. Period prevalence 2/4/2018 31 DR M Tauseef Javed SIMS Lahore
- 32. Proportion of individuals in a specified population at risk who have the disease of interest at a given point in time. POINT PREVALENCE RATE 2/4/2018 32 DR M Tauseef Javed SIMS Lahore
- 33. Proportion of individuals in a specified population at risk who have the disease of interest over a specified period of time. For example: annual prevalence rate lifetime prevalence rate. (When the type of prevalence rate is not specified it is usually point prevalence, or its closest practical approximation) PERIOD PREVALENCE RATE 2/4/2018 33 DR M Tauseef Javed SIMS Lahore
- 34. Prevalence increased by- Longer duration of the disease. Prolongation of life, with treatment. If incidence increases. Immigration of new cases. Better reporting of cases. Emigration of healthy people. 2/4/2018 34 DR M Tauseef Javed SIMS Lahore
- 35. Prevalence- increased by- Longer duration of disease Incidence increases. Prolongation of life without cure. 35 2/4/2018 DR M Tauseef Javed SIMS Lahore
- 36. Prevalence decreased by- Shorter duration of diseases. Improved cure rate. Incidence decreases. Emigration of new cases. Under reporting of cases. Immigration of healthy people. 2/4/2018 36 DR M Tauseef Javed SIMS Lahore
- 37. Prevalence decreased by- Improved cure rate. Short duration of disease. Incidence decreases 2/4/2018 37 DR M Tauseef Javed SIMS Lahore
- 38. USES OF INCIDENCE AND PREVALENCE 1. Incidence is generally used for acutely acquired diseases, prevalence is used for more permanent states, conditions or attributes of ill-health. 2. Incidence is more important when thinking of etiology of the disorder, prevalence when thinking of societal burden of the disorder including the costs and resources consumed as a result of the disorder. 3. Incidence always requires a duration, prevalence may or may not. 2/4/2018 38 DR M Tauseef Javed SIMS Lahore
- 39. 4. In incidence, the unit of analysis is the event, in prevalence, it is the person. Thus incidence may exceed 100% (e.g. annual incidence of colds) unless a convention is adopted to count only first episodes of an illness that can occur more than once. 5. Prevalence can never exceed 100%. 6. Incidence generally requires an initial disease-free interval before counting starts, because incidence is measured only in those at-risk of disease. 2/4/2018 39 DR M Tauseef Javed SIMS Lahore
- 40. USES OF INCIDENCE DENSITY AND CUMULATIVE INCIDENCE Incidence density gives the best estimate of the true risk of acquiring disease at any moment in time. Cumulative incidence gives the best estimate of how many people will eventually get the disease in an enumerated population. 2/4/2018 40 DR M Tauseef Javed SIMS Lahore
- 41. RELATIONSHIP BETWEEN INCIDENCE AND PREVALENCE In a STEADY STATE (i.e. if incidence is not changing, and the population is stable) Prevalence rate = incidence rate times the duration of disease (P = I x D) 2/4/2018 41 DR M Tauseef Javed SIMS Lahore
- 43. Mortality indicators Crude Death Rate. Specific death rate. Case fatality rate. Proportional mortality rate. Survival rate. Standardized death rate. 2/4/2018 43 DR M Tauseef Javed SIMS Lahore
- 44. Crude Death Rate- Number of deaths from all causes, per 1000 estimated mid year population in one year in a given place. No deaths during one year CDR = _________________________ X 1000 Mid year population 2/4/2018 44 DR M Tauseef Javed SIMS Lahore
- 45. Specific death rate- Cause Specific death rate like disease death rate, Road accident… Age specific-IMR, Child Mortality rate Sex specific death rate – MMR/female Period specific death rate–Death in May 2/4/2018 45 DR M Tauseef Javed SIMS Lahore
- 46. Case fatality rate- Percentage of particular cases dying during particular disease epidemic. Killing power of disease particularly acute diseases No of deaths due to cholera CFR= ----------------------- X 100 Total No of cholera cases 2/4/2018 46 DR M Tauseef Javed SIMS Lahore
- 47. Proportional mortality rate- Proportion or % of deaths due to particular cause out of total deaths. It measures the disease burden. Under 5, No of deaths below 5 years proportional = -------------------- X 100 mortality rate Total No all of deaths 2/4/2018 47 DR M Tauseef Javed SIMS Lahore
- 48. Survival Rate- Percentage of the treated patients remaining alive at the end of 5 years treatment. Yard stick for assessing the standard of therapy in cancer. Survival pts alive at the end of 5 yrs Rate = ---------------------- X 100 Total No of pts treated 2/4/2018 48 DR M Tauseef Javed SIMS Lahore
- 49. Standardized Death Rate. (Adjusted Death Rate) CDR can not be useful for comparison. Death rate need to be standardized for comparisons. Standardization can be done by- :adjusting death rate age wise, :also can be done sex/race wise 2/4/2018 49 DR M Tauseef Javed SIMS Lahore
- 50. Important Rates Incidence Rates Prevalence Rates Important Ratios Odds Ratio Relative Risk 2/4/2018 DR M Tauseef Javed SIMS Lahore 50
- 51. Incidence Rates 2/4/2018 DR M Tauseef Javed SIMS Lahore 51 Number new cases of disease during a specified period of time Total population at risk at the beginning of that specified period Incidence = x 10n Assumptions 1. The observation on study population started at the same time 2. Single common end point (time) of observations 3. The population at risk will remain unchanged during the study period
- 52. What do you understand by population at risk? What is population at risk for cervical carcinoma? 2/4/2018 DR M Tauseef Javed SIMS Lahore 52
- 53. Population at risk in study of carcinoma of cervix 2/4/2018 DR M Tauseef Javed SIMS Lahore 53 All men All Women 0-25 25-60 70 + 25-60 years Total Population All Women age groups Population at Risk
- 54. Concept of Numerator and Denominator Numerator “Number of events or disease cases are the numerators Denominator “The population under study or population at risk is the denominator Include all persons affected and unaffected Person-time observation 2/4/2018 DR M Tauseef Javed SIMS Lahore 54
- 55. Brain Storming How will you estimate the incidence if? It is not possible to start of observation on large population at the same time It may not be possible to end the observation at the same time The population at risk may not remain the uniform over period of observation 2/4/2018 DR M Tauseef Javed SIMS Lahore 55
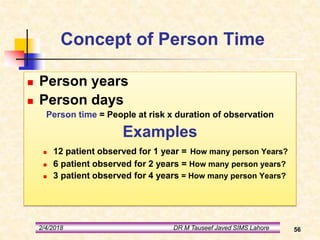
- 56. Concept of Person Time Person years Person days Person time = People at risk x duration of observation Examples 12 patient observed for 1 year = How many person Years? 6 patient observed for 2 years = How many person years? 3 patient observed for 4 years = How many person Years? 2/4/2018 DR M Tauseef Javed SIMS Lahore 56
- 57. Incidence rate (“incidence density”) Number of new cases ––––––––––––––––––––––––––––––– Avg population at risk × Time interval Number of new cases = –––––––––––––––––––– Population-time
- 58. Incidence Density (I.D) 2/4/2018 DR M Tauseef Javed SIMS Lahore 58 Number new cases of a disease during a specified period of time Total person time of the observation Incidence Density = X 10n
- 59. Subj Jan 2001 July 2001 Jan 2002 July 2002 Jan 2003 July 2003 Jan 2004 July 2004 Time at risk Per- time A 2/20 1.5 30 B 0/10 2.0 20 C 5/40 3.0 120 D 3/10 4.0 40 E 3/10 2.0 20 F 2/35 2.0 70 2/4/2018 DR M Tauseef Javed SIMS Lahore 59 Estimation of Incidence density (Chronic hypertensive pt followed for nephropathy) Number of events = 15 Person time = 300 Incidence density = X 1000 = 50 Person-years Period of observation from Jan 2001 to 2004
- 60. Prevalence (Point prevalence) 2/4/2018 DR M Tauseef Javed SIMS Lahore 60 Number of people with disease or having vital event at a given point in time Total number of persons at risk in that point in time Point Prevalence = x 10n
- 61. Prevalence Rate (Period Prevalence) 2/4/2018 DR M Tauseef Javed SIMS Lahore 61 Number of people with disease or having vital event at a specified time period Total population at risk in the middle of the time internal Prevalence Rate = x 10n
- 62. Concept of Incidence, point prevalence and period prevalence 2/4/2018 DR M Tauseef Javed SIMS Lahore 62 Jan 2009 31 Dec 2009 Case 1 Case 2 Case 3 Case 4 Case 5 Case 6 Case 7 Case 8 The cases for incidence rate during year 2009? The case for point prevalence on 1st Jan? The cases for point prevalence at 31st Dec? The cases for period prevalence?
- 63. Incidence and Prevalence P varies as Product of I & D (I = incidence and D = duration of illness) Severity of the illness The duration of the illness The number of new cases Availability / non-availability of treatment Effectiveness of Treatment 2/4/2018 DR M Tauseef Javed SIMS Lahore 63
- 64. Objectives of Analysis 2/4/2018 DR M Tauseef Javed SIMS Lahore 64 • Distribution by place person and time • Observing the differences and developing hypothesis Descriptive Analysis • Comparison of exposures/risk factors in groups • Comparison of outcome/disease in groups Analytical analysis
- 65. Analysis 2/4/2018 DR M Tauseef Javed SIMS Lahore 65 • Comparison of exposure rates • Odds Ratio (OR) for association Case control study • Comparison of Incidence rates • Relative Risk (RR) for association Cohort study
- 66. 2 x 2 Table for Analytic studies Disease Status Exposure Status Cases Control Total Exp. Yes a b a + b Total Exp Exp. No c d c + d Total non-Esp Total a + c Total Dis. b + d Total non-Dis. a + b+ c+ d Grand total 2/4/2018 DR M Tauseef Javed SIMS Lahore 66
- 67. Case Control Study estimates 2/4/2018 DR M Tauseef Javed SIMS Lahore 67 • Exposure rate among the cases How much exposure among diseased? • Exposure rate among the controls How much exposure among control? • Odds Ratio What is the Risk Ratio?
- 68. Case Control Study design 2/4/2018 DR M Tauseef Javed SIMS Lahore 68 Non-diseased Exposure Present Exposure absent Diseased Exposure Present Exposure absent Compare Case control study proceed from effect to the cause Select Trace back
- 69. 2 x 2 Table Case Control Analysis Disease Status Exposure Status Cases Control Total Exp. Yes a b a + b Total Exp Exp. No c d c + d Total non-Esp Total a + c Total Dis. b + d Total non-Dis. a + b+ c+ d Grand total 2/4/2018 DR M Tauseef Javed SIMS Lahore 69
- 70. Relative Risk in Case-Control Studies Can’t derive incidence from case-control studies Begin with diseased people (cases) and non-diseased people (controls) Therefore, can’t calculate relative risk directly But, we can use another method called an odds ratio 2/4/2018 70 DR M Tauseef Javed SIMS Lahore
- 71. Odds Ratio in Prospective (Cohort) Studies 2/4/2018 71 DR M Tauseef Javed SIMS Lahore
- 72. Odds Ratio in Case-Control Studies 2/4/2018 72 DR M Tauseef Javed SIMS Lahore
- 73. 2/4/2018 DR M Tauseef Javed SIMS Lahore 73 Derivation of Odds Cases Controls Exposed a b Not exposed c d Total a + c b + d Odds of exposure among cases = Probability to be exposed among cases Probability to be unexposed among cases a / (a+c) Odds E cases = ------------ = a / c c / (a+c) Odds of exposure among controls = Probability to be exposed among controls Probability to be unexposed among controls b/ (b+d) Odds E controls = ------------ = b / d d/ (b+d) a/c OR = ---- = ad / bc b/d
- 74. Odds Ratio in Case-Control Studies (cont.) 2/4/2018 74 DR M Tauseef Javed SIMS Lahore
- 75. When is the Odds Ratio a Good Estimate of Relative Risk? When cases are representative of diseased population When controls are representative of population without disease When the disease being studied occurs at low frequency 2/4/2018 75 DR M Tauseef Javed SIMS Lahore
- 76. REMEMBER !!! An odds ratio is a useful measure of association In a cohort study, the relative risk can be calculated directly In a case-control study the relative risk cannot be calculated directly, so an odds ratio is used instead 2/4/2018 76 DR M Tauseef Javed SIMS Lahore
- 77. Cohort Study estimates 2/4/2018 DR M Tauseef Javed SIMS Lahore 77 • Incidence among the exposed How much disease in exposed? • Incidence among the controls How much disease in non exposed? • Relative Risk or Risk Ratio What is the Risk Ratio? • Attributable Risk (Extra risk due to exposure) What is the risk difference
- 78. 2 x 2 Table Cohort Study Analysis Disease Status Exposure Status Cases (Diseased) Control (Non disease) Total Exp. Yes a b a + b Total Exp Exp. No c d c + d Total non-Esp Total a + c Total Dis. b + d Total non-Dis. a + b+ c+ d Grand total 2/4/2018 DR M Tauseef Javed SIMS Lahore 78
- 79. RR from 2x2 Table 2/4/2018 DR M Tauseef Javed SIMS Lahore 79 a a + b Incidence among exposed = c c + d Incidence among non-exposed = a /a + b c /c + d Relative Risk (RR) =
- 80. Relative Risk Calculations 2/4/2018 80 DR M Tauseef Javed SIMS Lahore
- 81. Determining Relative Risk 2/4/2018 81 DR M Tauseef Javed SIMS Lahore
- 82. Interpreting Relative Risk 2/4/2018 82 DR M Tauseef Javed SIMS Lahore
- 83. Relative Risk in Case-Control Studies Can’t derive incidence from case-control studies Begin with diseased people (cases) and non-diseased people (controls) Therefore, can’t calculate relative risk directly But, we can use another method called an odds ratio 2/4/2018 83 DR M Tauseef Javed SIMS Lahore
- 84. Attributable Risk Definition: The amount of disease that can be attributed to a certain exposure. 2/4/2018 84 DR M Tauseef Javed SIMS Lahore
- 85. Concept of Attributable Risk 2/4/2018 85 DR M Tauseef Javed SIMS Lahore
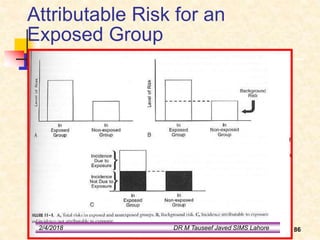
- 86. Attributable Risk for an Exposed Group 2/4/2018 86 DR M Tauseef Javed SIMS Lahore
- 87. OR, expressed as a proportion: Attributable Risk for an Exposed Group (cont.) From previous relative risk example: 2/4/2018 87 DR M Tauseef Javed SIMS Lahore
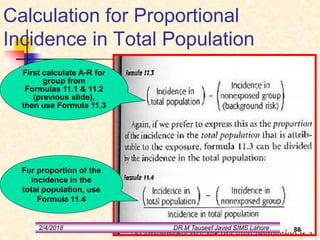
- 88. Calculation for Proportional Incidence in Total Population First calculate A-R for group from Formulas 11.1 & 11.2 (previous slide), then use Formula 11.3 For proportion of the incidence in the total population, use Formula 11.4 2/4/2018 88 DR M Tauseef Javed SIMS Lahore
- 89. Calculations for Attributable Risks (cont.) 2/4/2018 89 DR M Tauseef Javed SIMS Lahore
- 90. Summary Relative risk and odds ratio are important as measures of the strength of association Important for deriving causal inference Attributable risk is a measure of how much disease risk is attributed to a certain exposure Useful in determining how much disease can be prevented Therefore: Relative risk is valuable in etiologic studies of disease Attributable risk is useful for Public Health guidelines and planning 2/4/2018 90 DR M Tauseef Javed SIMS Lahore