Location via proxy:   [ UP ]  
[Report a bug]   [Manage cookies]                
SlideShare a Scribd company logo

1

By Prof. IndraniSenSIMC21.7.2o11Research On Media Consumption

2

Research on Media ConsumptionCultural and social studies form a large part of the research on media consumption There are broadly three areas of research done on media consumption Audience researchCultural studies and reception studies based on content analysis, effect of communication content on audiences and culture Done by academics By market research and advertising agencies related to only the effect of the advertising contentProfessional research Based on analysis of programming and content Done by media organizationsCommercial researchBased on analysis of media habits and other demographics  of the audienceDone by market research agencies for marketers and media

3

Audience ResearchThe process schoolConcerned with the acts of communication(messages), with what happens in the process of communicatingAssumes that the meaning is fixed, and inherent in the message, put there by the sender (encoder), and decoded by the receiver (with the possibility of multiple stages along the route, and of feedback from the decoder to the encoder)Considers that communication can fail as a result of noise (for instance when there is no shared code or too many similar codes in parallel communication) Uses qualitative / quantitative research methods

4

Audience ResearchThe semiotic schoolConcerned primarily with the works of communication (texts, spoken or written words) and with how as well as what they meanAssumes that meaning is constructed in the process of signification, by the interaction of text and reader/ producer within a context, so it is always negotiated and never absoluteConsiders that communication always happens, that signification produces meanings, even when the meanings generated are not shared by participants in the communication eventUses qualitative research methods

5

Map of Audience ResearchMass audience passively acted upon by mediaEffect studiesLinear communication modelsSocially differentiated mass audience using media activelyUses and gratification studiesLinear communication modelsIndividual & social groups engaged in meaning of construction within cultural contextsCultural/ reception studiesSemiotic communication model

6

Map of Audience ResearchIndividual readers activating texts within parameters established by the creative artist/ encoderReader response analysisSemiotic model of communicationIndividual readers constructed by the text (narratively or ideologically) or passive consumersLiterally criticism, little or no interest in audienceLinear model of communication

7

Professional ResearchFollows the similar principles as audience  researchMay not go in depth to research on the cause of the effect of communicationConcerned more with the final outcome or the effectUses both qualitative as well as quantitative research methodsAudience Research Unit of AIR and Doordarshan has been engaged in such professional research for many yearsLarge media houses have in-house research department who carry out such research on regular basisUses and gratification studies are often carried out to understand the way the audience is consumed the message  and the gratifications they received from the same

8

Commercial Research: Readership/ Viewership / ListenershipM&E industry is more concerned with commercial research on media consumptionLarge scale syndicated surveyMedia habits of consumers by Socio economic classificationsDemographic criteriaGeographic segmentationsLifestyle parametersPsychographic profilesMedia and product linkageUses quantitative research methods

9

Commercial Research: RatingsRatings Estimating the audience Media houses compete with each other to head the ratings table They collectively fund the research which produces the ratings informationFunctions of RatingsDetermines the rate which media houses will charge the advertisersHelp advertisers to decide where they should advertise and estimate the reach and frequency of advertising schedulesProgrammers decide whether to continue with a particular programmeNetwork schedulers decide how to schedule different programmesAcademic researchers study historical trends

10

Commercial Research: RatingsStrengthsReliable sample proceduresDemographic data helps in decision making processRaw data can be used to develop academic researchWeaknessNo method to ensure absolute reliability of data collectedLimited conclusions linked with popularity of programmes

11

Syndicated Media ResearchLarge scale syndicated survey on media consumption conducted on regular basisIndia Readership SurveyTAM RAMSmall scale survey focusing on specific media consumption of specific TGCorporate Decision Makers’ SurveyCommissioned large /small scale survey as per the need of the advertiser/ medium

12

Syndicated Media ResearchLarge ScaleIndian Readership SurveyConducted by Hansa Research for MRUC2,14,486 individuals distributed over 70 cities, 1178 towns and 2894 villagesOngoing survey with results published twice a year for round 1 and round 2Provides information on consumption of all media as well as demographics and product usage data for households as well as individuals Some IRS findings have been used in the session on Indian Media Industry

13

Syndicated Media ResearchLarge ScaleTAM “Television Audience Measurement” Based on People meter aMapTV Ratings based on People MeterRAMRadio listenership study Based on dairy methods

14

Syndicated Media ResearchIndian Outdoor SurveyBy Hansa Research spearheaded by MRUCAn one time survey Outdoor industry has intention for conducting it on regular basis in metro citiescomScoreThe global third party Internet Audience MeasurementConducted on regular basis

15

comScore- The Third party Internet Audience MeasurementcomScore is a global Internet information and internet audience measurement company comScore recruits panelists online through a variety of recruitment methodsRecruited members identify themselves before logging on to internet to help capture demographics comScore passively monitors and report all internet activities of member panel month on monthcomScore reports only those users who have accessed internet from either home or work computer in the past 30 dayscomScore estimates the extended universe for online population to be 50.03 Mn for Oct 09-which includes access from public/shared/cybercafeIn India, the panel size is around 16,000 users

16

Syndicated Media ResearchSmall Scale Initiated by market research agencies and then sold to interested parties in the M&E industryExamplesOnline Media Survey 2009Decision Makers Survey 200Commissioned surveys

17

BY Ac Nielsen2008An Online Media Survey

18

MethodologyThe purpose was to do an online survey on multimedia consumption and ownership patterns In all, 501 respondents, including 409 males and 92 females, from India participated in the survey, and 266 of them were aged below 30 yearThe survey was conducted in last quarter of 2008

19

The FindingsTraditional Media 94% owned TVs, and 84% of them actually use their TVs.Ownership of CDs was at 70%, with usage at 55%Ownership of DVD player was at 65%, with usage at 49%63% of respondents had personally bought a DVD in the last 6 months, while 59% bought CDsNew Media 82% claimed that they owned personal computers, and only 78% of them used their PCs9% of the them own a console video game system, while only 7% own handheld video game systemsMobile 36% of the respondents own video and web-enable mobile handsets 67% own mobile phones without GPRS or capability to browse the web

20

The FindingsMusic85% of them spent some time listening to music on a PC, portable device or mobile deviceAlmost 75% listened to music on CDs63% streamed or downloaded content/ music on a PC or portable deviceGames Respondents preferred playing games on PC or mobile device as against a game console This is expected as the number of people owning game consoles is very low 59% spent time playing games on PC, while 29% spent time on game consoles

21

The FindingsThe increasing penetration of internet had led to an increase in the usage of streaming content from the web including music or audio tracks (66%)music videos(59%)ads or movie trailers (57%)TV shows or TV clippings (46%)full length movies or movie clips (42%)video games (32%)The findings show a skew towards media consumption in digital format

22

Pros & Cons of Methodology UsedThe method of generating consumer response to a pre designed questionnaire placed in a  particular category of media (internet) or in a particular media vehicle does not allow selection of samples according to demographic distributionThe self prompted response from consumers of media can not be used to create a profile of the media vehicleHowever, such research throws insight into the media consumption pattern which is useful for both the media owners as well as the advertisers and ad agencies

23

HOW Yahoo uses Research FINDINGS ON Media Consumption for MARKETING October 2009Lets Yahoo!

24

Internet in India- A growing phenomenonOver 30 Mn Internet Users in 2007Over 49 Mn Internet Users in 2008More than 28 Mn internet users online EVERYDAY60% of the internet users have been using the net for MORE THAN TWO YEARSPercentage of users from emerging towns and urban uptowns  higher than MetrosSource: JuxtConsult India Online 2008

25

Internet in India- A growing phenomenonOver 30 Mn Internet Users in 200770% of the users accessing internet from home though Broadband connection89% of home internet users access at least once a dayThe prime time for internet access from home is from 6pm-12 midnight (49% users)Heavy Internet users spend more  time on Internet as compared to other mediaSource: JuxtConsult India Online 2008

26

Internet Users are heavy on internet than on any other offline mediaInternet Vs Offline MediumSource: Juxt Consult India Online 2008

27

Yahoo! – A chartbuster!If Yahoo! were a country, our 26 MM users would make us bigger than Australia! Source: comScore Media Metrix Oct 2009    Categories as classified by comScore*Sports category Cricket sites

28

23 world properties in 15 languages With a reach more than 72% * and user base of over 29 million ^Yahoo! Truly dominates the online landscape in India. *comScore  October’ 09^Yahoo! Internal Data –October 09

29

The Demographic profile for Y! PropertiesSource :Y internal data- Oct 09

30

 91% of internet users access emails *Yahoo! The most popular website for emailing *Email- the most popular activity on the Internet*Source: JuxtConsult India Online 2008

31

Y! Mail –# 1 for email service!*Source: ComScore data- Oct‘09

32

Demographic profile of Yahoo! Mail Users^Source: Y! internal data- Oct 09

33

Yahoo! Homepages- The starting point online! Yahoo! India Homepages reaches 2X the audience on rediff.com*Source: ComScore data – Oct 2009

34

Close to 60% of Yahoo! FP users below 18-30 years of age!^Source: Y! internal data- Oct 09*Source: ComScore data – Oct 2009

35

Over 70% of IM users use Yahoo! Messenger*Yahoo! Messenger has more users than Gtalk, Windows live and Rediff Bol put together! And over 65% of the time spent on IM is on Yahoo! Messenger! *1 Mn Unique User Logins and over 1.5 Mn Page Views everyday^*Source: ComScore data- Oct‘09

36

Demographic Split of Y! Messenger usersAge group of 21 - 29 most active on Y! Messenger^Source: Y! internal data- Oct ‘09*Source: ComScore data – Oct 2009

37

By AC NIELSEN ORG MARGDecision Makers Survey 4

38

DMS study is conducted by AC Nielsen ORG-MARGDMS is a syndicated survey which gives a peek into the media habits and lifestyle of Decision-makers of Corporate India DMS helps understand the target group and also identify ideal channels for communicating to this very high profile group of peopleDMS also explains Media Habits Readership TV viewership Radio Listenership Internet Usage Lifestyle and product ownershipBackground

39

Field Work & SampleField Work : August through November 2005  Target Group: Covered in the survey are Senior Executives (General Managers and above) The top 500 private sector companies Largest 100 public sector companies Leading 100 companies in the financial sector including banks, merchant bankers, FIIs etc.The ET 500 list was used to select the top 500 private sector companies in India. Other sources were used to draw the list of public sector co.’s, banks etc.  The data that is reported is the representative of the constructed universe of the corporate elite in the country

40

Sample CompositionOther Cities26%Mumbai(291)43%Chennai10%(65)DelhiKolkata(44)(95)14%7%(170)

41

Sample Composition(124)(162)(184)(145)

42

Sample Composition(52)(116)(342)(155)

43

Sample Findings: General Interest Dailies Base: All Respondents – 665Figures % to baseThe Times Of India emerges as a clear leader amongst CDMs with 77% readership Hindu (18%)and Hindustan Times (16%) take 2nd & 3rd spot resp

44

Key Findings - LifestyleCorporate Decision Maker ProfileThe avg. age is 46 yrs old, suggesting that the senior leadership is today younger. (The CDM was older by 3 yrs i.e.  49 yrs when we reported in DMS-3) Average salary Rs. 17 lakhs, earning more than what we reported in DMS-3 Two thirds of the crème de la crème are based in the four major metropolitan cities in India, Mumbai is the home to little under than half the sample (43%)

45

Credit Card OwnershipBase : Credit Cards (617) Figs in % to BaseOn an avg. a CDM owns two Credit Cards

46

Every third CDM has a Standard Chartered Bank (SCB) card

47

Citibank is the most popular credit card issuing bank – every 2nd CDM has a Citibank card BankingBase : Having personal preferred banks (647) Figs in % to BaseICICI is the most preferred bank followed by HDFC

48

Citibank which headed as the preferred credit card has a much lower  share as the preferred bankMost Used CarsBase : All Car Owners (643) Figs in % to BaseMaruti Udyog with its wide portfolio of Cars stand way ahead of all cars that are owned by CDMs

49

Hyundai Motors and Honda Cars take the 2nd and 3rd positionCommissioned Media ResearchLarge ScaleIndian Youth Survey  Conducted by NCAER for National Book Trust in 2009In the age group of 13-35 years, a sample of over 3,11,431 literate youth (1,02,021 rural and 2,09,410 urban) covering 432 villages in 207 districts as rural and 753 urban blocks in 199 towns as urbanOne time survey for working out long term strategy of NBT to make all youths in 15-25 years active readersThe findings are available in the netSmall ScaleThere are many examples of commissioned small scale studies using quantitative as well as qualitative techniquesFocus Group Discussions and individual depth interviews are often used for understanding media consumption pattern of a selected group of media vehicles

50

Use of Commercial Research DataCommercial Research data is used in the advertiser market by the advertisers and their agencies for taking media investment decisions Such information is also used by media for Marketing their space/ time to the advertisersImproving their content in order to attract more audience in the competitive market

51

Choice of MediaBased On Media Consumption Pattern

52

Understanding media consumption across marketsReach / Fragmentation Analysis

53

The Methodology...Client : PeerlessTG  Male BCD AdultsAnalysis only in urban ( 1L+ ) marketsRegular press reach >= 75% :  High reachRegular press reach < 75%   :   Low reach

54

The Methodology...Index of fragmentation = Unduplicated reach                                              of top 2 publications Unduplicated reach >= 70% of  regular press    reach : low fragmentation marketUnduplicated reach < 70% of  regular press    reach : high fragmentation market

55

A look at some markets...%LR / HFHR / HFHR / LFLR / LF

56

Some strategic implicationsLow reach markets with high occasional readershipMore insertions in low reach markets to  build up reach Less insertions for high reach markets

57

Reach/ Fragmentation MatrixReachHLLess publicationsLess publicationsLLess InsertionsMore InsertionsLess Outdoor More Outdoor FragmentationMore publicationsLess Insertions Less outdoorMore publicationsHMore insertionsMore outdoor

58

Low reach / high fragmentationStrategyMore publications  More Insertions   Higher Outdoor SupportMarketsKolkataRest of West BengalRest of MaharashtraPunjab, Haryana & ChandigarhBangaloreRest of Karnataka

59

High reach / high fragmentationStrategyMore publications   Less Insertions   Lower Outdoor SupportMarketsMumbaiAssam

60

High reach / low fragmentationStrategyLess publications  Less Insertions  Lower Outdoor SupportMarketsKeralaChennai

61

Low reach / low fragmentationStrategyLess publications   More Insertions   Higher Outdoor SupportMarketsLucknowRest of UPRest of Tamil NaduHyderabadRest of Andhra PradeshAhmedabadRest of Gujarat

62

Can magazines be used to support newspapers?

63

A look at some marketsLucknow & Chennai strong magazine markets

64

A lokk at some more marketsKerala & Assam strong magazine market

65

Strong magazine marketsMarkets with 40%+ exposure to magazinesLucknowKeralaChennaiRest of Tamil NaduRest of KarnatakaHyderabadAssam

66

The case of Assam  A Strong magazine marketMagazines with 57% reach as against 76% dailies reach among WNC TGSadin ( a weekly ) with higher readership than any other publicationBismoi ( a monthly ) comes a close second followed by AsomiyaPratidin, the leading daily

67

Greater role for magazinesMagazines not just an OTS builder in strong magazine markets Magazines can help in building up reach along with dailiesA lesser emphasis in dailies in such markets

68

The Vernacular Factor

69

Kolkata : A strong Bengali market

70

English dominates upper SEC in Mumbai

71

English also strong in Bangalore upper SECs

72

Vernacular strong across SECs in Kerala

73

Other markets where vernacular is ahead across all SECsRest of West BengalLucknowRest of UPRest of MaharashtraPunjab, Haryana, ChandigarhRest of Tamil NaduRest of KarnatakaRest of APAhmedabadRest of Gujarat

74

Other markets where English is strongChennai  English with same readership as Tamil in SEC ARest of KarnatakaEnglish ahead of Kannada in SEC AHyderabadEnglish much ahead in SEC AAlso ahead in SEC B

75

Setting Reach / Frequency Objectives

76

Low reach / high fragmentationMktg. ObjectiveTarget Media DeliveriesMaintenance                      50% to 60%  1+ reachReinforce / Enhance          40% to 50%  3+ reachLaunch / Pack change        30% to 40% 4+ reach

77

High reach / high fragmentationMktg. ObjectiveTarget Media DeliveriesMaintenance                      75% to 80%   1+ reachReinforce / Enhance          55% to 60%   3+ reachLaunch / Pack change        45% to 50%  4+ reach

78

High reach / low  fragmentationMktg. ObjectiveTarget Media DeliveriesMaintenance                      80% to 90%  1+ reachReinforce / Enhance          60% to 70%  3+ reachLaunch / Pack change        50% to 60%  5+ reach

More Related Content

Media consumption 2

  • 2. Research on Media ConsumptionCultural and social studies form a large part of the research on media consumption There are broadly three areas of research done on media consumption Audience researchCultural studies and reception studies based on content analysis, effect of communication content on audiences and culture Done by academics By market research and advertising agencies related to only the effect of the advertising contentProfessional research Based on analysis of programming and content Done by media organizationsCommercial researchBased on analysis of media habits and other demographics of the audienceDone by market research agencies for marketers and media
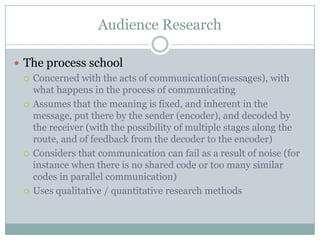
  • 3. Audience ResearchThe process schoolConcerned with the acts of communication(messages), with what happens in the process of communicatingAssumes that the meaning is fixed, and inherent in the message, put there by the sender (encoder), and decoded by the receiver (with the possibility of multiple stages along the route, and of feedback from the decoder to the encoder)Considers that communication can fail as a result of noise (for instance when there is no shared code or too many similar codes in parallel communication) Uses qualitative / quantitative research methods
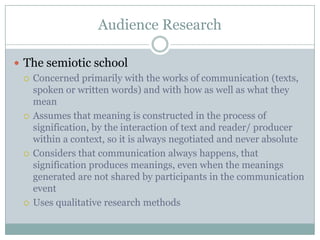
  • 4. Audience ResearchThe semiotic schoolConcerned primarily with the works of communication (texts, spoken or written words) and with how as well as what they meanAssumes that meaning is constructed in the process of signification, by the interaction of text and reader/ producer within a context, so it is always negotiated and never absoluteConsiders that communication always happens, that signification produces meanings, even when the meanings generated are not shared by participants in the communication eventUses qualitative research methods
  • 5. Map of Audience ResearchMass audience passively acted upon by mediaEffect studiesLinear communication modelsSocially differentiated mass audience using media activelyUses and gratification studiesLinear communication modelsIndividual & social groups engaged in meaning of construction within cultural contextsCultural/ reception studiesSemiotic communication model
  • 6. Map of Audience ResearchIndividual readers activating texts within parameters established by the creative artist/ encoderReader response analysisSemiotic model of communicationIndividual readers constructed by the text (narratively or ideologically) or passive consumersLiterally criticism, little or no interest in audienceLinear model of communication
  • 7. Professional ResearchFollows the similar principles as audience researchMay not go in depth to research on the cause of the effect of communicationConcerned more with the final outcome or the effectUses both qualitative as well as quantitative research methodsAudience Research Unit of AIR and Doordarshan has been engaged in such professional research for many yearsLarge media houses have in-house research department who carry out such research on regular basisUses and gratification studies are often carried out to understand the way the audience is consumed the message and the gratifications they received from the same
  • 8. Commercial Research: Readership/ Viewership / ListenershipM&E industry is more concerned with commercial research on media consumptionLarge scale syndicated surveyMedia habits of consumers by Socio economic classificationsDemographic criteriaGeographic segmentationsLifestyle parametersPsychographic profilesMedia and product linkageUses quantitative research methods
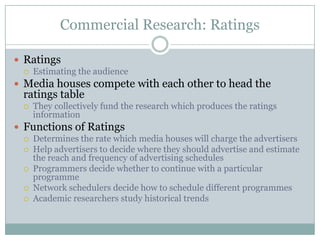
  • 9. Commercial Research: RatingsRatings Estimating the audience Media houses compete with each other to head the ratings table They collectively fund the research which produces the ratings informationFunctions of RatingsDetermines the rate which media houses will charge the advertisersHelp advertisers to decide where they should advertise and estimate the reach and frequency of advertising schedulesProgrammers decide whether to continue with a particular programmeNetwork schedulers decide how to schedule different programmesAcademic researchers study historical trends
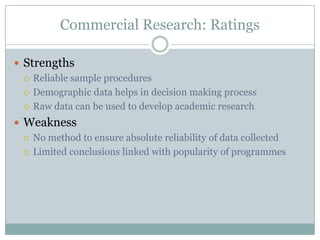
  • 10. Commercial Research: RatingsStrengthsReliable sample proceduresDemographic data helps in decision making processRaw data can be used to develop academic researchWeaknessNo method to ensure absolute reliability of data collectedLimited conclusions linked with popularity of programmes
  • 11. Syndicated Media ResearchLarge scale syndicated survey on media consumption conducted on regular basisIndia Readership SurveyTAM RAMSmall scale survey focusing on specific media consumption of specific TGCorporate Decision Makers’ SurveyCommissioned large /small scale survey as per the need of the advertiser/ medium
  • 12. Syndicated Media ResearchLarge ScaleIndian Readership SurveyConducted by Hansa Research for MRUC2,14,486 individuals distributed over 70 cities, 1178 towns and 2894 villagesOngoing survey with results published twice a year for round 1 and round 2Provides information on consumption of all media as well as demographics and product usage data for households as well as individuals Some IRS findings have been used in the session on Indian Media Industry
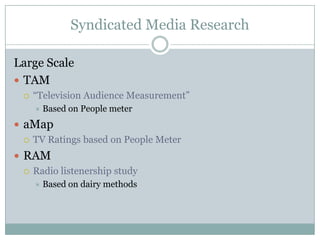
  • 13. Syndicated Media ResearchLarge ScaleTAM “Television Audience Measurement” Based on People meter aMapTV Ratings based on People MeterRAMRadio listenership study Based on dairy methods
  • 14. Syndicated Media ResearchIndian Outdoor SurveyBy Hansa Research spearheaded by MRUCAn one time survey Outdoor industry has intention for conducting it on regular basis in metro citiescomScoreThe global third party Internet Audience MeasurementConducted on regular basis
  • 15. comScore- The Third party Internet Audience MeasurementcomScore is a global Internet information and internet audience measurement company comScore recruits panelists online through a variety of recruitment methodsRecruited members identify themselves before logging on to internet to help capture demographics comScore passively monitors and report all internet activities of member panel month on monthcomScore reports only those users who have accessed internet from either home or work computer in the past 30 dayscomScore estimates the extended universe for online population to be 50.03 Mn for Oct 09-which includes access from public/shared/cybercafeIn India, the panel size is around 16,000 users
  • 16. Syndicated Media ResearchSmall Scale Initiated by market research agencies and then sold to interested parties in the M&E industryExamplesOnline Media Survey 2009Decision Makers Survey 200Commissioned surveys
  • 17. BY Ac Nielsen2008An Online Media Survey
  • 18. MethodologyThe purpose was to do an online survey on multimedia consumption and ownership patterns In all, 501 respondents, including 409 males and 92 females, from India participated in the survey, and 266 of them were aged below 30 yearThe survey was conducted in last quarter of 2008
  • 19. The FindingsTraditional Media 94% owned TVs, and 84% of them actually use their TVs.Ownership of CDs was at 70%, with usage at 55%Ownership of DVD player was at 65%, with usage at 49%63% of respondents had personally bought a DVD in the last 6 months, while 59% bought CDsNew Media 82% claimed that they owned personal computers, and only 78% of them used their PCs9% of the them own a console video game system, while only 7% own handheld video game systemsMobile 36% of the respondents own video and web-enable mobile handsets 67% own mobile phones without GPRS or capability to browse the web
  • 20. The FindingsMusic85% of them spent some time listening to music on a PC, portable device or mobile deviceAlmost 75% listened to music on CDs63% streamed or downloaded content/ music on a PC or portable deviceGames Respondents preferred playing games on PC or mobile device as against a game console This is expected as the number of people owning game consoles is very low 59% spent time playing games on PC, while 29% spent time on game consoles
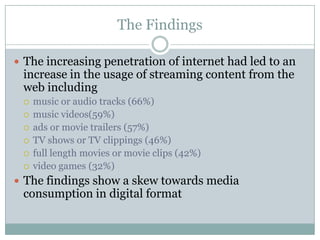
  • 21. The FindingsThe increasing penetration of internet had led to an increase in the usage of streaming content from the web including music or audio tracks (66%)music videos(59%)ads or movie trailers (57%)TV shows or TV clippings (46%)full length movies or movie clips (42%)video games (32%)The findings show a skew towards media consumption in digital format
  • 22. Pros & Cons of Methodology UsedThe method of generating consumer response to a pre designed questionnaire placed in a particular category of media (internet) or in a particular media vehicle does not allow selection of samples according to demographic distributionThe self prompted response from consumers of media can not be used to create a profile of the media vehicleHowever, such research throws insight into the media consumption pattern which is useful for both the media owners as well as the advertisers and ad agencies
  • 23. HOW Yahoo uses Research FINDINGS ON Media Consumption for MARKETING October 2009Lets Yahoo!
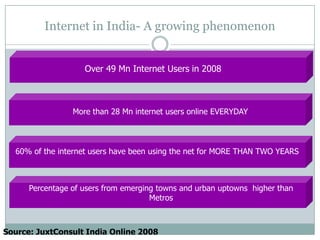
  • 24. Internet in India- A growing phenomenonOver 30 Mn Internet Users in 2007Over 49 Mn Internet Users in 2008More than 28 Mn internet users online EVERYDAY60% of the internet users have been using the net for MORE THAN TWO YEARSPercentage of users from emerging towns and urban uptowns higher than MetrosSource: JuxtConsult India Online 2008
  • 25. Internet in India- A growing phenomenonOver 30 Mn Internet Users in 200770% of the users accessing internet from home though Broadband connection89% of home internet users access at least once a dayThe prime time for internet access from home is from 6pm-12 midnight (49% users)Heavy Internet users spend more time on Internet as compared to other mediaSource: JuxtConsult India Online 2008
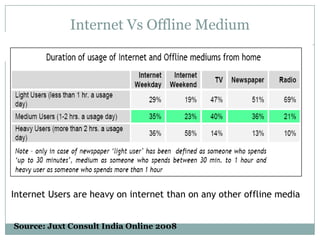
  • 26. Internet Users are heavy on internet than on any other offline mediaInternet Vs Offline MediumSource: Juxt Consult India Online 2008
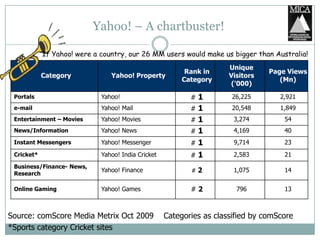
  • 27. Yahoo! – A chartbuster!If Yahoo! were a country, our 26 MM users would make us bigger than Australia! Source: comScore Media Metrix Oct 2009 Categories as classified by comScore*Sports category Cricket sites
  • 28. 23 world properties in 15 languages With a reach more than 72% * and user base of over 29 million ^Yahoo! Truly dominates the online landscape in India. *comScore October’ 09^Yahoo! Internal Data –October 09
  • 29. The Demographic profile for Y! PropertiesSource :Y internal data- Oct 09
  • 30. 91% of internet users access emails *Yahoo! The most popular website for emailing *Email- the most popular activity on the Internet*Source: JuxtConsult India Online 2008
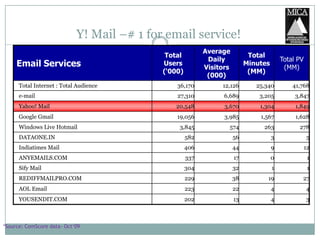
  • 31. Y! Mail –# 1 for email service!*Source: ComScore data- Oct‘09
  • 32. Demographic profile of Yahoo! Mail Users^Source: Y! internal data- Oct 09
  • 33. Yahoo! Homepages- The starting point online! Yahoo! India Homepages reaches 2X the audience on rediff.com*Source: ComScore data – Oct 2009
  • 34. Close to 60% of Yahoo! FP users below 18-30 years of age!^Source: Y! internal data- Oct 09*Source: ComScore data – Oct 2009
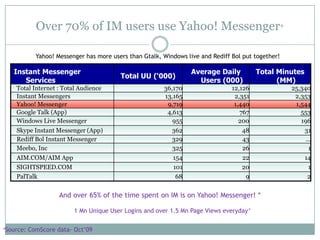
  • 35. Over 70% of IM users use Yahoo! Messenger*Yahoo! Messenger has more users than Gtalk, Windows live and Rediff Bol put together! And over 65% of the time spent on IM is on Yahoo! Messenger! *1 Mn Unique User Logins and over 1.5 Mn Page Views everyday^*Source: ComScore data- Oct‘09
  • 36. Demographic Split of Y! Messenger usersAge group of 21 - 29 most active on Y! Messenger^Source: Y! internal data- Oct ‘09*Source: ComScore data – Oct 2009
  • 37. By AC NIELSEN ORG MARGDecision Makers Survey 4
  • 38. DMS study is conducted by AC Nielsen ORG-MARGDMS is a syndicated survey which gives a peek into the media habits and lifestyle of Decision-makers of Corporate India DMS helps understand the target group and also identify ideal channels for communicating to this very high profile group of peopleDMS also explains Media Habits Readership TV viewership Radio Listenership Internet Usage Lifestyle and product ownershipBackground
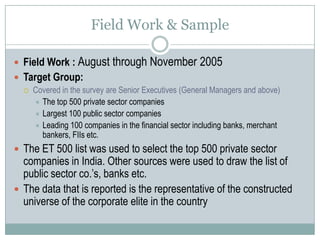
  • 39. Field Work & SampleField Work : August through November 2005 Target Group: Covered in the survey are Senior Executives (General Managers and above) The top 500 private sector companies Largest 100 public sector companies Leading 100 companies in the financial sector including banks, merchant bankers, FIIs etc.The ET 500 list was used to select the top 500 private sector companies in India. Other sources were used to draw the list of public sector co.’s, banks etc. The data that is reported is the representative of the constructed universe of the corporate elite in the country
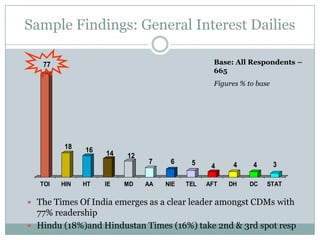
  • 43. Sample Findings: General Interest Dailies Base: All Respondents – 665Figures % to baseThe Times Of India emerges as a clear leader amongst CDMs with 77% readership Hindu (18%)and Hindustan Times (16%) take 2nd & 3rd spot resp
  • 44. Key Findings - LifestyleCorporate Decision Maker ProfileThe avg. age is 46 yrs old, suggesting that the senior leadership is today younger. (The CDM was older by 3 yrs i.e. 49 yrs when we reported in DMS-3) Average salary Rs. 17 lakhs, earning more than what we reported in DMS-3 Two thirds of the crème de la crème are based in the four major metropolitan cities in India, Mumbai is the home to little under than half the sample (43%)
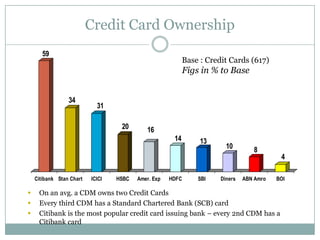
  • 45. Credit Card OwnershipBase : Credit Cards (617) Figs in % to BaseOn an avg. a CDM owns two Credit Cards
  • 46. Every third CDM has a Standard Chartered Bank (SCB) card
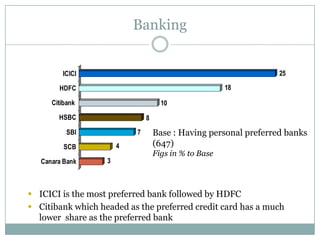
  • 47. Citibank is the most popular credit card issuing bank – every 2nd CDM has a Citibank card BankingBase : Having personal preferred banks (647) Figs in % to BaseICICI is the most preferred bank followed by HDFC
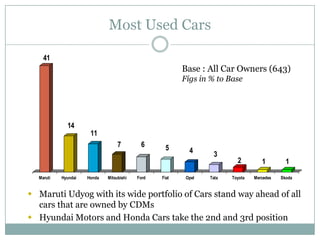
  • 48. Citibank which headed as the preferred credit card has a much lower share as the preferred bankMost Used CarsBase : All Car Owners (643) Figs in % to BaseMaruti Udyog with its wide portfolio of Cars stand way ahead of all cars that are owned by CDMs
  • 49. Hyundai Motors and Honda Cars take the 2nd and 3rd positionCommissioned Media ResearchLarge ScaleIndian Youth Survey Conducted by NCAER for National Book Trust in 2009In the age group of 13-35 years, a sample of over 3,11,431 literate youth (1,02,021 rural and 2,09,410 urban) covering 432 villages in 207 districts as rural and 753 urban blocks in 199 towns as urbanOne time survey for working out long term strategy of NBT to make all youths in 15-25 years active readersThe findings are available in the netSmall ScaleThere are many examples of commissioned small scale studies using quantitative as well as qualitative techniquesFocus Group Discussions and individual depth interviews are often used for understanding media consumption pattern of a selected group of media vehicles
  • 50. Use of Commercial Research DataCommercial Research data is used in the advertiser market by the advertisers and their agencies for taking media investment decisions Such information is also used by media for Marketing their space/ time to the advertisersImproving their content in order to attract more audience in the competitive market
  • 51. Choice of MediaBased On Media Consumption Pattern
  • 52. Understanding media consumption across marketsReach / Fragmentation Analysis
  • 53. The Methodology...Client : PeerlessTG Male BCD AdultsAnalysis only in urban ( 1L+ ) marketsRegular press reach >= 75% : High reachRegular press reach < 75% : Low reach
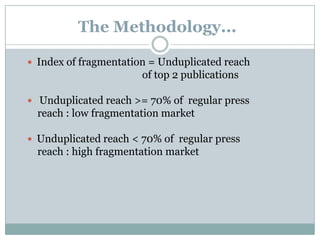
  • 54. The Methodology...Index of fragmentation = Unduplicated reach of top 2 publications Unduplicated reach >= 70% of regular press reach : low fragmentation marketUnduplicated reach < 70% of regular press reach : high fragmentation market
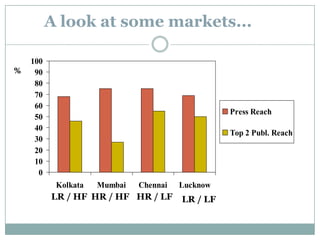
  • 55. A look at some markets...%LR / HFHR / HFHR / LFLR / LF
  • 56. Some strategic implicationsLow reach markets with high occasional readershipMore insertions in low reach markets to build up reach Less insertions for high reach markets
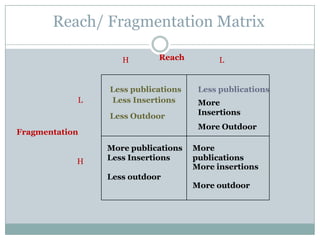
  • 57. Reach/ Fragmentation MatrixReachHLLess publicationsLess publicationsLLess InsertionsMore InsertionsLess Outdoor More Outdoor FragmentationMore publicationsLess Insertions Less outdoorMore publicationsHMore insertionsMore outdoor
  • 58. Low reach / high fragmentationStrategyMore publications More Insertions Higher Outdoor SupportMarketsKolkataRest of West BengalRest of MaharashtraPunjab, Haryana & ChandigarhBangaloreRest of Karnataka
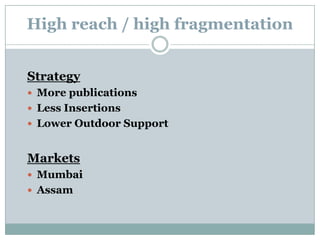
  • 59. High reach / high fragmentationStrategyMore publications Less Insertions Lower Outdoor SupportMarketsMumbaiAssam
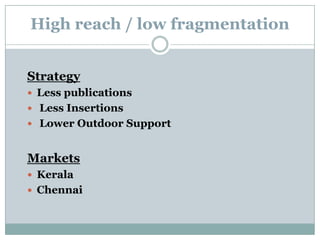
  • 60. High reach / low fragmentationStrategyLess publications Less Insertions Lower Outdoor SupportMarketsKeralaChennai
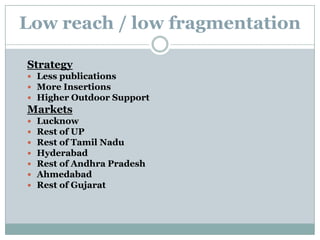
  • 61. Low reach / low fragmentationStrategyLess publications More Insertions Higher Outdoor SupportMarketsLucknowRest of UPRest of Tamil NaduHyderabadRest of Andhra PradeshAhmedabadRest of Gujarat
  • 62. Can magazines be used to support newspapers?
  • 63. A look at some marketsLucknow & Chennai strong magazine markets
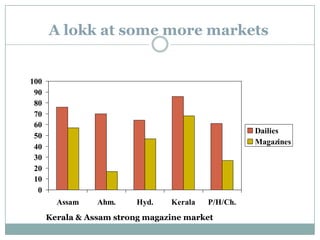
  • 64. A lokk at some more marketsKerala & Assam strong magazine market
  • 65. Strong magazine marketsMarkets with 40%+ exposure to magazinesLucknowKeralaChennaiRest of Tamil NaduRest of KarnatakaHyderabadAssam
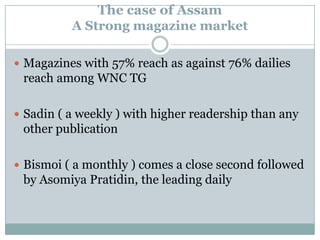
  • 66. The case of Assam A Strong magazine marketMagazines with 57% reach as against 76% dailies reach among WNC TGSadin ( a weekly ) with higher readership than any other publicationBismoi ( a monthly ) comes a close second followed by AsomiyaPratidin, the leading daily
  • 67. Greater role for magazinesMagazines not just an OTS builder in strong magazine markets Magazines can help in building up reach along with dailiesA lesser emphasis in dailies in such markets
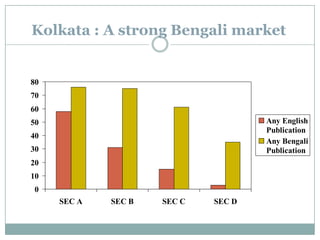
  • 69. Kolkata : A strong Bengali market
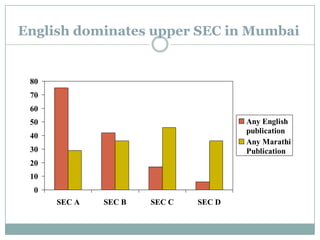
  • 70. English dominates upper SEC in Mumbai
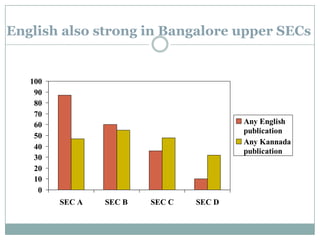
  • 71. English also strong in Bangalore upper SECs
  • 72. Vernacular strong across SECs in Kerala
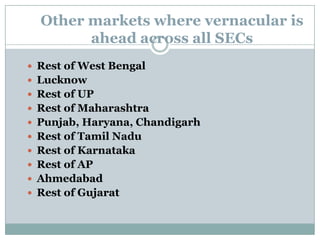
  • 73. Other markets where vernacular is ahead across all SECsRest of West BengalLucknowRest of UPRest of MaharashtraPunjab, Haryana, ChandigarhRest of Tamil NaduRest of KarnatakaRest of APAhmedabadRest of Gujarat
  • 74. Other markets where English is strongChennai English with same readership as Tamil in SEC ARest of KarnatakaEnglish ahead of Kannada in SEC AHyderabadEnglish much ahead in SEC AAlso ahead in SEC B
  • 75. Setting Reach / Frequency Objectives
  • 76. Low reach / high fragmentationMktg. ObjectiveTarget Media DeliveriesMaintenance 50% to 60% 1+ reachReinforce / Enhance 40% to 50% 3+ reachLaunch / Pack change 30% to 40% 4+ reach
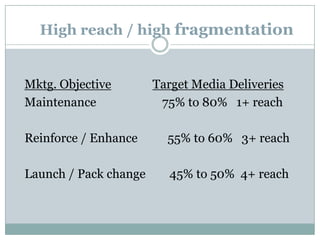
  • 77. High reach / high fragmentationMktg. ObjectiveTarget Media DeliveriesMaintenance 75% to 80% 1+ reachReinforce / Enhance 55% to 60% 3+ reachLaunch / Pack change 45% to 50% 4+ reach
  • 78. High reach / low fragmentationMktg. ObjectiveTarget Media DeliveriesMaintenance 80% to 90% 1+ reachReinforce / Enhance 60% to 70% 3+ reachLaunch / Pack change 50% to 60% 5+ reach
  • 79. Low reach / Low fragmentationMktg. ObjectiveTarget Media DeliveriesMaintenance 40% 1+ reachReinforce / Enhance 35% 2+ reachLaunch / Pack change 30% 3+ reach