Millennialmedia Year in Review - 2012
•
1 like•506 views

The document discusses mobile trends in 2012 based on data and insights from Millennial Media. Some key trends include: - Retail and restaurants overtook telecommunications as the top spending vertical in mobile advertising in 2012. Other fast growing verticals included travel, health/fitness, and personal services. - Common campaign engagement methods in 2012 included app downloads, social media integration, and using mobile to drive store visits or online purchases. Location-based targeting also grew in popularity. - Top targeted mobile audiences included DIYers, avid shoppers, in-market auto buyers, and small business decision makers. Moms also emerged as a frequently targeted group. - Major new device launches in 2012 included
Report
Share


Millennialmedia Year in Review - 2012
- 1. #SMART
- 2. 2012 Global Mobile Trends MARCH 2013 2012 Global Trends CHART A Device Manufacturers Consumers Consumers evolved the way they interacted with mobile in 2012. As consumers across the world adopted new devices, or added a second device to their life, users increasingly relied on and engaged with mobile devices in different ways throughout the day. Manufacturers around the world released dozens of new mobile devices in 2012, at a number of different sizes and price points, with a number of new functions and features. The infrastructure to support these new mobile devices also increased throughout the year, providing the platform for enhanced mobile features and use. Increased Screen Size Content Contributors More Frequent, but Shorter, Mobile Sessions There are More Devices than Humans on the Planet Increased Mobile Infrastructure – Better Speed & Connection Increased Availability of Devices at Decreasing Price Points In Southeast Asia, phones with bigger screens grew an average of 63% a month in 2012. 85% of tablet owners use their devices while watching TV. Gameification Across Verticals Source: Online Publishers Association, 2012. Tablet-Sized Ads Mobile behavior changes throughout the day; with mobile primetime from 4 pm to midnight. Multi-Screening What they mean for Mobile Advertising Adapt Mobile Ads to Shorter Use Sessions As consumer and manufacturer trends merged and developed, the mobile advertising opportunities for both advertisers and developers evolved in 2012. Increased Rich Media Engagement Mobile is Always On Audience Targeting & Intelligence Socialization Mobile-Optimized Experiences Advertisers in North America leveraged data to reach real-world audiences, such as Moms, Sports Fans, and Gadget Geeks. Approximately 46% of Entertainment campaigns used social media actions. Hyper-Local Targeting Advertisers in the Southeast Asia region invested in hyper-local targeting in 2012 – campaign spend grew at 233% a month. More Video Viewing Utliized in 64% of Product Launch / Release Campaigns. Source: Millennial Media, 2012. Visit www.millennialmedia.com/mobile-intelligence to sign up 2
- 3. Mobile Vertical Spending in 2012 MARCH 2013 Top 10 Global Brand Verticals Vertical Explosion Ranked by Spend CHART B CATEGORIES RETAIL & RESTAURANTS ENTERTAINMENT TELECOMMUNICATIONS FINANCE AUTOMOTIVE CPG / FMCG TRAVEL TECHNOLOGY EDUCATION PORTALS & DIRECTORIES Year-Over-Year Spend – 2012/2011 CHART C 2012 1 2 3 4 5 6 7 8 9 10 VERTICALS 2011 2 3 4 1 5 7 9 10 8 6 GOVERNMENT SERVICES Health: Fitness & Wellness was the fifth largest growth vertical on our platform after seeing large increases in year-over-year spend both in 2012 (281%, Chart C) and 2011 (229%). Advertisers in this vertical invested in mobile’s ability to target audiences and deliver relevant messages to mobile users interested in health living content. Travel showed a 495% year-over-year increase to move up to the seventh largest brand vertical on our platform in 2012 (Charts B & C). Travel brands, such as hotels, booking sites, and airlines ran mobile campaigns year-round to motivate consumers to plan and book their vacations for any season, often through their branded applications. Travel campaigns made up 9% of total brand advertiser campaigns on our platform in 2012 (Chart D). Twelve verticals experienced triple-digit growth on our platform in 2012 (Chart C). Six of these verticals are not in the list of Top 10 Brand Verticals on our platform. This set of emerging verticals has grown their investment in mobile advertising, as others have grown from an already established base of spending. Visit www.millennialmedia.com/mobile-intelligence to sign up 523% 495% PERSONAL & HOME SERVICES 461% HEALTH: FITNESS & WELLNESS ENERGY & POWER CPG / FMCG 281% 265% 235% ENTERTAINMENT AUTOMOTIVE TELECOMMUNICATIONS 224% 193% 143% RETAIL & RESTAURANTS 106% REAL ESTATE Insights: 860% EMPLOYMENT TRAVEL Source: Millennial Media, 2011 & 2012. Retail & Restaurants was the number one vertical on the Top 10 Global Brand Verticals on the Millennial Media platform in 2012, growing 106% year-over-year to move up and into that position from 2011 (Charts B & C). Retail & Restaurant brands made up 16% of the total brand advertiser campaigns in 2012 (Chart D). These advertisers ran mobile campaigns year-round which drove consumers to both their retail and online stores. GROWTH 103% Source: Millennial Media, 2011 & 2012. Top 10 Global Brand Verticals as Percent of Total Brand Business Count of Campaigns CHART D 14% 2% 3% 16% 3% 14% 6% 7% 14% 9% 12% Retail & Restaurants Telecommunications Finance Entertainment Travel Automotive CPG / FMCG Technology Education Government Services Others Source: Millennial Media, 2012. 3
- 4. 2012 Mobile Advertising Trends : Campaign Engagement Methods MARCH 2013 Post-Click Campaign Action Mix CHART E 40% 30% 37% 29% 20% 19% 10% 16% 18% 0% APPLICATION DOWNLOAD ENROLL / JOIN / SUBSCRIBE MCOMMERCE SOCIAL MEDIA 9% 21% 9% PLACE CALL RETAIL PROMOTION SITE SEARCH STORE LOCATOR / VIEW MAP 16% WATCH VIDEO Source: Millennial Media, 2012. Data is based on the Top 3,000 campaigns on Millennial Media’s Platform in 2012. Insights: Store Locator / View Map was included as a Post-Click Campaign Action in 21% of campaigns on our platform in 2012 (Chart E). Restaurant advertisers utilized the unique Store Locator / View Map function mobile provides. A consumer’s location was pinpointed through a maps application and then showed the proximately to brand locations. In 2012, 16% of all advertisers on the Millennial Media platform integrated m-Commerce experiences into their campaigns (Chart E). Entertainment advertisers created campaigns that promoted new motion picture or DVD releases and then provided a link to purchase tickets or the DVD. Brand Awareness represented 14% of Advertisers’ Campaign Goals on our platform in 2012 (Chart F). Travel advertisers ran mobile campaigns aimed to keep their brand name top of mind with consumers to drive hotel stays and trip planning. In 2012, Site Traffic made up 14% of all Advertisers’ Campaign Goals (Chart F). Car Manufacturers heavily utilized the “learn more” or “site search” functions in their campaigns to drive consumers to their webpages where they could explore the many vehicles and features offered. Visit www.millennialmedia.com/mobile-intelligence to sign up Advertisers’ Campaign Goals CHART F 10% 12% 39% 12% 14% Sustained In-Market Presence Brand Awareness Site Traffic Product Launch/Release Registrations Increased Foot Traffic Source: Millennial Media, 2012. Data is based on the Top 3,000 campaigns on Millennial Media’s Platform in 2012. 14% Site Traffic increased 13% year-over-year as more advertisers wanted to drive consumers to learn more about their brand. Did You Know? 40% of CPG / FMCG campaign spend on our platform included some form of location-based targeting. Source: Millennial Media, 2012. 4
- 5. 2012 Mobile Audience Trends MARCH 2013 Top Targeted Audiences CHART G Moms DIYers Vacationers Avid Shoppers Mobile Switchers Business Travelers Small Business Decision Makers Gadget Geeks In-Market Auto Buyer IT Decision Makers Source: Millennial Media, 2012. Insights: Brand advertisers on our platform leveraged audience targeting technology to make sure their messages were delivered to the right consumers at the right time. Of the audiences targeted by brand advertisers on our platform in 2012, the 10 most often targeted audiences are shown in Chart G. Moms were the 10th most targeted audience by brand advertisers on our platform in 2012 (Chart G). Moms are an increasingly active mobile audience, and were most frequently targeted on our platform in Q3 as Moms prepared their kids to go back to school for a new year. On the Millennial Media platform in 2012, Small Business Decision Makers were the 5th most frequently targeted audience (Chart G). Small Business Decision Makers were often targeted in the first and fourth quarters of the year, likely around fiscal year budget spending needs. In 2012, Avid Shoppers were the 6th most targeted audience on our platform (Chart G). Avid Shoppers were most frequently utilized as an audience targeting segment by Retail advertisers in Q4, likely in preparation for the holiday shopping season. CAMPAIGN HIGHLIGHT: ADIDAS GOAL: Drive foot traffic to New York City’s Penn Station to view an Adidas “Light You Up” promotional light show. STRATEGY: Adidas, in collaboration with Mullen’s mediahub, worked with Millennial Media to target mobile users and invite them to a light show event featuring Argentinian soccer player Lionel Messi, while promoting the launch of the new Adidas Adizero F50 soccer cleat. Adidas utilized Millennial Media’s targeting capabilities to reach thousands of mobile device users, across platforms, within a 3-mile radius of Penn Station in the hours prior to the event. “With the addition of mobile advertising for the “Light You Up” event promotion, Adidas was able to reach local users with a relative and time sensitive message and drive foot traffic to the event.” ~ Gina Preziosa, VP, Group Media Director, mediahub/Mullen To download the full campaign summary, visit www.millennialmedia.com/advertise/campaign-successes Visit www.millennialmedia.com/mobile-intelligence to sign up 5
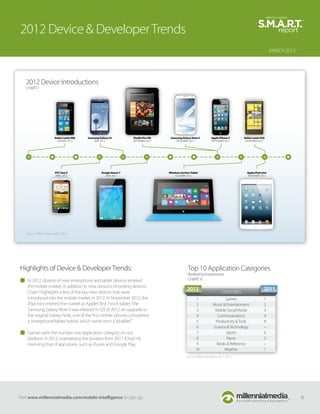
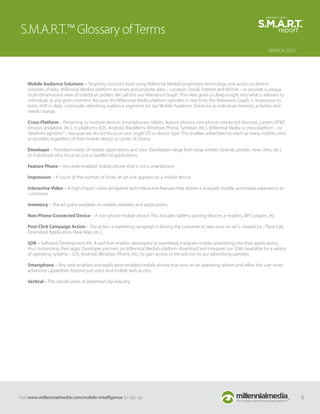
- 6. 2012 Device & Developer Trends MARCH 2013 2012 Device Introductions CHART I Nokia Lumia 900 JANUARY 2012 HTC One X APRIL 2012 Samsung Galaxy S3 MAY 2012 Kindle Fire HD SEPTEMBER 2012 Google Nexus 7 JUNE 2012 Samsung Galaxy Note II SEPTEMBER 2012 Apple iPhone 5 SEPTEMBER 2012 Nokia Lumia 920 NOVEMBER 2012 Apple iPad mini NOVEMBER 2012 Windows Surface Tablet OCTOBER 2012 Source: Public news outlets, 2012. Highlights of Device & Developer Trends: In 2012, dozens of new smartphone and tablet devices entered the mobile market, in addition to new versions of existing devices. Chart I highlights a few of the key new devices that were introduced into the mobile market in 2012. In November 2012, the iPad mini entered the market as Apple’s first 7-inch tablet. The Samsung Galaxy Note II was released in Q3 of 2012, an upgrade to the original Galaxy Note, one of the first mobile phones considered a smartphone/tablet hybrid, which some term a “phablet.” Games were the number one application category on our platform in 2012, maintaining the position from 2011 (Chart H), mirroring that of app stores, such as iTunes and Google Play. Top 10 Application Categories Ranked by Impressions CHART H 2012 1 2 3 4 5 6 7 8 9 10 CATEGORIES Games Music & Entertainment Mobile Social Media Communications Productivity & Tools Science & Technology Sports News Books & Reference Weather 2011 1 2 3 4 8 – 6 5 – 7 Source: Millennial Media, 2011-2012. Visit www.millennialmedia.com/mobile-intelligence to sign up 6
- 7. 2012 Developer Trends MARCH 2013 OS Mix Ranked by Impressions CHART J 2012 3% 1% Device Mix Ranked by Impressions CHART L CHART K 2% 1% 16% 2011 2011 2012 32% 15% 20% 16% 47% 48% CHART M 5% 33% Android iOS BlackBerry OS Windows Symbian Source: Millennial Media, 2011-2012. Highlights of Device & Developer Trends: In 2012, the OS mix on our platform remained relatively unchanged from 2011 (Charts J & K). The Android operating system led the OS mix on our platform, representing 48% of impressions. iOS was the second largest OS on our platform in 2012 with 32% of the impression share. Non-Phone Connected Devices increased five percentage points year-over-year to represent 20% of impressions we saw on our platform (Charts L & M). The growth of this category is largely attributed to the increased adoption of tablet devices. For more information, visit: www.mmedia.com 68% Smartphones Feature Phones Non-Phone Connected Devices Source: Millennial Media, 2011-2012. Smartphone data does not include what could be considered Smartphones running proprietary Operating Systems, e.g. Samsung Instinct, LG Vu. Top 5 Tablets Ranked by Impressions CHART N 3 2 1 Apple iPad* Samsung Galaxy Tab* Amazon Kindle Fire* 5 4 In 2012, Finance, Dating, and Entertainment were the top three brand verticals using our self-serve tool mMedia. 17% 75% Acer Iconia Motorola Xoom * Ranked in the top 20 among all mobile devices. Source: Millennial Media, 2012. Visit www.millennialmedia.com/mobile-intelligence to sign up 7
- 8. S.M.A.R.T.™ Glossary of Terms MARCH 2013 Mobile Audience Solutions – Targeting solutions built using Millennial Media’s proprietary technology and access to diverse volumes of data. Millennial Media’s platform accesses and analyzes data – Location, Social, Interest and Mobile – to provide a unique, multi-dimensional view of individual profiles. We call this our Relevance Graph. This view gives us deep insight into what is relevant to individuals at any given moment. Because the Millennial Media platform operates in real-time, the Relevance Graph, is responsive to every shift in data, continually refreshing audience segments for our Mobile Audience Solutions as individual interests, activities and needs change. Cross-Platform – Pertaining to multiple devices (smartphones, tablets, feature phones, non-phone connected devices), carriers (AT&T, Verizon, Vodafone, etc.), or platforms (iOS, Android, BlackBerry, Windows Phone, Symbian, etc.). Millennial Media is cross-platform – or “platform agnostic” – because we do not focus on one single OS or device type. This enables advertisers to reach as many mobile users as possible, regardless of their mobile device or carrier of choice. Developer – Provider/creator of mobile applications and sites. Developers range from large entities (brands, portals, news sites, etc.) to individuals who focus on just a handful of applications. Feature Phone – Any web-enabled mobile phone that is not a smartphone. Impression – A count of the number of times an ad unit appears on a mobile device. Interactive Video – A high-impact video ad layered with interactive features that deliver a uniquely mobile, actionable experience to customers. Inventory – The ad space available on mobile websites and applications. Non-Phone Connected Device – A non-phone mobile device. This includes tablets, gaming devices, e-readers, MP3 players, etc. Post-Click Campaign Action – The action a marketing campaign is driving the customer to take once an ad is viewed (i.e., Place Call, Download Application, View Map, etc.). SDK – Software Development Kit. A tool that enables developers to seamlessly integrate mobile advertising into their applications, thus monetizing their apps. Developer partners on Millennial Media’s platform download and integrate our SDKs (available for a variety of operating systems – iOS, Android, Windows Phone, etc.) to gain access to the ads run by our advertising partners. Smartphone – Any web-enabled and application-enabled mobile phone that runs on an operating system and offers the user more advanced capabilities beyond just voice and mobile web access. Vertical – The classification of advertisers by industry. Visit www.millennialmedia.com/mobile-intelligence to sign up 8
- 9. Summary & Reporting Methodology MARCH 2013 About Millennial Media Millennial Media is the leading independent mobile advertising and data platform. Our technology, tools and services help app developers and mobile website publishers maximize their advertising revenue, acquire users and gain audience insights. Our platform also enables us to offer advertisers powerful Mobile Audience Solutions (MAS) that utilize our significant scale, sophisticated targeting and uniquely engaging creative capabilities to deliver meaningful results. About S.M.A.R.T.™ The Scorecard for Mobile Advertising Reach and Targeting (S.M.A.R.T.)™ delivers regular insights on key trends in mobile advertising based on actual campaign and platform data from Millennial Media. Visit www.millennialmedia.com/mobile-intelligence to sign up to receive Millennial Media-related news including the Mobile Mix™ report, the Scorecard for Mobile Advertising Reach and Targeting (S.M.A.R.T.)™ report, and the Mobile Intel Series. For questions about the data in this report, or for recommendations for future reports, please contact us at research@millennialmedia.com. ©2013 Millennial Media, Inc. All rights reserved. All product names and images are trademarks or registered trademarks of their respective owners. Visit www.millennialmedia.com/mobile-intelligence to sign up 9