Location via proxy:   [ UP ]  
[Report a bug]   [Manage cookies]                
SlideShare a Scribd company logo
THE DETERMINANTS OF THE USE OF SECOND GENERATION
MARKET INFORMATION SYSTEMS IN THE DEVELOPING
COUNTRIES
A Case Study of KACE in Kenya
Thesis Report in partial fulfillment of the Agris Mundus Masters of Science in
Sustainable Development in Agriculture
Submitted to Research Supervisors:
1. Franck Galtier 2. Kostas Karantininis
CIRAD - UMR MOISA, Montpellier, FRANCE University of Copenhagen, DENMARK
3. Julie Subervie:Montpellier SupAgro-INRA, Montpellier, FRANCE
4. Course Director: Betty Wampfler, Montpellier SupAgro-IRC, FRANCE
5. On-Field Research supervisor: James K. Wekesa, Kenya Agricultural Commodity Exchange, Kenya
Submitted by: Tongola Hassan Isaac
Date: DECEMBER, 2010
ii
TABLE OF CONTENTS
TITLE PAGE NUMBER
LIST OF ABBREVIATIONS AND ACRONYMS ................................................................................v
LIST OF FIGURES.......................................................................................................................vii
LIST OF TABLES........................................................................................................................viii
LETTER OF TRANSMITTAL AND ACKNOWLEDGEMENT ............................................................ix
ABSTRACT...................................................................................................................................x
INTRODUCTION.........................................................................................................................xi
CHAPTER 1 .......................................................................................................................1
1.0 BACKGROUND ...........................................................................................................2
1.1 First Generation MIS........................................................................................................... 4
1.2 Second Generation MIS ...................................................................................................... 5
1.3 Needs of Farmers................................................................................................................ 5
1.4 Sources of Information ....................................................................................................... 7
1.5 The Determinants of the Use of MIS .................................................................................. 7
1.6 The Effects of MIS ............................................................................................................... 8
1.7 Market Information Systems in Kenya ............................................................................... 9
1.8 Maize Marketing Strategy in Kenya.................................................................................... 9
1.9 PROBLEM STATEMENT...................................................................................................... 13
1.10 RESEARCH OBJECTIVE AND JUSTIFICATION.................................................................... 14
1.10.1 Justification...................................................................................................... 14
1.10.2 Market Transparency and Arbitrage................................................................ 15
1.10.3 Reduction of Transaction Costs ....................................................................... 15
1.10.4 Discovery of New Markets............................................................................... 15
1.10.5 Formulation of Specific Policies....................................................................... 15
1.10.6 Risk Alleviation and Efficient Allocation of Resourses..................................... 16
1.10.7 Value of Information...................................................................................... 16
iii
CHAPTER 2 .....................................................................................................................18
2.0 CASE STUDY AND DESCRIPTION OF KACE MIS............................................................19
2.1 KACE aim........................................................................................................................... 19
2.2 KACE objectives:................................................................................................................ 19
2.3 Services Offered by KACE.................................................................................................. 20
2.4 THE RESEARCH OBJECTIVE................................................................................................ 23
2.4.1 The Main Research Question......................................................................................... 23
2.4.2 Specific Research Questions .......................................................................................... 23
2.4.3 Hypothesis...................................................................................................................... 23
CHAPTER 3 .....................................................................................................................24
3.0 RESEARCH METHODOLOGY.......................................................................................25
3.1. Conceptual Framework.................................................................................................... 25
3.1.1 Sources of bias ................................................................................................... 26
3.2. The Sampling Procedure.................................................................................................. 27
3.2.1 Respondent selection criteria............................................................................ 28
3.2.1 Challenges in the field........................................................................................ 29
3.2.2 Solutions to the challenges in the field.............................................................. 29
3.3 Data Collection.................................................................................................................. 30
3.3.1 Types and Sources of Data................................................................................. 30
3.3.2 Primary Data ...................................................................................................... 30
3.3.2.1 Focus Group Discussion (FGD)............................................................ 30
3.3.2.2 The Questionnaire Survey................................................................... 31
3.3.2.3 Semi-structured Interviews ................................................................ 31
3.3.3 Secondary Data...................................................................................... 32
3.4 Unit of Analysis ................................................................................................................. 32
3.5 Data Analysis..................................................................................................................... 32
3.5.1 Descriptive Analysis ........................................................................................... 32
3.5.2 Logistic (LOGIT) Analysis ................................................................................... 32
3.5.2.1 LOGIT Equation ................................................................................... 32
3.5.2.2 Variables for the LOGIT Regressions................................................... 33
iv
3.5.2.3 Testing the Determinants of ther use of MIS ..................................... 33
3.5.2.4 Dependent Variables ...........................................................................33
3.5.2.5 The Independent Variables..................................................................33
3.5.3 Structure, Conduct and Performance (SCP) Framework Analysis..................... 34
CHAPTER 4 35
4.0 RESULTS, ANALYSIS AND DISCUSSION.............................................................................. 36
4.1 Users and Non-users of cell phone SMS........................................................................... 36
4.2 Socio-economic characteristics of farmers....................................................................... 38
4.2.1 Spatial localisation of respondents................................................................................ 42
4.3 The rationale of Decision-making by the Farmers............................................................ 45
4.3.1 Why the Farmers need market information.................................................................. 45
4.3.2 Sources of information .................................................................................................. 46
4.3.2.1 Means of Access to Information on Bids.................................................................... 48
4.3.2.2 What the Information is used for ............................................................................... 50
4.5 Identification of the factors that determine the use of MIS information 68
4.5.1 LOGIT Analysis Results 68
4.6 Comparison of the Determinants of MIS Use across the Research Districts 81
4.7 Comparative Qualitative Analysis of the Chwele and Kitale MRCs 84
CHAPTER 5 .....................................................................................................................87
5.0 CONCLUSION ............................................................................................................88
5.1 Implications for the design of MIS.................................................................................... 89
5.2 Implications for public policies eventually 89
5.3 Implications for future research 90
5.4 Recommendation 90
5.5 Controversies 91
BIBLIOGRAPHY ............................................................................................................................
ANNEXES:
Questionnaire.............................................................................................................................
v
LIST OF ABBREVIATIONS AND ACRONYMS
ACP African, Caribbean and Pacific
ACP-EU African, Caribbean and Pacific-European Union
ADB Asian Development Bank
AfDB African Development Bank
ATSAL Agroforestry Tree Seeds Association of Lantapan
CAPRI Collective Action and Property Rights
CCK Communication Commision of Kenya
CDS Centre for Development Studies
CIAT International Centre for Tropical Agriculture
CIRAD French Agricultural Research Centre for International
Co-operation and Development
CTA The Technical Centre for Agricultural and Rural Co-operation
DFID The United Kingdom Department for International Development
EAGC Eastern Africa Grain Council
ERI Enabling Rural Innovation
EU European Union
FAO Food and Agriculture Organization
FARA Forum for Agricultural Research in Africa
FGD Focus Group Discussion
FM Frequency Modulation
Freq Frequency
GIS Geograpgic Information System
ICT Information and Communications Technologies
IFAD International Fund for Agricultural Development
IFPRI Internatinal Food Policy Research Institute
IICD International Institute for Communication and Development
IITA International Institute of Tropical Agriculture
INFONET Information Network
IRC Institute of Tropical Regions
ICT Information, Communication and Technology
IVR Interactive Voice Response
KACE Kenya Agricultural Exchange commodity
KBC Kenya Broadcasting Corporation
KIHBS Kenya Integrated Household Budget Survey
KMDP Kenya Maize Development Program
KNBS Kenya National Bureau of Statistics
KSH Kenya Shilling
LOGIT Logistic
Max Maximum
MILS Market Information and Linkage System
Min Minimum
MIS Market Information System
vi
MIT Massachusetts Institute of Technology
MoA Ministry of Agriculture
MRC Market Resource Centre
NAFIS National Farmers Information Service
NCPB National Cereals and Produce Board
NEPAD The New Partnership for Africa's Development
NGO Non-governmental Organization
NRI Natural Resources Institute
OECD Organisation for Economic Co-operation and Development
PRA Participatory Rural Appraisal
RATES Regional Agricultural Trade Expansion Support
RECOTIS Regional Commodity and Trade Information System
SIDA Swedish International Development Agency
SME Small and Medium agro-Enterprises
SMS Short Messagie Service
SPSS Statistical Package for the Social Sciences
Std. Dev Standard Deviation
STATA Data Analysis and Statistical Software
TV Television
UNECA United Nations Economic Commission for Africa
USAID United States Agency for International Development
USDA United States Department of Agriculture
Vsat Very Small Aperture Terminal
WRS Warehouse Receipt System
vii
LIST OF FIGURES
TITLE PAGE NUMBER
FIGURE 1: POPULATION TREND IN KENYA ........................................................................................................................9
FIGURE 2: KACE MRCS IN KENYA ...............................................................................................................................22
FIGURE 3: THE RESEARCH LOCATION IN KENYA................................................................................................................25
FIGURE 4: FARMING AS MAIN SOURCE OF INCOME...........................................................................................................38
FIGURE 5: PERCENTAGE OF OTHER INCOME SOURCES.......................................................................................................39
FIGURE 6: HOUSEHOLD SIZE FOR ALL DISTRICTS .............................................................................................................40
FIGURE 7: HEADS OF HOUSEHOLD WHO CAN READ.........................................................................................................40
FIGURE 8: HHH EDUCATION......................................................................................................................................41
FIGURE 9: LEVELS OF EDUCATION IN KENYA...................................................................................................................41
FIGURE 10: SUPPORT FROM NGO PROJECT AND PERCENTAGE OF FARMERS ON NGO PHONE PRICE ACCESS HELP ........................41
FIGURE 11: RESEARCH DISTRICTS .................................................................................................................................42
FIGURE 12: KENYA POPULATION BY AGE GROUP ..............................................................................................................42
FIGURE 13: ACCESS TO PHONE NETWORK.......................................................................................................................44
FIGURE 14: KENYA MOBILE PHONE SUBSCRIBERS .............................................................................................................44
FIGURE 15: SAFARICOM AND ZAIN NETWORK..................................................................................................................45
FIGURE 16: PERCENTAGE OF BUYERS WHO CONTACT BUYERS FOR PRICE ...............................................................................46
FIGURE 17: PERCENTAGE OF OTHER CONTACTS BY BUYERS FOR PRICE...................................................................................47
FIGURE 18: PERCENTAGE OF BUYERS WHO CONTACT SELLERS FOR PRICE...............................................................................47
FIGURE 19: MRC BOARD .........................................................................................................................................48
FIGURE 20: SOKO HEWANI..........................................................................................................................................48
FIGURE 21: SMS REQUEST .........................................................................................................................................49
FIGURE 22: NUMBER OF HANDSETS ..............................................................................................................................53
FIGURE 24:KENYA HOUSEHOLDS WITH A COMPUTER .......................................................................................................57
FIGURE 25: CREDIT ACCESS.........................................................................................................................................58
FIGURE 26: AWARENESS ABOUT MRC ..........................................................................................................................59
FIGURE 27: BENEFITS AND RESPONSES TO BIDS................................................................................................................60
FIGURE 28: BENEFITS TO SELL QUICKLY AND SELL AT HIGHER PRICE ......................................................................................60
FIGURE 29: BENEFICIARIES FROM MAKING OFFERS AND BIDS ON MRC.................................................................................60
FIGURE 30: PERCENTAGE OF BENEFICIARIES OF BIDS.........................................................................................................61
FIGURE 31: PERCENTAGE RESPONSE TO BIDS...................................................................................................................61
FIGURE 32: REQUESTS FOR MAIZE OFFERS......................................................................................................................62
FIGURE 33: AWARENESS/KNOWLEDGE OF CELL PHONE .....................................................................................................62
FIGURE 34: PERCENTAGE AWARE ABOUT SMS AND IVR SERVICE........................................................................................63
FIGURE 35: PERCENTAGE OF SMS AND IVR REQUESTS .....................................................................................................63
FIGURE 36: PROPORTION OF FARMERS WHO MAKE MAIZE OFFERS TO BUYERS .......................................................................64
FIGURE 37: PERCENTAGE OF SELLERS TO THE SAME BUYER.................................................................................................64
FIGURE 38: PERCENTAGE OF BUYERS FROM THE SAME SELLER ............................................................................................65
FIGURE 39: PERCENTAGE OF OTHERS WHO SELLER CONTACTS FOR PRICE...............................................................................65
FIGURE 40: % OF MOBILE PHONE USE FOR PRICE CONFIRMATION .....................................................................................66
FIGURE 41 PERCENTAGE OF MOBILE PHONE USE BY BUYERS TO SELLERS...............................................................................68
viii
LIST OF TABLES
TITLE PAGE NUMBER
TABLE 1: KACE MARKET RESOURCE CENTRES..........................................................................................................22
TABLE 2: BUNGOMA SMS USERS AND NON-USERS....................................................................................................36
TABLE 3: DISTANCE FROM MARKET AND ROAD........................................................................................................36
TABLE 4 SIAYA SMS USERS AND NON-USERS ..........................................................................................................36
TABLE 5: BUNGOMA, KITALE AND SIAYA SMS USERS AND NON-USERS..........................................................................37
TABLE 6: BUNGOMA, KITALE AND SIAYA SMS USERS AND NON-USERS..........................................................................38
TABLE 7: SIZE OF HOUSEHOLD BY DISTRICT ..............................................................................................................39
TABLE 8: DISTANCE FROM MARKET AND ROAD.........................................................................................................43
TABLE 9: CHOICE OF PRICES AT MRC.....................................................................................................................45
TABLE 10: AWARENESS OF THE EXISTENCE OF KITALE MRC (KITALE SAMPLE ONLY)..........................................................46
TABLE 11: USE OF INFORMATION ON MAIZE OFFERS AND BIDS FROM SMS, IVR AND MRC ................................................50
TABLE 12: USE OF INFORMATION ON MAIZE AND PRICES FROM SMS, IVR AND MRC........................................................50
TABLE 13: OWNERSHIP OF HANDSETS .....................................................................................................................72
TABLE 14: MEMBERSHIP IN FARMERS’ GROUPS .........................................................................................................73
TABLE 15: COLLECTIVE GROUP SALES ......................................................................................................................55
TABLE 16: ACRES OWNED AND CULTIVATED..............................................................................................................74
TABLE 17: ACRES CULTIVATED ..............................................................................................................................56
TABLE 18: MOTORCYCLE......................................................................................................................................57
TABLE 19: OWNERSHIP OF AT LEAST ONE TV SET .......................................................................................................57
TABLE 20: PERCENTAGE OF BORROWERS .................................................................................................................58
TABLE 21: CHOICE OF BIDS TO BUY .........................................................................................................................59
TABLE 22: ACCESS TO MAIZE PRICE INFORMATION VIA MOBILE PHONE............................................................................67
TABLE 23: AWARENESS OF THE EXISTENCE OF CHWELE MRC........................................................................................68
TABLE 24: AWARENESS OF THE EXISTENCE OF THE CHWELE MRC ....................................................................................69
TABLE 25: AWARENESS OF THE EXISTENCE OF KITALE MRC.........................................................................................70
TABLE-26: AWARENESS OF THE EXISTENCE OF KITALE MRC .........................................................................................71
TABLE 27: OFFER TO SELL AT CHWELE MRC.............................................................................................................72
TABLE 28 OFFER TO SELL AT CHWELE MRC .............................................................................................................72
TABLE 29: OFFER TO SELL AT KITALE MRC.............................................................................................................73
TABLE 30: OFFER TO SELL AT KITALE MRC.............................................................................................................74
TABLE 31: BID TO BUY AT KITALE MRC...................................................................................................................74
TABLE 32: BID TO BUY AR CHWELE MRC...............................................................................................................75
TABLE 33: USE MOBILE PHONE OR NOT TO REQUEST FOR MAIZE PRICE IN BUNGOMA......................................................... 56
TABLE 34: USE MOBILE PHONE OR NOT TO REQUEST FOR MAIZE PRICE IN KITALE .............................................................57
TABLE 35: REQUEST ODF MAIZE PRICES BY IVR LAST YEAR (2009-2010) IN BUNGOMA.......................................................77
TABLE 36 REQUEST ODF MAIZE PRICES BY IVR LAST YEAR (2009-2010) IN KITALE ..........................................................77
TABLE 37: LISTERNERSHIP TO KBC RADIO LAST YEAR (2009) IN BUNGOMA..................................................................78
TABLE 38: LISTERNERSHIP TO KBC RADIO LAST YEAR (2009) IN KITALE ........................................................................78
ABLE 39: LISTERNERSHIP TO WEST FM RADIO LAST YEAR (2009) IN BUNGOMA ..................................................79
TABLE 40: ABLE 39: LISTERNERSHIP TO WEST FM RADIO LAST YEAR (2009) IN KITALE ..................................................79
TABLE 41: DO YOU GO TO THE CHWELE MRC?.......................................................................................................... 80
TABLE-42: DO YOU GO TO THE KITALE MRC? ..........................................................................................................80
TABLE 43: COMPARISON OF THE DETERMINANTS OF MIS USE ACROSS RESEARCH DISTRICTS ......................................81
TABLE 44: CONTRASTS AND COMPARISONS BETWEEN CHWELE AND KITALE MRC................................................................84
ix
LETTER OF TRANSMITTAL AND ACKNOWLEDGEMENT
Here is the report requested for, regarding my research in Kenya.
My research task involved insightful participation in the co-ordination of a farmers’ survey
research whose findings will follow shortly, in the bulk of these document.
I am highly indebted to Montpellier SupAgro-IRC, CIRAD, The University of Copenhagen-LIFE,
KACE, and the farmers in Bungoma, Kitale and Siaya in Kenya; for their resourcefulness at
various stages of the research period. Especial thank you is to my supervisors Franck G., at
CIRAD; Kostas K., at the University of Copenhagen, and Julie S., at INRA, for their close and
helpful guidance in the course of the research and the final processing of data and the
writing of the report. I highly appreciate their competent and thoughtful comments. Not in
the least, I am also grateful to Betty W., at Montpellier SupAgro-IRC, for allowing ample time
so that I could submit a complete report. Her comments on the structuring of the report
were also handy.
Thanks are also due to the KACE management for its co-operation during the research in
Kenya. Besides, the work which was done by the enumerators to help in administering
questionnaires is recognized here.
I am most obliged to the opportunity which enabled me to accomplish this research; and to
gather a wealth of knowledge. As I see my task now concluded, I naturally voice my deepest
appreciation to all the others whose efforts, although unmentioned here, made possible the
accomplishment of this report.
x
ABSTRACT
The research explored the determinants of the use of the second generation market
information systems. This insight enlisted the data on mobile phone users and non-users.
The study sought to demonstrate through an examination of the increasingly dominant role
of efficient markets that the second generation market information systems are crucial. The
case study was in Kenya, known for a wide range of food crops, climate, soils, and maize as
its staple food crop, and its relative strength in increasingly liberalised and reformed
marketing through the Kenya Agricultural Commodity Exchange-KACE; besides having a
wider coverage of cell phone use.
A purposive non-experimental quasi sampling design was enlisted, and the major sources of
primary data for the study through triangulation included: participatory focus group
discussions; semi-structured interviews; and administering questionnaires. Secondary
sources of data included agricultural dossiers, the internet, and other specialized
publications. The data analysis involved descriptive profiling of the attributes of the phone
users and non-users; and the determinants of the use of MIS. The STATA, SPSS and Excel
softwares were used in data processing.
The scope of the research facilitated the examination of weakness in the MIS and set a basis
for future detailed impact analysis of the determinants of the use of MIS, using the collected
data. Nevertheless, by articulating these issues, alongside the findings by other researchers,
the study contributed significantly by availing a reference output, which could be important
for related debates regarding the determinants of the use of Market Information Systems
(MIS).
Sampling involved the selection of respondents who were able to respond to the questions
asked; but had no prior knowledge of the questions. Detailed data on key aspects of the
questionnaire was collected, and this included questions on variables about the farmers’
characteristics, market performace, agricultural production, and other social aspects
surrounding the farm households. FGDs, interviews, and visual observations were also
enlisted in the data collection. Data was analysed using a systematic (econometric) analysis
using logit regressions to respond to the general logit model equation given as:
 
  X
Y
Y
i
n
i
i
i
i
p
p










 11
log  Where
 
 







 Y
Y
i
i
p
p
1
log is log of odds and both p(Yi) and
1-p(Yi) ranges between 0 and 1 and represent the dependent variables. X1, X2,…..,Xn are the
independent variables; while β1, β2,….βn are the estimated coefficients.
Key words: Second generation MIS, ICT, Maize farmers, Agriculture, Kenya
xi
INTRODUCTION
In contrast to the assumption made by the economic theory that market players are
informed and that they can engage in optimal arbitrage on a symmetric footing; indeed
market information is seldom symmetric, and it is costly (Stigler 1961, Reinganum 1979,
MacMinn 1980, Stahl 1989, Pelletier, 1997; Brown et al., 2002; Barrett, 2008). Further,
theory as depicted by Stigler 1961; Rothschild 1973; Salop and Stiglitz, 1977; Pratt et al.,
1979, denotes that costly searches for information can lower competition, thus creating
inefficient allocation of goods. This observation asserts the value of market information.
This masters’ degree thesis account details an explanatory and analytical account of the
determinants of the use of second generation market information services (MIS) in the
developing countries, based on a case study on farmers who use KACE market services.
Furthermore, this exposition pinpoints out the emergent innovative role of ICTs as sources
for leveraging the use and access to market information by the farmers (Munyua, 2007).
Nevertheless, it seeks to shed light on the effects and perceptions regarding the access to
market information in the backdrop of the role of the MIS as crucial conduits of collecting,
collating, and disseminating market information.
The output presented is based on a research survey which was conducted on maize farmers
in the Bungoma, Kitale and Siaya regions in Kenya. The use or non-use of market
information services rendered by the Kenya Agricultural Commodity Exchange (KACE)
encapsuled the case study.
Revelations from the survey exposed both hands-on and pilot nature approaches in the MIS
functioning in market information delivery, and attributed with non-sustenance and up-
scaling. The success-failure stories obtained first hand from respondents should aptly
provide strong points on which to upscale and accelerate MIS delivery; while resolving the
loopholes in the MISs.
There is evidence of the rampant lack of the crosscutting headstart to evaluate the impact
of the MIS-a scenario which is so far reportedly on-going on a merely adventitious entry
point in agricultural development; and that the content and scope of the provision of
market information is limited.
To identify the determinants of the use of second generation MIS, the report exploited the
stark differences in the operations of the MRCs in Bgm and Kitale districts with regard to the
maize farmers living there. The study also compares and contrasts the respective market
situations in these districts respectively, with that in Siaya district where the farmers have
no access to the KACE Market Resource Centres.
xii
In the hypotheses, it is demonstrated that the use of market information is associated with
certain household profiles of the farmers.
This is one of the few research initiates which have so far been tailored to discovering the
effects of the determinants of MIS and therefore reporting on the findings from the primary
data and secondary data procured from a developing country. It should bring to the fore
aspects which require indepth review in the startup and implementation of new market
services. These include gauging, discussing and analysing why farmers need market
information besides pinpointing the determinants of MIS use; the sources and effects of the
use of the MIS. This contribution should bring into focus start-up points for consideration by
implementers including farmers, traders and policymakers.
The analysis of the research data was based on a region by region approach. It is however,
out of the scope of this report to analyse the impact of the MIS, because of time limitation.
The findings from the research survey pinpoint out the factors which influence the use of
the MIS, such as the need to know the consumer preferences; understand the marketing
strategies of competitors; plan for the future; handle market risks; and know the market
demand. It further explores the sources of market information pinpointing them as: Other
farmers, family members, traders, neighbours, cell phone SMS and IVR, fellow members in
farmers’ groups or associations, West FM and KBC radio, news paper, KACE MRC boards and
offices, Ministry of Agriculture and NGOs. The determinants of the use of the second
generation MIS are identified as: the number of years in farming, Household size,
Administrative leader, Literacy, Membership in farmers’ group, gender, membership in an
association, age, distance to Kitale, distance to Chwele, ownership of cows and cars,
ownership of phone handset, use of the Safaricom phone line and/or the Zain phone line.
Lastly, it reveals some implicit effects of the MIS on the decisions made by farmers in
resource allocation.
The rest of the paper is organized as follows: Chapter 1 presents the background on the MIS
situation, and it depicts the problem statement and the research objective. In Chapter 2, a
detailed description of the case study in Kenya involving the Kenya Agricultural Commodity
Exchange and its market information services is presented. On the other hand, Chapter 3
demonstrates a brief conceptual discussion on the research methodology which was used.
Here, the logistic regression approach is shown and the LOGIT model variables are briefly
described. The findings from the survey are then presented in Chapter 4, by way of concrete
results, analyses and discussions. Chapter 5 concludes the research and its findings.
1
CHAPTER 1
BACKGROUND
2
1.0 BACKGROUND
This section of the report explores the documented account on the market information
systems.
Technological change has transformed agriculture in the US, Europe and large parts of Asia
and South America, but it has largely by-passed Africa (Brown et al., 2009). During the 1920s
and 1930s, governments in the developed countries expended undue effort in setting up the
MIS (Egg and Galtier, 2003).
On the other hand, in stark contrast to the seemingly abject situation of erratic access to
information by many farmers in ACP countries where agriculture supports half of the
economy; the European farmers have access to more than 2,000 market information outlets
in the form of internet platforms and other market information repositories including
specialist publications, journals, government entities, traders and farmers’ unions. This is
notwithstanding agriculture being a farthing 2% ingredient of the European economy. MIS in
the developed countries such as Britain and Canada generally exhibit more efficiency
compared to those in sub-Sahara Africa. Farmers in the developed nations regard market
information as requisite for commercial operations. Indeed, wealthier countries have
marked benefits from market information (Baye and Morgan, 2001; Brown and Goolsbee,
2002; Baye, et al, 2004; Ellison and Ellison 2005; Ferris and Robbins, 2006).
As from 1990, the reform efforts in sub-Saharan countries have largely emphasized
liberalization in the sphere of agricultural markets. In this connection, direct governmental
market interventions via marketing boards or parastatal organizations have so far been
ceded considerably. The MIS were operationalised alongside the reforms, primarily as a
means of checking asymmetries emanating from economic liberalization. This measure
would foreseeably lend bargaining power to farmers, and thus increase transparency, liberal
trading, besides more efficient, inclusive and participatory market systems for all
stakeholders (Egg and Galtier, 1998; Tollens, 2006).
The 1980s-1990s era denoted donor-aided investment by the developing countries, in the
first generation MIS and other structural reforms. This was geared towards consolidating
markets in order to increase rural farm household incomes by giving impetus to more
agricultural production through market reinforcement and incentives (Shepherd, 1997;
Dioné, 2000; Dembélé and Staatz, 2000; Dembélé et al., 2000; Ferris et al., 2004).
However, the past 10 years have evoked much concern from development partners who
have urged governments, NGOs amongst other stakeholders to beef up the assessment the
effects of the MIS on the perceptions of farmers on farming.
Notably, the MIS in the developing countries do falter in their performance after the
withdrawal of donor funding, because governments do not follow up to sustain the
financial support of MIS (Shepherd, 1997; Aldridge, 1999). The lack of alternative and
sustainable funding sources, difficulty in quantifying MIS impacts, coupled with the public-
good element in the MIS greatly hamper their efficient performance (Shepherd, 1997).
3
Therefore, after two decades of oversights by key stakeholders on the relevance of
agricultural development, a recall of the crucial function of agriculture is now in
consideration, as attested to by the documentation of the 2008 world development report,
focusing on agriculture and its role in development and alleviating poverty (World Bank
2007). In this reflection, the use of ICT in agriculture in Africa has emerged. The e-
agriculture phenomenon has hitherto been prominently attributed to the facilitation of the
access to market information by farmers. This effort entails the need to scrutinize the
appropriateness of the MIS and the conditions in which they operate. Dembélé et al.,
(2005), noted that at least six essential factors in the successful design and implementation
process, as follows:
1. An initial political commitment to an MIS by country-level policy makers as well as private
clients, guided by a vision of how such a system can help both private and public sectors;
2. Continued financial medium-term support for the MIS;
3. Sustained re-evaluation of the MIS and focusing on the needs of MIS users alongside
political and financial support prospects;
4. Capacity-building the MIS and customizing them to resonate in tandem with the know-
how of the stakeholders and the in-country processes in the conduits of marketing;
5. Enhancing the human resource capital for managing the system; and
6. The choice of appropriate institutions in order to streamline the MIS.
Efficient MIS can be an “open sesame” and impetus for the resource-poor farmers to utilize
in-technologies; and this may incorporate: ready marketing of the produce, capacity-
building by hands-on staff, real-time or accurate information, subsidized inputs, the creation
of special credit schemes, the availability of highly qualified staff or accurate and timely
information. The economic gist of the MIS encompasses participatory agricultural
commercialisation in which smallholders can access the market information; and farm as a
business but not as a mere subsistent way of life. It is also notable in principle that MIS bear
multiple benefits such as increased returns stemming from shifting the cropping patterns to
added-value products, synchronising the selling of the produce when prices are reasonable,
or by selecting niche markets and traders (Shepherd, 1997; Milligan et al., 2010). Besides,
policy makers may utilise information from efficient MIS to pinpoint regions which have
significantly disparate prices relative to the norm, and thus respond appropriately, on
account of food insecurity (Shepherd 1997; Ferris et al., 2006b). In the same way,
functioning MIS must deaden market transaction costs, and hence facilitate a subsistence-
to-commercial agriculture transformation amongst the small-scale farmers in Africa, whose
marketing opportunities are already compromised by dysfunctional or inefficient marketing
chains (Ratnadiwakara and Silva, 2008).
On a broad basis, the less than par utilization of the intra-regional trade and production
potential, Africa suffers deficits in export market shares. This scenario resides in the
backdrop of non-uniform asymmetries in market perceptions by the agribusiness entities
and private agro-industry; as occasioned by fragmentation and thus a fragile regional
integration. This situation denotes an implicit acceleration of the disconnection of farmers
and agriculture in Africa from the regional/continental and global market. On these
premises, Africa is yet to bear the daunting task of ensuring uninterrupted access of food
4
and agricultural systems to the intra-African market. To counter potential regression in the
market efficiency, the establishment of fully-fledged market information systems (MIS) is
crucial. This will check lapses of inaccurate market information which could otherwise be a
non-tariff barrier, thus stifling intra-regional trade, and hence economic growth. In this
keeping, UNECA is operationalising and leveraging the RAMIS to bolster agricultural trade in
Africa, facilitate knowledge exchange, and offer a boon to agricultural productivity. This
intervention is worthwhile, given the transient complexion of the socio-economic and
political settings of Africa on a liberalization platform; concurrently pitting the increasing
involvement of the private sector against the waning public sector involvement in the
provision of market information. The liberalisation of agricultural markets in African
countries, followed by the provision of independent market information is to all
stakeholders in the commercial chain is believed to be able to reduce distortions in the
agricultural markets.
Presently, the many operational initiatives on ICTs in Africa, with focus on the smallholders
have a tendency to be inadequately systematized, and they also exhibit difficulty to be
accessed easily; not mentioning awareness of which determinants, farmers’ needs, and
other sources of market information which influence the choice of using or not using ICTs. In
addition, the effects of mobile telephony to improving livelihoods and reducing poverty in
Sub-Sahara Africa remain a contentious issue. Although it is recognized that the uptake of
promising information technologies like rural telephony can be influenced greatly by the
availability and/or functioning of input supply, credit systems, land-tenure arrangements,
organization of marketing, and the distribution of benefits; such social-organizational
phenomena have mostly been considered as conditions that hamper or enhance adaptation
of rural telephony (Gakuru et al., 2008).
1.1 First Generation MIS
The expectations are that MIS should tangibly bolster market efficiency. The first generation
MIS were first launched in most developing countries during the 1980s for many types of
products including cereals, tubers, fruits, vegetables, and livestock. These were essentially
first generation MIS. They received unreserved attention and support from donors and
international agencies who viewed them as fundamental gadgets in the realisation of the
restructuring and liberalization of agricultural markets. This philanthropic overture
supported the proliferation of the MIS in Africa, Asia and Latin America, to the extend that
FAO necessarily consolidated an explanatory MIS inventory (Shepherd, 1997). The first
generation MIS had a similar configuration which featured focus on a particular country and
a group of products; price information exclusively; collection of the price information from
sample markets in the country then centralizing, selecting, and then disseminating it free of
charge nationally via radio and other media. They were heavily donor-funded and centrally
managed by either government departments or projects.
Although extensive positive impacts were expected, this has not yet been evidenced
adequately and empirically. Tollens (2006), points out a gaping lack of impact evaluation of
the MIS. He also singles out that questions of whether or not the resource-poor farmers
have sufficiently gained proximity and access to the markets; or whether mechanisms of
5
price discovery have been efficient remain largely unanswered but yet debatable.
The first generation MIS were feasibly handicapped by various herculean obligations. Firstly,
they had to reliably collect data and quickly relay it to stakeholders on the market. Secondly,
they needed to customize information delivery to the needs of the stakeholders. Thirdly,
they had to guarantee sustainability of the MIS especially on a financial dimension; and
fourthly, they had to enhance participation and minimise bias and exclusion in their service
delivery. Bowbrick, (1988) asserts that public price reporting systems habour
ineffectiveness in terms of errors in recording, processing and conceptualising data;
otherwise deeper analyses must prove the contrary. Hence, he notes that they provide the
wrong information to the wrong people at the wrong time.
The loopholes in the first MIS precipitated the need for devising state-of-the-art solutions to
provide agricultural market information. This was a precursor to the renaissance of a new
means of relaying market information. As a result, with the advent of innovations in ICTs
such as internet and mobile phones in the 2000s era, second generation MIS especially
composed of the ICT element were formulated. The new MIS have a decentralized
management; are interactive; have certain levels of privatisation; target producers; and are
flexible (Aker, 2008). The mobility of the second generation MIS allows them a sometimes-
linkage with other market entities such as warehouse receipt systems (WRS), commodity
exchanges or multi-stakeholder round tables. The new MIS are comprised of diverse
innovations and they provide many services.
1.2 Second Generation MIS
However, the seemingly lucrative venture into the revamped second generation MIS is in a
limbo which calls for global awareness campaigns about the new MIS alongside their impact
in providing market information. The Forum for Agricultural Research in Africa (FARA)
reconciled an inventory in 2008 to explore the innovative ramifications of the market
information systems with regard to farmers in Africa. Observations of which revealed that
MIS projects were merely being piloted and that indicators and determinants of their being
used and their impact had so far not been examined (Mahoney and Smale, 2010).
The only notable comparative assessment of MIS (Shepherd 1997) was done before the
emergence of the second generation MIS, and in fact only a handful studies on MIS impact
have been actualised. Also, certain misgivings have been raised about the methodologies
which are enlisted in evaluating the MIS impacts, thus casting aspersions on evaluations
hitherto. Conversely, the presently accessible MIS information suffices to account for their
myriad differentiation and their associated prevalent innovations.
1.3 Needs of Farmers
Small-scale farmers need equitable and appropriate market prices and signals in order to
tailor their production to consumer needs. The farmers need market information in order to
know when and how to acquire and/or dispose their commodities; in view of price, place of
6
transaction, grade, quality and the quantity of the commodity on demand or for sale,
transport, and local administrative requirements (Ferris and Robbins, 2006; Neils, 2006).
This means the farmers who have equitable and appropriate market price information and
signals can then be able to tailor their production to consumer needs (Ferris and Robbins,
2006).
Both formal and informal markets are important for the needy smallholders who have to
sell their labour and products, to ensure upkeep of their livelihoods regarding making
investments and self insurance against risks (Kpènavoun, 2009). Efficient markets will
stimulate growth and pave way for opportunities for the poor (World Bank, 2001). Indeed,
increased access by smallholders to well remunerated markets is pivotal in the rural poverty
reduction strategy.
MIS are under a rapid momentum of transformation, as proven by the replacement of
traditional ad hoc sales marketing conduits; by streamlined linkages amongst market
stakeholders such as farmers, retailers, processors and wholesalers. The buyers expect the
farmers to timely and reliably supply the market with products of the needed quality,
quantity, and traceability. However, high-value product markets may be inconsistent and
with competitive prices, thus inhibiting the competitiveness of the smallholders (Shepherd,
2007).
Public MIS should mainly enhance competition on the market by fostering participatory
and all-inclusive market transparency. Market transparency as a factor which drives
liberal competition and upbeat marketing performance, is a crucial trendsetter in the
empowerment to sufficiently access the awareness about prices, qualities, quantities, and
conditions of sale; which in turn are indispensable arbiters in the shrewd marketing and
production decisions (Shepherd,1997). On these premises, the farmers can tailor and
strategise their sales, production and consumption decisions in order to attain certain
market incentives and satisfy their share of needs. Macro-economically, market
transparency ushers vertical co-ordination into the market chain to the effect of issuing
authentic prices which help in regulating production and consumption with the focus on
optimising welfare and maximising efficiency for tangible economic growth (Gilbert and
Tollens, 2002). Improving access to market information is essential in enabling the farmers
to be informed and to respond to the fluctuating demands and the shifting consumer
preferences. This situation provides a decision-making framework about farming, storage,
processing, marketing and investment (Shepherd, 1997; Ferris et al., 2006a; World Bank,
2007). There could also be a spill-over effect of procuring market research and the
examination of the changing nature of consumption (Ferris and Robbins, 2006).
Efficient MIS help in creation of an even spatial distribution of products within markets and
inter-regionally. Farmers who have access to quality historical market information and
possibly make crop planting decisions. On the other hand, well informed traders can
shrewdly determine the viability of both intra and inter-seasonal storage. Researchers and
agricultural planners can also utilize historical information to avail early warning of
imminent crises in food security. Predicting prices for food staples in poor regions is
7
indispensable for combating food insecurity, which is most frequently caused by insufficient
access to food instead of absolute lack of food availability. However, this forecasting of grain
prices is often challenged by the scarcity of data (Brown et al., 2009). In the economies of
the developing countries, market information is a key public good on account of the many
smallholders to whom costs of marketing and production information are generally out of
the farmers’ means of provision.
1.4 Sources of Information
Farmers access market information mainly from sources which are institutionalised,
product-specific and platform-specific. ICTs as sources of market information may include
voice information, radio dial-up and broadcasts, extension outreach services based on cell
phones, database monitoring, e-learning for basic skills, video-based approaches and
digitalised agricultural education (Mahoney and Smale, 2010).
Furthermore, mainstay forms of ICTs notably radio and televisions have traditionally focused
on the provision of agricultural advisory counsel (Odame, 2007). Government-controlled
chambers of agriculture have attempted to set up information centres in a bid to streamline
the ICTs to function effectively both as conveyors and repositories of agricultural
information. For example, in close keeping with this effort is the rendering of market
information service via the voice-based National Farmers Information Service (NAFIS) and
the web-based INFONET. Similarly, select NGOs and research entities have been at the
forefront in proactively spearheading technology transfer in the agricultural sector.
Additionally, extension workers, libraries and websites currently comprise the main
channels of providing market information to the farmers (Aker, 2008; Barasubramanian,
2008; Gakuru et al., 2008).
1.5 The Determinants of the Use of MIS
The complexion of the rural settings is on a rapid wave of unpredictable change, while the
advent of ICTs has simultaneously rendered the world a global village and augmented the
crosscutting contrasts in lifestyles globally. Efficient markets and fecund farm land are
conditional for the attainment of bumper agricultural productivity; yet nearly two-thirds of
the 1.7 billion farmers in low and middle income countries still grapple with retrogressive
poor farm land or inhibited access to markets (Gakuru et al., 2008).
Further, the limited or costly information, as is the general case in reality (Stigler, 1961);
hinders optimal leverage of arbitrage by the farmers, thus, potentially occasioning excess
price dispersion and inefficient allocation of resources on the market. Most developing
countries generally have scattered markets and the infrastructure for communication is
dilapidated (Jensen, 2007). This necessitates information in order to foster market
performance; as theorised by many economists.
The smallholders are constrained by limited information on prices; lack of credit; inadequate
access to transport facilities, technologies and market trends; checked entrepreneurial and
lobbying skills; plus both weak group and haggling power. This plethora of inhibitions does
8
not enable the farmers to exhaustively respond to the opportunities on the market (IFAD
2003; Markelova and Meinzen-Dick 2006; World Bank 2007). Hence, (IFAD, 2003) points out
that smallholders do not have a clear-cut basis on which to negotiate market prices or plan
market-oriented production. In effect, they are rendered passive and exploitable on the
market; besides being unaware of the complete value of their production (IFAD, 2003: 10).
High costs of transport, unreliable information on commodity prices, together with the
inability to clarify product quality, renders farmers in the developing countries vulnerable to
manipulation by intermediaries whose exclusion from the transactions can cause more
market efficiency (Siamwalla, 1978; Besley and Burgess, 2000). Economists and
policymakers are increasingly recognising that this dwindles both profit margins and
incentives regarding production and product quality, hence compromising equity and
efficiency (Bardhan, 1989; Jason, 2004; Goyal, 2010). Characteristically, the majority of
subsistent producers in the developing countries opt out of markets despite price incentives
for them to break out from the perverse optimal choice (Barrett, 2008). In this case, some
impetus stemming from the transaction-cost theories has informed the application of
various conceptual and empirical analyses of this seemingly viscous cycle. These probes
have been done, following the pioneering input by de Janvry et al., (1991) and Goetz (1992).
Their research findings point at inflated market entry costs, which are substantially ascribed
to costs of accessing market information. On the basis of this observation, concerted
proactiveness is being leveraged to effect the implementation of the MIS.
However, literature also points out that to design a comprehensive policy package to
eliminate the agricultural subsistence trap is problematic. Additional analysis is therefore
useful. The review of the literature indicates a gap, which, if filled, could be a good starting
point for improving the policy agenda. Indeed, until now the smallholder market
participation research agenda focuses mostly on the (discrete) decision to participate or not,
in the market; as well as the intensity of the participation.
The risks issuing from production, price and access to resources must be curbed, if
smallholders who are potential victims to these predicaments are to be bailed out of this
precarious situation. In Africa, the hiatus in the currently erratically developed status of the
“hard” infrastructure such as power, roads, and water supply; tends to stifle business
development and economic growth. Further, it is noteworthy that more than half of the
land in Africa is agriculturally non-productive and the soils are heavily leached. That
notwithstanding, institutional lapses account for much of the hindrance on Africa’s
agriculture. To counter this case, the competitively emerging ICTs in Africa are a plausible
“soft” infrastructure on target. The ICTs have been primed to provide the much needed
panacea to broaden market participation and the adoption of innovative market
information services. The ultimate output and “thread” of consistency is the feasible
reduction of transaction costs and volatile price risks and therefore the sealing of the costly
gap in economic growth (Mahoney and Smale, 2010).
9
1.6 The Effects of MIS
In espousing the economic theory, Stigler (1961) explained the role of information in the
efficient functioning of the markets. In spite of this, rampant lack and asymmetries of
information characterize the market situation in the developing countries and of concern is
that only a few data-based empirical studies have been done to determine the effects of
information on the markets. Principally, limited revelation exists in the public domain with
regard to the outcome of supporting the access to market information on how the farmers
decide what to produce, where to sell, how much to sell; besides the prices received by the
farmers from their production.
1.7 Market Information Systems in Kenya
Kenya's population has grown exponentially from the 2.5 million at the beginning of the last
century to the current figure of 38.6m people. There are 38,610,097 people in Kenya:
19,192,458 male and 19,417,639 female, according to the official 2009 population KNBS
census. In 1962, Kenya had 8.62 million people, a figure which rose to 10.9 million at the
1969 census, 15.3 million in 1979 and up to 21.4 million in 1989.
Figure 1: Population Trend in Kenya
Source: KNBS, 2010
Agricultural markets in Kenya are constrained, among others by; long chains of transaction
between the farmer and the consumer; poor access to appropriate and timely market
information; small volumes of products of highly varied quality offered by individual
smallholders; and poorly structured and inefficient markets. The lack of market information
represents a significant impediment to market access especially for smallholder poor
farmers: it substantially increases transaction costs and reduces market efficiency. For any
one commodity, the marketing chain consists of multiple middlemen, each taking a margin
at every stage of the chain, and price variations in space and time are often large and
erratic.
In Kenya, one out of every two acres of land allotted crop production has maize (Zea mays).
Maize is the primary staple food for over 85% of the Kenyan population whose per capita
10
maize consumption is 98 kilogrammes. Further, this constitutes a 28 percent expenditure of
incomes on maize, by the least-income quartile of Kenyans and notably, a deficit in maize
actually denotes famine. In view of the area cultivated, maize is third worldwide, after
wheat and rice. Also, maize, the highest yielding cereal crop, thrives at both high and low
altitudes and has the greatest average world yield of 4.3 tonnes per hectare (World Grain,
September, 2000)
1
.
However, maize farming in Kenya has for a long time been done as “farming as a way of life”
rather than “farming as a business”. This scenario has been occasioned by poor access by
small-scale farmers to markets, inefficient government extension services, ill adoption of
improved technologies, inappropriate or inadequate use of farm inputs such as fertilizers
and quality seed, and both inept producer organizations and human resource delivery.
In Kenya 1,400,000-1,600,000 hectares of maize are cultivated annually. About 3.5 million
smallholder maize farmers account for close to 75 percent of the maize production in Kenya,
whereby the production is mostly on farm sizes of below two hectares (5 acres). The
majority of small maize producers set aside part of the maize produce for subsistence. The
remaining 25 percent of maize production comes from a mere 1,000 large-scale producers,
almost entirely located in the Trans-Nzoia and Uasin Gishu districts in the Rift Valley
province.
The productivity of maize differs depending on agro-ecological zones. In Kenya, the national
average yield is 1.8 tonnes per hectare; although 4-8 tonnes per hectare so far attained by
some farmers indicate the potential for increment. However, in the immediate past, maize
production in Kenya has been short of the 3.06 million national consumption demand. The
decline in production is attributable to poor market prices, lack of credit facilities, weakness
of infrastructure (market, communication, roads, and electricity), and transient weather.
On the other hand, Kenya achieved maize production sufficiency during a few years in the
1970s; and exported some maize; but this did not necessarily create overall food security for
individual households.
Kenya resorted on spearheading economic reforms such as eliminating price legislation and
liberalisation of grain marketing in agriculture since the mid-1980s, and reinforced them in
the early 1990s (Wambua, 2004). The reforms aimed at inducting private sector
participation in the production, value-addition, marketing and the trading of the agricultural
commodities. Prior to the reforms, state-controlled marketing boards wielded the monopoly
of marketing major agricultural commodities.
Presently, in Kenya nearly 80 percent of all maize purchases are done by four maize millers
and their associates. Previously, the maize market was monopsonistic
2
such that maize
1
Source: http://www.fas.usda.gov/current2000.html: Accessed on 27th October, 2010
2
Monopsonistic here means only one buyer purchases and uses the product
11
millers could only buy maize from the National Cereals and Produce Board (NCPB).
Conversely, with the liberalisation of the cereals sector, the millers now rely on direct
purchases, large-scale farmers and agents. The market-related policy which nurtured the
monopolistic NCPB was the relatively longest instituted policy on maize marketing and
movement. In its National Development Plan of the period 1989-1993, the government of
Kenya underscored the, “since the early 1980s, it has become clear that too much official
involvement in marketing and pricing may induce operational inefficiencies. Furthermore,
parastatals and nationwide monopolies such as the NCPB have not achieved the objectives
for which they were set namely price and income stabilization for farmers, efficient and
nationwide distribution”. The access to market information is a key function for the maize
producer to whom this is an economic activity aimed at generating income. Full
liberalisation of the maize market was effected in December 1993, with the anticipation for
uninhibited growth. On the contrary, the ramifications of the post-liberalised maize market
has been the ill-functioning maize marketing policies, which have dissipated into maize price
volatility. On the other hand, the demand for agricultural commodities remains inelastic:
meaning that a shift in supply and the decrease in prices which follows, does not
significantly increase the consumption of the commodity.
1.8 Maize Marketing Strategy in Kenya
The characterisation of maize markets is widely documented: (Dembélé and Staatz, 1989;
Lutz, 1994; Aldridge, 1999; Dembélé and Staatz, 2000; Galtier, 2002; Adégbidi et al., 2003;
Röttger, 2004; Minot, 2004; Keita, 2006); and these studies reveal inadequate levels of
transparency and hindered entry on the maize market. Further, both physical and
institutional barriers to trade such as monopolies championed by the traders, present
threats of excluding farmer participation on the market. Nevertheless, these markets are
sporadic with maize traders who expect market information after every few days. However,
if the prices of maize are inflated, the buyers can opt for other food products (Ferris and
Robbins, 2006).
In Kenya, maize is mostly an undifferentiated commodity whose marketing therefore is
conditional on competitive pricing, distribution, and production. Maize is purchased from
farmers in Kenya through several seemingly ad hoc channels as follows:
 Small-scale hammer millers purchase less amounts of maize, while milling into whole
flour meal, substantial quantities of maize from consumers.
 Piece-meal farm gate or along-the-road purchases made by small-scale traders, who
may also double as brokers; followed by the consolidating the small purchases
before selling them to larger assemblers.
 Some urban traders in the rural market centres have storage facilities, and therefore
buy maize from the small-scale farmers and traders, and then bulk the maize for sale
to larger traders who own lorries, and also to market retailers at the same or the
close by market centres.
12
 Larger traders and keen agents with trucks purchase maize from assemblers and
farmers to resale to NCPB, millers as well as to national commodity dealers who
have linkage to food security agencies, and may export at their own will.
 A handful of farmers deliver maize directly to millers, commodity dealers, hunger
relief agencies and NCPB.
 Dynamic traders keep track of the sources of maize countrywide, and from other
neighbouring countries. These traders have no lasting storage facilities and trade in
other commodities on the basis of where higher returns accrue from.
Emergent marketing strategies in Kenya feature the innovation of the warehouse receipting
marketing system (WRS) operationalised by the Eastern Africa Grain Council (EAGC). This is
geared towards resolving aspects of seasonality, and consistency in quality and supply, and
fostering regional trade. The EAGC is accountable to enhancing the improvement of the
grain sector trade and policy in the producer-consumer value chain. The WRS basically
enables the farmers to sell only when the prices on the market are reasonable. Producers
are also able to regulate the supply of maize, thus stabilising maize prices; besides using
their commodity stocks in the warehouse as collateral to access credit from money lending
institutions. In the Kenyan economy where over 60 percent of the population is estimated
to be living under the acceptable poverty line, the stabilisation of the supply and price of
maize is crucial, in that it allows the heavily maize-dependent producers and consumers,
who are too cash-strapped to afford alternative expensive commodities, the opportunity to
plan and prioritise beforehand. The ability to predict market demand and supply muffles
price variability, thus enhancing both temporal and spatial arbitration (Kizito, 2009).
Maize transport costs are important in the marketing process and they depend on the
distance of the farmers from the markets as well as the state of the roads. The cost is
estimated at 45 cents for 90 kilogram per kilometre. Further, major markets in Kenya are
averagely 350 kilometres away from the major maize producing zones, hence indicating that
maize transportation cost is increased on average by Kshs 157.50 per 90 kilogrammes. In
some cases, transporter-trader negotiations are done to forge low cost transport which may
include back-loading the truck on the return trip. The traders also form partnerships in order
to collectively bulk their maize, thus reaping the associated economies of scale in the maize
sub-sector.
Trader activities have increased and they have gained the bigger of the maize market
control from the NCPB. Traders are increasingly investing in storage facilities, and also make
short-term maize supply contracts with millers and the dealers in large commodities in
Kenya.
According to the KMDP
3
maize production handbook, the farmers need market information
mainly with respect to the following reasons:
3
KMDP is the Kenya Maize Development Programme
13
 To be aware of the perception of the buyers or consumers in light of the existence of
the produce from the other competitors.
 To understand the nature of the market demand alongside the offers by the
competitors.
 To know the advantages wielded by the competitors.
 To be able to size up the marketing strategy vis-à-vis that of competitors.
 To project, forecast and simulate the future market scenario.
 To be able to understand the existing risks in marketing; and uncertainties such as
erratic weather changes and unpredictable market stability.
Kenyan farmers can access market information through the cell phone SMS and IVR, via
specific codes: 411, 247 and 0900552055 respectively. Other information sources available
are Vsat, radio broadcast, and internet portals. Furthermore, traditional means of
disseminating market information in Kenya are through the research-extension staff;
magazines, plus grain traders and processors.
Furthermore, ICTs in Kenya have also been designed to serve the innovation of mobile
money in market transactions. The M-PESA innovation launched in 2007 by Safaricom of
Kenya is a successful case, in a population where over 18.3 million people own cell phone
handsets (Economist, 2009). Currently, there are four licensed mobile phone operators
namely Celtel Kenya (Zain/AirTel), Safaricom Limited, Essar Telecom, and Telecom Kenya
(which is also the only national fixed network operator). CCK
4
reported that technological
convergence and competition in the mobile sub-sector has so far spurred innovations in the
provision of information.
1.9 PROBLEM STATEMENT
The population growth in Africa is exponential thus overwhelmingly exerting incessant
demand on food and many other products of agriculture. Nevertheless, the surplus produce
from the farmers often goes to waste because the producers are sparingly aware of how
and when to market opportunities and the potential benefits accruable from the
transactions which they can make (Ferris and Robbins, 2006).
First generation MIS emerged in the aftermath of the economic reforms and market
liberalization at the onset of the 1980s. They were intended to correct the asymmetries
associated with the economic liberalization; empower the farmers; streamline a clear-cut
trading environment; and enhance efficient market systems for all stakeholders (Tollens,
2006). While the evaluation of MIS is expected, empirical data to account for such a
situation is lacking. However, the price data collected was meant to be used by the
government and large institutions but not the farmers. These first MIS also had inept
dissemination methods, lacked innovation and they reneged on their primary function to
serve the smallholder famers (Holtzman et al., 1993; Robbins 2000).
During the first generation MIS, the government paid the farmers and legislated prices of
4
CCK is the Communications Commission of Kenya
14
key food and cash crop commodities. Cases of success have not aptly addressed themselves
to the concept of farming as a business; and instead, they have preoccupied themselves
with collecting information which is usually “historical” and seldom used. Nevertheless, they
have also had cases of political meddling and of duplication of MIS (Holtzman, et al., 1993;
Shepherd, 1997; Ferris and Robbins, 2006). Besides, these MIS suffered bureaucratic
problems, and they generally have staffing constraints, and demotivation.
Smallholders lack current market information in terms of access to and use of relevant, real-
time and actionable information in decision-making. Therefore, as a last resort, they
despondently sell their produce to the “briefcase” sales people at whatever price on offer
(Coulter et al., 1997; Röttger, 2004; Wambua, 2004; Sriboonchitta and Wiboonpongsee,
2004; Milligan et al., 2010). The supply and demand price forces on the markets for the
smallholders are increasingly self-regulated and ascribe to consistent product specifications
in commercial amounts. This has set up a precarious situation in which the farmers are
prone to fail in fully exploiting returns for commodities such as maize which typically
comprise the domain of smallholders and implicitly pose critical concerns for food security.
The fluctuation calls for market intelligence in order for the farmers to comprehend and
derive benefits. Smallholders lack current market information in terms of access to and use
of relevant, real-time and actionable information in decision-making. Therefore, as a last
resort, they despondently sell their produce to the “briefcase” sales people at whatever
price on offer (Milligan et al., 2010).
Well functioning markets stimulate growth and open opportunities for the poor (World
Bank, 2001). However, in spite of the relevance of market information, the appraisal of the
determinants of the use of second generation MIS is yet scuttled. Besides, in low-income
countries, the mainstreaming of ICTs in collecting, collating and disseminating information is
punctuated by the argument that much prioritisation should be accorded to the provision of
other basic needs such as health, education and nutrition; despite the odds that ICTs
increase earnings because of reduced market prices, and this leads to improved health and
education (Jensen, 2007). This argument overlooks the crucial role played by output
markets in alleviating poverty for the majority of rural agricultural households. On the other
hand, while recognising that micro-level evidence of the economic role played by ICTs has so
far been anecdotal; some macro-level proof of economic growth caused by ICTs is yet to be
seen (Roller and Waverman, 2001).
1.10 RESEARCH OBJECTIVE AND JUSTIFICATION
This section will provide insight on the focus of the research which was done, and it will
explain the basis for the farmers survey on the determinants of the use of the second
generation MIS.
1.10.1 JUSTIFICATION
Lack of information is an entry barrier to both production and trade. The MIS are a mainstay
sine qua non for enhancing the development and effectiveness of market linkage efficiency.
This aspect holds true, whether the SIMs adopt a “top-down” strategy involving pinpointing
15
market demand and then defining the target farmers to realise it; or a “bottom-up”
approach of selecting target farmers alongside markets which they need to supply
(Shepherd et al., 1997; Shepherd, 2007).
MIS have the potential to significantly reduce transaction costs, especially search and
transport costs, and warrant continued investment and evaluation (World Bank, 2007: 120).
It is most probable that social benefits of providing improved information to farmers
considerably outweigh the associated investment costs. Localized, crop-specific design of
the MIS can be of higher returns than the evenly distributed national multi-crop MIS. The
former case would focus on crops of higher value, besides being cost-saving in terms of
money and time; and increase accuracy and timeliness (Engoru et al., 2005).
1.10.2 Market Transparency and Arbitrage
MIS do improve market transparency whereby the transacting parties gain access to prices
and other market information. This situation can facilitate the process of spatial arbitrage
involving the transfer of goods and services to geographical regions of relatively higher
prices. This increases demand where the prices are low, and therefore causes both the rise
in the farm gate prices, and increased supplies where supply costs are surpassed by prices.
Additionally, market transparency can foster temporal arbitrage involving the hoarding of
goods until when the market prices are conducive to make better sales in the future.
The farmers can therefore, negotiate selling prices because they know price trends and
levels. Eventually, provision of market information facilitates an authentic reflection of the
aggregate prices, hence putting in perspective a reliable blueprint which depicts the
national market supply and demand, as well as transport and transaction costs (Shepherd,
1997). For market transparency to thrive, and to meet information needs of the main target
groups, market information must be: relevant, meaningful, reliable and impartial, easily
accessible, simple, and promptly available-in particular view of price information which is
essentially a perishable commodity because its value depreciates through time (Schubert,
1983; Ba and David-Benz, 2000). In all, the open produce market will be rendered fairly and
equitably competitive for all the users of the MIS.
1.10.3 Reduction of Transaction Costs
MIS can help farmers to reduce transaction costs by reducing the time and money required
to trace traders. This also checks the time spent in bargaining before sealing a transaction;
and minimizes the time spent by the farmers in identifying other trustworthy market players
(Kizito, 2009).
1.10.4 Discovery of New Markets
The MIS can also enable farmers to discover new and distant markets. This can feature new
products and extended intra-national and international geographical coverage of markets.
This effect has been observed in Mali, where the revamped market economy severed the
national grain board from commercial trading (Dembélé and Staatz, 2000; Staatz et al.,
16
2004a).
1.10.5 Formulation of Specific Policies
MIS can provide useful information necessary for the design of specific policies which are
required for planning and statistical use, besides monitoring the impacts of the policies by
stakeholders. This market information is also a vital element in the framework of early
warning and food security (Shepherd, 1997).
1.10.6 Risk Alleviation and Efficient Allocation of Resourses
In the advent of liberalisation of markets, marketing boards and minimum price programs
have been faced out. This has left the famers in the developing countries to bear substantial
production and marketing risks (Kizito, 2009). Market information can help farmers to avoid
suicidal delivery of produce on the markets when the prices are not lucrative. Knowledge on
current and future market prices also empowers the farmers to diversify crop types, and to
shrewdly prioritize the allocation of their scarce resources to farm inputs including
fertilizers, labour and pesticides. Thus, their farming risks are spread out (Shepherd, 1997;
Minten, 1997).
Rent seeking actions such as manipulative and monopolistic manoeuvres by organisations,
firms or individuals in order to gain access to governmental policy provisions such as
licenses and quotas can curtail the social welfare of producers and consumers who are
generally not supported by trade, value addition or production (Krueger, 1974). The access
to market information can improve fairness on the market and thus ensure equitable rent
distribution amongst the market actors.
1.10.7 Value of Information
The costs incurred and benefits which accrue from providing information service determine
the value of access to quality information (Stigler, 1961).
Despite the benefits cited for public MIS; they have a legacy of ineffectiveness characterised
by either too slow dissemination of information, or transmitting information in the wrong
format which is seldom actionable by the market players (Shepherd, 1997, World Bank
2007). A late 1990s review by FAO, on the theory and practice of MIS, documented that
despite the existence of at least some kind of market information service in most countries,
these services are largely not commercialised for the farmers and traders. The government
strategy lacks a commercial dimension for the MIS; yet, most MIS have also been unfeasibly
designed with regard to sustainability, (Holtzman et al., 1993; Shepherd, 1997: 1). Over a
decade later, the wanting state of the first-generation MIS still remains relatively dismal.
Nevertheless, this seeming impasse is not a dead end in itself; because the second-
generation MIS have been initiated to offset this tinkering access to market information
(Knudsen and Nash 1990; Ferris and Robbins, 2006).
Additionally, domestic markets now have a tendency to embrace national and multinational
17
chains in which transactions are complex relative to the chains linked to the transactions for
traditional foodstuf (DFID 2004; Markelova and Meinzen-Dick 2006). The last observation
here is that a combination of escalating competition in domestic markets; lack of access to
market information and largely inhibited access to overseas markets, often concurrently
marginalizes small-scale farmers while benefiting the relatively large-scale farmers and
traders (Ferris and Robbins, 2006).
The access to income is vital in the bid for rural development, in which case, the efficient
marketing of agricultural products on the basis of provision of essential market information
is a pivotal ingredient. New ICTs are instrumental in facilitating this role, to the extend that
they expedite aspects such as traceability and certification of farm products to function
relatively efficiently than other slower conventional means.
Unpredictability of the forces of demand and supply with regard to regulating the balance in
the fluctuation of prices on the market is also of great concern to the farmers. Practicality
compatible with such a fluctuating market scenario is quite eluding to the resource-poor
farmers, who are in dire need for cutting edge market information. This necessitates the use
of ICT platforms; for example to timely avail price information to the producers (IICD, 2009).
The associated initiatives in market liberalization are vital with regard to most tropical
agricultural commodities, as has been observed during the last decade. However, to curb
potential machinations and manipulations such as obscure marketing and loss of both
market transparency and power by the farmers; in the wake of the liberalization, some
bilateral, national agencies and multilateral aid organizations including the World Bank, the
European Union (EU), DFID, SIDA, ADB, IFAD and USAID, have been astute in promoting
functionally efficient MIS to check such consequences (Tollens and Gilbert, 2002). This
indulgence follows the fact that the resource-poor farmers are also market players. It
followsw then, that efficient markets, alongside an enabling policy setup could be
instrumental in checking poverty amongst the producers, consumers and employees in the
market (Knudsen and Nash, 1990; IFAD, 2003; DFID, 2004; Ferrand et al., 2004; Boselie and
Van de Kop, 2004; OECD 2006).
However, despite concerted efforts to mainstream MIS in availing agricultural information,
the numbers of agricultural extension workers are dwindling vis-à-vis the increasing
population of farmers. Besides, retrieving market information from some of the platforms
can be onerously painstaking, because it necessitates rummaging and surfing through
myriad publications and detailed websites, respectively. In fact, at the outset, it might be
virtually impossible for some farmers who are illiterate to access information presented in
these types of media platform (Allen and Ochs, 2002).
The impasse in the access to market information is exacerbated by the still erratic and
fledgeling internet infrastructure in Africa. Conversely, relatively easy access is facilitated by
the use of mobile phones, and SMSs which relay specific prompts that can also be
customised (in the case of interactive voice service), to suit certain desired languages.
However, these means are also limited by the amount and detail of information they can
relay at a time; besides requiring their potential users to be literate.
18
CHAPTER 2
CASE STUDY AND DESCRIPTION OF KACE MIS
19
2.0 CASE STUDY AND DESCRIPTION OF KACE MIS
The research was conducted in Kenya, in collaboration with the Kenya Agricultural
Commodity Exchange (KACE), which operates as a private trading floor through market
information linkage systems (MILSs). Market information systems are a vital “soft”
infrastructure which can kick-start private sector investments (Jaffee, 1992; Robbins, 2000;
Mahoney and Smale, 2010). The commodity exchanges are usually interlinked with the
warehouse receipt marketing system buyers and sellers. The commodity exchange MIS
enlist brokers in transacting purchases and sales. This mechanism facilitates agricultural
marketing and furnishes up to date commodity prices. Nevertheless, commodity exchanges
are relatively costly than conventional MIS, attract limited donor financing, and in the ACPs,
they enable trading mainly of bulky commodities like grains (Dewet, 1999; Moustier and
Zebus, 2002; Canz, 2005; Ferris and Robbins, 2006).
Commodity markets have changed significantly in the last two decades, with the
smallholders increasingly requiring robust market intelligence to understand and secure
benefit from the new environment. This has been epitomised by increased privatisation of
market institutions vis-à-vis the muffling of the leverage by governmental and parastatal
marketing entities; thus causing fluctuating nominal prices. On the same footing, prices of,
and demand for agricultural commodities has increased, given the upward trend of
urbanisation, population growth, a growing middle class of consumers and changing
consumption preferences (de Janvry et al., 1991; Milligan et al., 2010).
The Kenya Agricultural Commodity Exchange Limited (KACE) developed a market
information and linkage system (MILS) to increase the efficiency of agricultural markets,
targeting smallholders and other small-scale agribusinesses in Kenya. The MILS involves
harnessing modern information and communication technologies (ICTs) to empower
farmers with low-cost reliable and timely market information to enhance the bargaining
power of the farmer for a better price in the market place and link the farmer to input and
output markets more efficiently and profitably. The components of the KACE MILS are:
2.1 KACE aim
To be a of highest commodity exchange integrity in facilitating cutting edge trade in
agricultural commodities in Kenyan, regional and international markets. It has set its mission
on seeking to establish an outstanding commodity exchange to serve all global clients.
2.2 KACE objectives:
• To facilitate linkage between sellers and buyers, exporters and importers of agricultural
commodities;
• To provide farmers and market intermediaries with various relevant and timely services,
including marketing information and intelligence, to enable the farmer to negotiate.
20
• To provide a streamlined price discovery mechanism through exchange trading floors;
and;
• To harness and apply (ICTs) in rural value addition and empowerment.
2.3 Services Offered by KACE
 Market Resource Centres (MRCs) which are located in rural market centers, and
users visit them to receive the marketing services such as on offers to sell and bids to
buy.
 Mobile Phone Short Messaging Service (SMS) which uses mobile telephony to
provide the marketing services (i.e. commodity price information, offers and bids).
 Interactive Voice Response (IVR) service which provides marketing information
through voice mail, by the user dialing the phone number: 0900881188.
 Internet based database system which provides the marketing services through
emails to subscribers in a database.
 Radio, where marketing information is provided through an interactive rural FM
radio program branded Soko Hewani (the Supermarket on Air). The KACE commodity
price information is also provided through the national public radio-the Kenya
Broadcasting Corporation (KBC).
 Internet based database system, where information is disseminated through the
internet based electronic database and website: www.kacekenya.co.ke5
.
KACE has franchised some of its MRCs to local entrepreneurs; and it has also established a
virtual trading floor to improve matching offers and bids to an FM radio program. KACE
undertook this initiative in order to improve access by farmers and other small and medium
agro-enterprises (SMEs) to input and output markets, with particular regard to market
information and market linkage; in a financially affordable and sustainable manner.
The franchised MRCs also offer other services, although on a smaller scale; and these
include: transport brokerage in order to resolve the constraint in matching offers and bids
by the smallholders; warehousing services often for short periods of time while the produce
awaits to be sold at better prices; weighing services; quality control services such as testing
for grain moisture using moisture meters at the MRCs; selling genuine farm inputs
(fertilizers, seeds) at affordable prices; brokering financial services to farmers by banks and
micro-finance institutions; and providing email service to smallholders as well as their
communities in the remote rural areas in which they are located.
The franchised MRCs make market price information service available to KACE and maintain
the bid-offer service. Farmers are charged kshs. 100 for the placement of offers and bids at
the MRC. In addition, 2-5% commission of the whole product price value is charged to the
farmers, depending on the quantities of the commodities traded. These are basically
commissions charged on a mutual agreement with the clients
The MRCs are designed to be financially self-sustaining after two years of operation, while
5
KACE Services: Source: www.kacekenya.co.ke: Accessed on First November 2010.
21
providing affordable services targeted at the smallholders and SMEs. KACE oversees the
activities of the franchised MRCs to ensure that they develop services which are
standardized, affordable and appropriate to the needs of poor smallholders and their
communities. KACE also provides capacity enhancement business training and technical
assistance to the franchisees, and also offered them financial guarantees for start-up phase
credit under a Rockefeller Foundation guarantee fund through a local bank–the K-Rep Bank.
The franchised MRCs are developing into one-stop shops for smallholders and SMEs,
stocking farm inputs and catalyzing e-commerce, thus helping to bridge the technology gap
between remote rural areas and urban centers. With the franchised MRCs, KACE is now
concentrating its activities at a higher level of aggregation in the marketing chain, co-
ordinating the market price information service, disseminating reliable and timely market
information via ICTs, working with the cell-phone and other ICT companies in refining and
updating information dissemination technologies, and providing market linkage and
transparency at the national level. This is developing the up-stream marketing channels for
the smallholder poor farmers to market their produce beyond their local markets to
national, regional and international value-added markets
However, KACE faces some financial challenges with regard to the upscaling of its activities.
The approximate cost to disseminate radio information has been reported to be
US$120,000 per annum in Kenya (Kizito, 2010; Shepherd, 2001a; Shepherd, 2000b). On the
other hand, social benefits of providing improved information to farmers considerably
outweigh the associated investment costs (Kizito, 2010). Moreover, in the provision of its
market information services, KACE experiences some competition from the EAGC.
The KACE headquarter central hub in Nairobi, Kenya manages and co-ordinates the MILS,
besides collecting the information from its MRC outlets and dissiminating it through cell
phone SMSs and IVRs, and the web-based RECOTIS, and on its internet web portal.
Since its inception in 1997, KACE has so far started 14 MRC outlets in Kenya; although only 9
of these MRCs are currently operational. Two (Chwele and Cheptais) of the presently 9
operational MRCs are franchises, while 2 (Kisumu and Embu) of the already closed MRCs
were franchises. The scaling down and franchising was mainly occasioned by limited funds;
and that notwithstanding the downsizing, but conditional on access to financing prospects,
KACE still plans to extensify and intensify its activities by establishing more MRCs and
innovating more marketing services. The initiative to franchise was also because farmers
are willing to pay for the KACE services, thus KACE decided to involve local entrepreneurs to
reach out to the farmers.
22
Table 1: KACE Market Resource Centres
Name of MRC
STATUS
Month MRC Started Status of MRC
Nairobi (Headquarters) January 1997 Currently Operational
Bungoma January 2000 Currently Operational
Kitale April 2003 Currently Operational
Eldoret January 2003 Currently Operational
Chwele January 2003 Currently Operational
Cheptais January 2006 Currently Operational
Machakos May 2004 Currently Operational
Mombasa January 2001 Currently Operational
Nakuru May 2004 Currently Operational
Kisumu January 2001 Closed on June 2008
Karatina September 2003 Closed on April 2006
Murang’a September 2003 Closed on April 2006
Embu September 2003 Closed on April 2006
Makueni January 2007 Closed on December 2007
Figure 2: KACE MRCs in Kenya (Source: Daniel Dalet/d-maps.com)
23
2.4 THE RESEARCH OBJECTIVE
The general objective of the research was to identify the determinants of the use of the
second generation MIS and make hypotheses about the effect of the MIS and then compare
KACE MIS users and non-users who have similar observed characteristics.
The KACE services which were analysed include:
 The provision of MRC services on offers to sell and bids to buy
 Provision of SMS and IVR services via the cellphone
 Market information through the KBC and West FM radio stations, respectively.
2.4.1 The Main Research Question
What determines the use of the second generation market information services? / Which
characteristics of farmers are likely to be sources of selection bias (i.e. affect both the use
of KACE MIS and performance of farmers)?
It was important to assess the determinants of the use or non-use of MIS and therefore
identify the factors which significantly influence the user-nonuser scenario. This can help to
determine appropriate strategies to be adopted in order to enhance MIS use. It can also be
imperative to identify hindrances confronting the farmers in accessing market information.
2.4.2 Specific Research Questions
1. What influences the need of market information by the farmers?
2. What are the sources of the market information?
3. Which factors determine the use of information from the market information systems?
2.4.3 Hypothesis
Several hypotheses were formulated on the basis of a selection of profiles of household
characteristics such as: (Household size, Age of head of household, literacy level, gender of
household head, farming as the main source of the income), ownership of assets (such as
bicycles, tractors, number of cows, number of goats, number of poultry); distance from
Chwele, membership to farmer’s organization, membership to farmers’ group. The
postulation was that the selected attributes influence the use of the second generation
market information systems (MIS).
This report focuses on the following hypotheses which were tested using the LOGIT
econometric model:
i: Ownership of land encourages the use of MIS
ii: Membership to a farmers’ group enhances the use of MIS
iii: Educated farmers use MIS
iv: Long distance from the MRC results into non-users of the MRC MIS
v: Being male makes it likely to use the MIS
24
CHAPTER 3
RESEARCH METHODOLOGY
25
Figure 3: The Research Location Site in Kenya (Source: UNDP Map)
3.0 RESEARCH METHODOLOGY
3.1. Conceptual Framework
The ICTs are presently part and parcel of the dynamic initiative to revamp the nature of
market information service delivery to the farmers. The fairly fast development in the ICTs
and the internet has led to the rise of agricultural informatics, which essentially embraces
the concept of e-agriculture with reference to the delivery of cutting edge agricultural
services and the diffusion of customized technology and information to the target
stakeholder clientele. The vantage point in play here is the amalgamation of the
advancement in agricultural informatics, entrepreneurship and the development in
agriculture. E-agriculture additionally aids actors in agriculture by incorporating both
knowledge and culture to ameliorate learning processes and communication universally,
through innovative MIS.
The broad farmers’ research survey was a mastermind of CIRAD in order to evaluate the
impact of the second generation market information systems (MIS) on the basis of a non-
experimental (quasi-experimental) design. Anyone proposing to do econometric analysis of
the results of market information systems should first spend a month actually visiting the
markets and collecting the information (Bowbrick, 1988). Therefore, the broad case study
was done in Kenya in collaboration with the Kenya Agricultural Commodity Exchange MIS,
between June, 2010 and October, 2010. CIRAD focused mainly on the data from the
MIS RESEARCH=IsaacCIRAD=

More Related Content

MIS RESEARCH=IsaacCIRAD=

  • 1. THE DETERMINANTS OF THE USE OF SECOND GENERATION MARKET INFORMATION SYSTEMS IN THE DEVELOPING COUNTRIES A Case Study of KACE in Kenya Thesis Report in partial fulfillment of the Agris Mundus Masters of Science in Sustainable Development in Agriculture Submitted to Research Supervisors: 1. Franck Galtier 2. Kostas Karantininis CIRAD - UMR MOISA, Montpellier, FRANCE University of Copenhagen, DENMARK 3. Julie Subervie:Montpellier SupAgro-INRA, Montpellier, FRANCE 4. Course Director: Betty Wampfler, Montpellier SupAgro-IRC, FRANCE 5. On-Field Research supervisor: James K. Wekesa, Kenya Agricultural Commodity Exchange, Kenya Submitted by: Tongola Hassan Isaac Date: DECEMBER, 2010
  • 2. ii TABLE OF CONTENTS TITLE PAGE NUMBER LIST OF ABBREVIATIONS AND ACRONYMS ................................................................................v LIST OF FIGURES.......................................................................................................................vii LIST OF TABLES........................................................................................................................viii LETTER OF TRANSMITTAL AND ACKNOWLEDGEMENT ............................................................ix ABSTRACT...................................................................................................................................x INTRODUCTION.........................................................................................................................xi CHAPTER 1 .......................................................................................................................1 1.0 BACKGROUND ...........................................................................................................2 1.1 First Generation MIS........................................................................................................... 4 1.2 Second Generation MIS ...................................................................................................... 5 1.3 Needs of Farmers................................................................................................................ 5 1.4 Sources of Information ....................................................................................................... 7 1.5 The Determinants of the Use of MIS .................................................................................. 7 1.6 The Effects of MIS ............................................................................................................... 8 1.7 Market Information Systems in Kenya ............................................................................... 9 1.8 Maize Marketing Strategy in Kenya.................................................................................... 9 1.9 PROBLEM STATEMENT...................................................................................................... 13 1.10 RESEARCH OBJECTIVE AND JUSTIFICATION.................................................................... 14 1.10.1 Justification...................................................................................................... 14 1.10.2 Market Transparency and Arbitrage................................................................ 15 1.10.3 Reduction of Transaction Costs ....................................................................... 15 1.10.4 Discovery of New Markets............................................................................... 15 1.10.5 Formulation of Specific Policies....................................................................... 15 1.10.6 Risk Alleviation and Efficient Allocation of Resourses..................................... 16 1.10.7 Value of Information...................................................................................... 16
  • 3. iii CHAPTER 2 .....................................................................................................................18 2.0 CASE STUDY AND DESCRIPTION OF KACE MIS............................................................19 2.1 KACE aim........................................................................................................................... 19 2.2 KACE objectives:................................................................................................................ 19 2.3 Services Offered by KACE.................................................................................................. 20 2.4 THE RESEARCH OBJECTIVE................................................................................................ 23 2.4.1 The Main Research Question......................................................................................... 23 2.4.2 Specific Research Questions .......................................................................................... 23 2.4.3 Hypothesis...................................................................................................................... 23 CHAPTER 3 .....................................................................................................................24 3.0 RESEARCH METHODOLOGY.......................................................................................25 3.1. Conceptual Framework.................................................................................................... 25 3.1.1 Sources of bias ................................................................................................... 26 3.2. The Sampling Procedure.................................................................................................. 27 3.2.1 Respondent selection criteria............................................................................ 28 3.2.1 Challenges in the field........................................................................................ 29 3.2.2 Solutions to the challenges in the field.............................................................. 29 3.3 Data Collection.................................................................................................................. 30 3.3.1 Types and Sources of Data................................................................................. 30 3.3.2 Primary Data ...................................................................................................... 30 3.3.2.1 Focus Group Discussion (FGD)............................................................ 30 3.3.2.2 The Questionnaire Survey................................................................... 31 3.3.2.3 Semi-structured Interviews ................................................................ 31 3.3.3 Secondary Data...................................................................................... 32 3.4 Unit of Analysis ................................................................................................................. 32 3.5 Data Analysis..................................................................................................................... 32 3.5.1 Descriptive Analysis ........................................................................................... 32 3.5.2 Logistic (LOGIT) Analysis ................................................................................... 32 3.5.2.1 LOGIT Equation ................................................................................... 32 3.5.2.2 Variables for the LOGIT Regressions................................................... 33
  • 4. iv 3.5.2.3 Testing the Determinants of ther use of MIS ..................................... 33 3.5.2.4 Dependent Variables ...........................................................................33 3.5.2.5 The Independent Variables..................................................................33 3.5.3 Structure, Conduct and Performance (SCP) Framework Analysis..................... 34 CHAPTER 4 35 4.0 RESULTS, ANALYSIS AND DISCUSSION.............................................................................. 36 4.1 Users and Non-users of cell phone SMS........................................................................... 36 4.2 Socio-economic characteristics of farmers....................................................................... 38 4.2.1 Spatial localisation of respondents................................................................................ 42 4.3 The rationale of Decision-making by the Farmers............................................................ 45 4.3.1 Why the Farmers need market information.................................................................. 45 4.3.2 Sources of information .................................................................................................. 46 4.3.2.1 Means of Access to Information on Bids.................................................................... 48 4.3.2.2 What the Information is used for ............................................................................... 50 4.5 Identification of the factors that determine the use of MIS information 68 4.5.1 LOGIT Analysis Results 68 4.6 Comparison of the Determinants of MIS Use across the Research Districts 81 4.7 Comparative Qualitative Analysis of the Chwele and Kitale MRCs 84 CHAPTER 5 .....................................................................................................................87 5.0 CONCLUSION ............................................................................................................88 5.1 Implications for the design of MIS.................................................................................... 89 5.2 Implications for public policies eventually 89 5.3 Implications for future research 90 5.4 Recommendation 90 5.5 Controversies 91 BIBLIOGRAPHY ............................................................................................................................ ANNEXES: Questionnaire.............................................................................................................................
  • 5. v LIST OF ABBREVIATIONS AND ACRONYMS ACP African, Caribbean and Pacific ACP-EU African, Caribbean and Pacific-European Union ADB Asian Development Bank AfDB African Development Bank ATSAL Agroforestry Tree Seeds Association of Lantapan CAPRI Collective Action and Property Rights CCK Communication Commision of Kenya CDS Centre for Development Studies CIAT International Centre for Tropical Agriculture CIRAD French Agricultural Research Centre for International Co-operation and Development CTA The Technical Centre for Agricultural and Rural Co-operation DFID The United Kingdom Department for International Development EAGC Eastern Africa Grain Council ERI Enabling Rural Innovation EU European Union FAO Food and Agriculture Organization FARA Forum for Agricultural Research in Africa FGD Focus Group Discussion FM Frequency Modulation Freq Frequency GIS Geograpgic Information System ICT Information and Communications Technologies IFAD International Fund for Agricultural Development IFPRI Internatinal Food Policy Research Institute IICD International Institute for Communication and Development IITA International Institute of Tropical Agriculture INFONET Information Network IRC Institute of Tropical Regions ICT Information, Communication and Technology IVR Interactive Voice Response KACE Kenya Agricultural Exchange commodity KBC Kenya Broadcasting Corporation KIHBS Kenya Integrated Household Budget Survey KMDP Kenya Maize Development Program KNBS Kenya National Bureau of Statistics KSH Kenya Shilling LOGIT Logistic Max Maximum MILS Market Information and Linkage System Min Minimum MIS Market Information System
  • 6. vi MIT Massachusetts Institute of Technology MoA Ministry of Agriculture MRC Market Resource Centre NAFIS National Farmers Information Service NCPB National Cereals and Produce Board NEPAD The New Partnership for Africa's Development NGO Non-governmental Organization NRI Natural Resources Institute OECD Organisation for Economic Co-operation and Development PRA Participatory Rural Appraisal RATES Regional Agricultural Trade Expansion Support RECOTIS Regional Commodity and Trade Information System SIDA Swedish International Development Agency SME Small and Medium agro-Enterprises SMS Short Messagie Service SPSS Statistical Package for the Social Sciences Std. Dev Standard Deviation STATA Data Analysis and Statistical Software TV Television UNECA United Nations Economic Commission for Africa USAID United States Agency for International Development USDA United States Department of Agriculture Vsat Very Small Aperture Terminal WRS Warehouse Receipt System
  • 7. vii LIST OF FIGURES TITLE PAGE NUMBER FIGURE 1: POPULATION TREND IN KENYA ........................................................................................................................9 FIGURE 2: KACE MRCS IN KENYA ...............................................................................................................................22 FIGURE 3: THE RESEARCH LOCATION IN KENYA................................................................................................................25 FIGURE 4: FARMING AS MAIN SOURCE OF INCOME...........................................................................................................38 FIGURE 5: PERCENTAGE OF OTHER INCOME SOURCES.......................................................................................................39 FIGURE 6: HOUSEHOLD SIZE FOR ALL DISTRICTS .............................................................................................................40 FIGURE 7: HEADS OF HOUSEHOLD WHO CAN READ.........................................................................................................40 FIGURE 8: HHH EDUCATION......................................................................................................................................41 FIGURE 9: LEVELS OF EDUCATION IN KENYA...................................................................................................................41 FIGURE 10: SUPPORT FROM NGO PROJECT AND PERCENTAGE OF FARMERS ON NGO PHONE PRICE ACCESS HELP ........................41 FIGURE 11: RESEARCH DISTRICTS .................................................................................................................................42 FIGURE 12: KENYA POPULATION BY AGE GROUP ..............................................................................................................42 FIGURE 13: ACCESS TO PHONE NETWORK.......................................................................................................................44 FIGURE 14: KENYA MOBILE PHONE SUBSCRIBERS .............................................................................................................44 FIGURE 15: SAFARICOM AND ZAIN NETWORK..................................................................................................................45 FIGURE 16: PERCENTAGE OF BUYERS WHO CONTACT BUYERS FOR PRICE ...............................................................................46 FIGURE 17: PERCENTAGE OF OTHER CONTACTS BY BUYERS FOR PRICE...................................................................................47 FIGURE 18: PERCENTAGE OF BUYERS WHO CONTACT SELLERS FOR PRICE...............................................................................47 FIGURE 19: MRC BOARD .........................................................................................................................................48 FIGURE 20: SOKO HEWANI..........................................................................................................................................48 FIGURE 21: SMS REQUEST .........................................................................................................................................49 FIGURE 22: NUMBER OF HANDSETS ..............................................................................................................................53 FIGURE 24:KENYA HOUSEHOLDS WITH A COMPUTER .......................................................................................................57 FIGURE 25: CREDIT ACCESS.........................................................................................................................................58 FIGURE 26: AWARENESS ABOUT MRC ..........................................................................................................................59 FIGURE 27: BENEFITS AND RESPONSES TO BIDS................................................................................................................60 FIGURE 28: BENEFITS TO SELL QUICKLY AND SELL AT HIGHER PRICE ......................................................................................60 FIGURE 29: BENEFICIARIES FROM MAKING OFFERS AND BIDS ON MRC.................................................................................60 FIGURE 30: PERCENTAGE OF BENEFICIARIES OF BIDS.........................................................................................................61 FIGURE 31: PERCENTAGE RESPONSE TO BIDS...................................................................................................................61 FIGURE 32: REQUESTS FOR MAIZE OFFERS......................................................................................................................62 FIGURE 33: AWARENESS/KNOWLEDGE OF CELL PHONE .....................................................................................................62 FIGURE 34: PERCENTAGE AWARE ABOUT SMS AND IVR SERVICE........................................................................................63 FIGURE 35: PERCENTAGE OF SMS AND IVR REQUESTS .....................................................................................................63 FIGURE 36: PROPORTION OF FARMERS WHO MAKE MAIZE OFFERS TO BUYERS .......................................................................64 FIGURE 37: PERCENTAGE OF SELLERS TO THE SAME BUYER.................................................................................................64 FIGURE 38: PERCENTAGE OF BUYERS FROM THE SAME SELLER ............................................................................................65 FIGURE 39: PERCENTAGE OF OTHERS WHO SELLER CONTACTS FOR PRICE...............................................................................65 FIGURE 40: % OF MOBILE PHONE USE FOR PRICE CONFIRMATION .....................................................................................66 FIGURE 41 PERCENTAGE OF MOBILE PHONE USE BY BUYERS TO SELLERS...............................................................................68
  • 8. viii LIST OF TABLES TITLE PAGE NUMBER TABLE 1: KACE MARKET RESOURCE CENTRES..........................................................................................................22 TABLE 2: BUNGOMA SMS USERS AND NON-USERS....................................................................................................36 TABLE 3: DISTANCE FROM MARKET AND ROAD........................................................................................................36 TABLE 4 SIAYA SMS USERS AND NON-USERS ..........................................................................................................36 TABLE 5: BUNGOMA, KITALE AND SIAYA SMS USERS AND NON-USERS..........................................................................37 TABLE 6: BUNGOMA, KITALE AND SIAYA SMS USERS AND NON-USERS..........................................................................38 TABLE 7: SIZE OF HOUSEHOLD BY DISTRICT ..............................................................................................................39 TABLE 8: DISTANCE FROM MARKET AND ROAD.........................................................................................................43 TABLE 9: CHOICE OF PRICES AT MRC.....................................................................................................................45 TABLE 10: AWARENESS OF THE EXISTENCE OF KITALE MRC (KITALE SAMPLE ONLY)..........................................................46 TABLE 11: USE OF INFORMATION ON MAIZE OFFERS AND BIDS FROM SMS, IVR AND MRC ................................................50 TABLE 12: USE OF INFORMATION ON MAIZE AND PRICES FROM SMS, IVR AND MRC........................................................50 TABLE 13: OWNERSHIP OF HANDSETS .....................................................................................................................72 TABLE 14: MEMBERSHIP IN FARMERS’ GROUPS .........................................................................................................73 TABLE 15: COLLECTIVE GROUP SALES ......................................................................................................................55 TABLE 16: ACRES OWNED AND CULTIVATED..............................................................................................................74 TABLE 17: ACRES CULTIVATED ..............................................................................................................................56 TABLE 18: MOTORCYCLE......................................................................................................................................57 TABLE 19: OWNERSHIP OF AT LEAST ONE TV SET .......................................................................................................57 TABLE 20: PERCENTAGE OF BORROWERS .................................................................................................................58 TABLE 21: CHOICE OF BIDS TO BUY .........................................................................................................................59 TABLE 22: ACCESS TO MAIZE PRICE INFORMATION VIA MOBILE PHONE............................................................................67 TABLE 23: AWARENESS OF THE EXISTENCE OF CHWELE MRC........................................................................................68 TABLE 24: AWARENESS OF THE EXISTENCE OF THE CHWELE MRC ....................................................................................69 TABLE 25: AWARENESS OF THE EXISTENCE OF KITALE MRC.........................................................................................70 TABLE-26: AWARENESS OF THE EXISTENCE OF KITALE MRC .........................................................................................71 TABLE 27: OFFER TO SELL AT CHWELE MRC.............................................................................................................72 TABLE 28 OFFER TO SELL AT CHWELE MRC .............................................................................................................72 TABLE 29: OFFER TO SELL AT KITALE MRC.............................................................................................................73 TABLE 30: OFFER TO SELL AT KITALE MRC.............................................................................................................74 TABLE 31: BID TO BUY AT KITALE MRC...................................................................................................................74 TABLE 32: BID TO BUY AR CHWELE MRC...............................................................................................................75 TABLE 33: USE MOBILE PHONE OR NOT TO REQUEST FOR MAIZE PRICE IN BUNGOMA......................................................... 56 TABLE 34: USE MOBILE PHONE OR NOT TO REQUEST FOR MAIZE PRICE IN KITALE .............................................................57 TABLE 35: REQUEST ODF MAIZE PRICES BY IVR LAST YEAR (2009-2010) IN BUNGOMA.......................................................77 TABLE 36 REQUEST ODF MAIZE PRICES BY IVR LAST YEAR (2009-2010) IN KITALE ..........................................................77 TABLE 37: LISTERNERSHIP TO KBC RADIO LAST YEAR (2009) IN BUNGOMA..................................................................78 TABLE 38: LISTERNERSHIP TO KBC RADIO LAST YEAR (2009) IN KITALE ........................................................................78 ABLE 39: LISTERNERSHIP TO WEST FM RADIO LAST YEAR (2009) IN BUNGOMA ..................................................79 TABLE 40: ABLE 39: LISTERNERSHIP TO WEST FM RADIO LAST YEAR (2009) IN KITALE ..................................................79 TABLE 41: DO YOU GO TO THE CHWELE MRC?.......................................................................................................... 80 TABLE-42: DO YOU GO TO THE KITALE MRC? ..........................................................................................................80 TABLE 43: COMPARISON OF THE DETERMINANTS OF MIS USE ACROSS RESEARCH DISTRICTS ......................................81 TABLE 44: CONTRASTS AND COMPARISONS BETWEEN CHWELE AND KITALE MRC................................................................84
  • 9. ix LETTER OF TRANSMITTAL AND ACKNOWLEDGEMENT Here is the report requested for, regarding my research in Kenya. My research task involved insightful participation in the co-ordination of a farmers’ survey research whose findings will follow shortly, in the bulk of these document. I am highly indebted to Montpellier SupAgro-IRC, CIRAD, The University of Copenhagen-LIFE, KACE, and the farmers in Bungoma, Kitale and Siaya in Kenya; for their resourcefulness at various stages of the research period. Especial thank you is to my supervisors Franck G., at CIRAD; Kostas K., at the University of Copenhagen, and Julie S., at INRA, for their close and helpful guidance in the course of the research and the final processing of data and the writing of the report. I highly appreciate their competent and thoughtful comments. Not in the least, I am also grateful to Betty W., at Montpellier SupAgro-IRC, for allowing ample time so that I could submit a complete report. Her comments on the structuring of the report were also handy. Thanks are also due to the KACE management for its co-operation during the research in Kenya. Besides, the work which was done by the enumerators to help in administering questionnaires is recognized here. I am most obliged to the opportunity which enabled me to accomplish this research; and to gather a wealth of knowledge. As I see my task now concluded, I naturally voice my deepest appreciation to all the others whose efforts, although unmentioned here, made possible the accomplishment of this report.
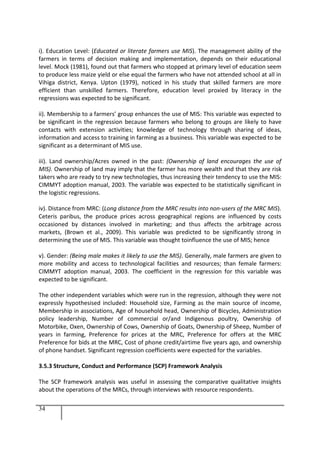
  • 10. x ABSTRACT The research explored the determinants of the use of the second generation market information systems. This insight enlisted the data on mobile phone users and non-users. The study sought to demonstrate through an examination of the increasingly dominant role of efficient markets that the second generation market information systems are crucial. The case study was in Kenya, known for a wide range of food crops, climate, soils, and maize as its staple food crop, and its relative strength in increasingly liberalised and reformed marketing through the Kenya Agricultural Commodity Exchange-KACE; besides having a wider coverage of cell phone use. A purposive non-experimental quasi sampling design was enlisted, and the major sources of primary data for the study through triangulation included: participatory focus group discussions; semi-structured interviews; and administering questionnaires. Secondary sources of data included agricultural dossiers, the internet, and other specialized publications. The data analysis involved descriptive profiling of the attributes of the phone users and non-users; and the determinants of the use of MIS. The STATA, SPSS and Excel softwares were used in data processing. The scope of the research facilitated the examination of weakness in the MIS and set a basis for future detailed impact analysis of the determinants of the use of MIS, using the collected data. Nevertheless, by articulating these issues, alongside the findings by other researchers, the study contributed significantly by availing a reference output, which could be important for related debates regarding the determinants of the use of Market Information Systems (MIS). Sampling involved the selection of respondents who were able to respond to the questions asked; but had no prior knowledge of the questions. Detailed data on key aspects of the questionnaire was collected, and this included questions on variables about the farmers’ characteristics, market performace, agricultural production, and other social aspects surrounding the farm households. FGDs, interviews, and visual observations were also enlisted in the data collection. Data was analysed using a systematic (econometric) analysis using logit regressions to respond to the general logit model equation given as:     X Y Y i n i i i i p p            11 log  Where             Y Y i i p p 1 log is log of odds and both p(Yi) and 1-p(Yi) ranges between 0 and 1 and represent the dependent variables. X1, X2,…..,Xn are the independent variables; while β1, β2,….βn are the estimated coefficients. Key words: Second generation MIS, ICT, Maize farmers, Agriculture, Kenya
  • 11. xi INTRODUCTION In contrast to the assumption made by the economic theory that market players are informed and that they can engage in optimal arbitrage on a symmetric footing; indeed market information is seldom symmetric, and it is costly (Stigler 1961, Reinganum 1979, MacMinn 1980, Stahl 1989, Pelletier, 1997; Brown et al., 2002; Barrett, 2008). Further, theory as depicted by Stigler 1961; Rothschild 1973; Salop and Stiglitz, 1977; Pratt et al., 1979, denotes that costly searches for information can lower competition, thus creating inefficient allocation of goods. This observation asserts the value of market information. This masters’ degree thesis account details an explanatory and analytical account of the determinants of the use of second generation market information services (MIS) in the developing countries, based on a case study on farmers who use KACE market services. Furthermore, this exposition pinpoints out the emergent innovative role of ICTs as sources for leveraging the use and access to market information by the farmers (Munyua, 2007). Nevertheless, it seeks to shed light on the effects and perceptions regarding the access to market information in the backdrop of the role of the MIS as crucial conduits of collecting, collating, and disseminating market information. The output presented is based on a research survey which was conducted on maize farmers in the Bungoma, Kitale and Siaya regions in Kenya. The use or non-use of market information services rendered by the Kenya Agricultural Commodity Exchange (KACE) encapsuled the case study. Revelations from the survey exposed both hands-on and pilot nature approaches in the MIS functioning in market information delivery, and attributed with non-sustenance and up- scaling. The success-failure stories obtained first hand from respondents should aptly provide strong points on which to upscale and accelerate MIS delivery; while resolving the loopholes in the MISs. There is evidence of the rampant lack of the crosscutting headstart to evaluate the impact of the MIS-a scenario which is so far reportedly on-going on a merely adventitious entry point in agricultural development; and that the content and scope of the provision of market information is limited. To identify the determinants of the use of second generation MIS, the report exploited the stark differences in the operations of the MRCs in Bgm and Kitale districts with regard to the maize farmers living there. The study also compares and contrasts the respective market situations in these districts respectively, with that in Siaya district where the farmers have no access to the KACE Market Resource Centres.
  • 12. xii In the hypotheses, it is demonstrated that the use of market information is associated with certain household profiles of the farmers. This is one of the few research initiates which have so far been tailored to discovering the effects of the determinants of MIS and therefore reporting on the findings from the primary data and secondary data procured from a developing country. It should bring to the fore aspects which require indepth review in the startup and implementation of new market services. These include gauging, discussing and analysing why farmers need market information besides pinpointing the determinants of MIS use; the sources and effects of the use of the MIS. This contribution should bring into focus start-up points for consideration by implementers including farmers, traders and policymakers. The analysis of the research data was based on a region by region approach. It is however, out of the scope of this report to analyse the impact of the MIS, because of time limitation. The findings from the research survey pinpoint out the factors which influence the use of the MIS, such as the need to know the consumer preferences; understand the marketing strategies of competitors; plan for the future; handle market risks; and know the market demand. It further explores the sources of market information pinpointing them as: Other farmers, family members, traders, neighbours, cell phone SMS and IVR, fellow members in farmers’ groups or associations, West FM and KBC radio, news paper, KACE MRC boards and offices, Ministry of Agriculture and NGOs. The determinants of the use of the second generation MIS are identified as: the number of years in farming, Household size, Administrative leader, Literacy, Membership in farmers’ group, gender, membership in an association, age, distance to Kitale, distance to Chwele, ownership of cows and cars, ownership of phone handset, use of the Safaricom phone line and/or the Zain phone line. Lastly, it reveals some implicit effects of the MIS on the decisions made by farmers in resource allocation. The rest of the paper is organized as follows: Chapter 1 presents the background on the MIS situation, and it depicts the problem statement and the research objective. In Chapter 2, a detailed description of the case study in Kenya involving the Kenya Agricultural Commodity Exchange and its market information services is presented. On the other hand, Chapter 3 demonstrates a brief conceptual discussion on the research methodology which was used. Here, the logistic regression approach is shown and the LOGIT model variables are briefly described. The findings from the survey are then presented in Chapter 4, by way of concrete results, analyses and discussions. Chapter 5 concludes the research and its findings.
  • 14. 2 1.0 BACKGROUND This section of the report explores the documented account on the market information systems. Technological change has transformed agriculture in the US, Europe and large parts of Asia and South America, but it has largely by-passed Africa (Brown et al., 2009). During the 1920s and 1930s, governments in the developed countries expended undue effort in setting up the MIS (Egg and Galtier, 2003). On the other hand, in stark contrast to the seemingly abject situation of erratic access to information by many farmers in ACP countries where agriculture supports half of the economy; the European farmers have access to more than 2,000 market information outlets in the form of internet platforms and other market information repositories including specialist publications, journals, government entities, traders and farmers’ unions. This is notwithstanding agriculture being a farthing 2% ingredient of the European economy. MIS in the developed countries such as Britain and Canada generally exhibit more efficiency compared to those in sub-Sahara Africa. Farmers in the developed nations regard market information as requisite for commercial operations. Indeed, wealthier countries have marked benefits from market information (Baye and Morgan, 2001; Brown and Goolsbee, 2002; Baye, et al, 2004; Ellison and Ellison 2005; Ferris and Robbins, 2006). As from 1990, the reform efforts in sub-Saharan countries have largely emphasized liberalization in the sphere of agricultural markets. In this connection, direct governmental market interventions via marketing boards or parastatal organizations have so far been ceded considerably. The MIS were operationalised alongside the reforms, primarily as a means of checking asymmetries emanating from economic liberalization. This measure would foreseeably lend bargaining power to farmers, and thus increase transparency, liberal trading, besides more efficient, inclusive and participatory market systems for all stakeholders (Egg and Galtier, 1998; Tollens, 2006). The 1980s-1990s era denoted donor-aided investment by the developing countries, in the first generation MIS and other structural reforms. This was geared towards consolidating markets in order to increase rural farm household incomes by giving impetus to more agricultural production through market reinforcement and incentives (Shepherd, 1997; Dioné, 2000; Dembélé and Staatz, 2000; Dembélé et al., 2000; Ferris et al., 2004). However, the past 10 years have evoked much concern from development partners who have urged governments, NGOs amongst other stakeholders to beef up the assessment the effects of the MIS on the perceptions of farmers on farming. Notably, the MIS in the developing countries do falter in their performance after the withdrawal of donor funding, because governments do not follow up to sustain the financial support of MIS (Shepherd, 1997; Aldridge, 1999). The lack of alternative and sustainable funding sources, difficulty in quantifying MIS impacts, coupled with the public- good element in the MIS greatly hamper their efficient performance (Shepherd, 1997).
  • 15. 3 Therefore, after two decades of oversights by key stakeholders on the relevance of agricultural development, a recall of the crucial function of agriculture is now in consideration, as attested to by the documentation of the 2008 world development report, focusing on agriculture and its role in development and alleviating poverty (World Bank 2007). In this reflection, the use of ICT in agriculture in Africa has emerged. The e- agriculture phenomenon has hitherto been prominently attributed to the facilitation of the access to market information by farmers. This effort entails the need to scrutinize the appropriateness of the MIS and the conditions in which they operate. Dembélé et al., (2005), noted that at least six essential factors in the successful design and implementation process, as follows: 1. An initial political commitment to an MIS by country-level policy makers as well as private clients, guided by a vision of how such a system can help both private and public sectors; 2. Continued financial medium-term support for the MIS; 3. Sustained re-evaluation of the MIS and focusing on the needs of MIS users alongside political and financial support prospects; 4. Capacity-building the MIS and customizing them to resonate in tandem with the know- how of the stakeholders and the in-country processes in the conduits of marketing; 5. Enhancing the human resource capital for managing the system; and 6. The choice of appropriate institutions in order to streamline the MIS. Efficient MIS can be an “open sesame” and impetus for the resource-poor farmers to utilize in-technologies; and this may incorporate: ready marketing of the produce, capacity- building by hands-on staff, real-time or accurate information, subsidized inputs, the creation of special credit schemes, the availability of highly qualified staff or accurate and timely information. The economic gist of the MIS encompasses participatory agricultural commercialisation in which smallholders can access the market information; and farm as a business but not as a mere subsistent way of life. It is also notable in principle that MIS bear multiple benefits such as increased returns stemming from shifting the cropping patterns to added-value products, synchronising the selling of the produce when prices are reasonable, or by selecting niche markets and traders (Shepherd, 1997; Milligan et al., 2010). Besides, policy makers may utilise information from efficient MIS to pinpoint regions which have significantly disparate prices relative to the norm, and thus respond appropriately, on account of food insecurity (Shepherd 1997; Ferris et al., 2006b). In the same way, functioning MIS must deaden market transaction costs, and hence facilitate a subsistence- to-commercial agriculture transformation amongst the small-scale farmers in Africa, whose marketing opportunities are already compromised by dysfunctional or inefficient marketing chains (Ratnadiwakara and Silva, 2008). On a broad basis, the less than par utilization of the intra-regional trade and production potential, Africa suffers deficits in export market shares. This scenario resides in the backdrop of non-uniform asymmetries in market perceptions by the agribusiness entities and private agro-industry; as occasioned by fragmentation and thus a fragile regional integration. This situation denotes an implicit acceleration of the disconnection of farmers and agriculture in Africa from the regional/continental and global market. On these premises, Africa is yet to bear the daunting task of ensuring uninterrupted access of food
  • 16. 4 and agricultural systems to the intra-African market. To counter potential regression in the market efficiency, the establishment of fully-fledged market information systems (MIS) is crucial. This will check lapses of inaccurate market information which could otherwise be a non-tariff barrier, thus stifling intra-regional trade, and hence economic growth. In this keeping, UNECA is operationalising and leveraging the RAMIS to bolster agricultural trade in Africa, facilitate knowledge exchange, and offer a boon to agricultural productivity. This intervention is worthwhile, given the transient complexion of the socio-economic and political settings of Africa on a liberalization platform; concurrently pitting the increasing involvement of the private sector against the waning public sector involvement in the provision of market information. The liberalisation of agricultural markets in African countries, followed by the provision of independent market information is to all stakeholders in the commercial chain is believed to be able to reduce distortions in the agricultural markets. Presently, the many operational initiatives on ICTs in Africa, with focus on the smallholders have a tendency to be inadequately systematized, and they also exhibit difficulty to be accessed easily; not mentioning awareness of which determinants, farmers’ needs, and other sources of market information which influence the choice of using or not using ICTs. In addition, the effects of mobile telephony to improving livelihoods and reducing poverty in Sub-Sahara Africa remain a contentious issue. Although it is recognized that the uptake of promising information technologies like rural telephony can be influenced greatly by the availability and/or functioning of input supply, credit systems, land-tenure arrangements, organization of marketing, and the distribution of benefits; such social-organizational phenomena have mostly been considered as conditions that hamper or enhance adaptation of rural telephony (Gakuru et al., 2008). 1.1 First Generation MIS The expectations are that MIS should tangibly bolster market efficiency. The first generation MIS were first launched in most developing countries during the 1980s for many types of products including cereals, tubers, fruits, vegetables, and livestock. These were essentially first generation MIS. They received unreserved attention and support from donors and international agencies who viewed them as fundamental gadgets in the realisation of the restructuring and liberalization of agricultural markets. This philanthropic overture supported the proliferation of the MIS in Africa, Asia and Latin America, to the extend that FAO necessarily consolidated an explanatory MIS inventory (Shepherd, 1997). The first generation MIS had a similar configuration which featured focus on a particular country and a group of products; price information exclusively; collection of the price information from sample markets in the country then centralizing, selecting, and then disseminating it free of charge nationally via radio and other media. They were heavily donor-funded and centrally managed by either government departments or projects. Although extensive positive impacts were expected, this has not yet been evidenced adequately and empirically. Tollens (2006), points out a gaping lack of impact evaluation of the MIS. He also singles out that questions of whether or not the resource-poor farmers have sufficiently gained proximity and access to the markets; or whether mechanisms of
  • 17. 5 price discovery have been efficient remain largely unanswered but yet debatable. The first generation MIS were feasibly handicapped by various herculean obligations. Firstly, they had to reliably collect data and quickly relay it to stakeholders on the market. Secondly, they needed to customize information delivery to the needs of the stakeholders. Thirdly, they had to guarantee sustainability of the MIS especially on a financial dimension; and fourthly, they had to enhance participation and minimise bias and exclusion in their service delivery. Bowbrick, (1988) asserts that public price reporting systems habour ineffectiveness in terms of errors in recording, processing and conceptualising data; otherwise deeper analyses must prove the contrary. Hence, he notes that they provide the wrong information to the wrong people at the wrong time. The loopholes in the first MIS precipitated the need for devising state-of-the-art solutions to provide agricultural market information. This was a precursor to the renaissance of a new means of relaying market information. As a result, with the advent of innovations in ICTs such as internet and mobile phones in the 2000s era, second generation MIS especially composed of the ICT element were formulated. The new MIS have a decentralized management; are interactive; have certain levels of privatisation; target producers; and are flexible (Aker, 2008). The mobility of the second generation MIS allows them a sometimes- linkage with other market entities such as warehouse receipt systems (WRS), commodity exchanges or multi-stakeholder round tables. The new MIS are comprised of diverse innovations and they provide many services. 1.2 Second Generation MIS However, the seemingly lucrative venture into the revamped second generation MIS is in a limbo which calls for global awareness campaigns about the new MIS alongside their impact in providing market information. The Forum for Agricultural Research in Africa (FARA) reconciled an inventory in 2008 to explore the innovative ramifications of the market information systems with regard to farmers in Africa. Observations of which revealed that MIS projects were merely being piloted and that indicators and determinants of their being used and their impact had so far not been examined (Mahoney and Smale, 2010). The only notable comparative assessment of MIS (Shepherd 1997) was done before the emergence of the second generation MIS, and in fact only a handful studies on MIS impact have been actualised. Also, certain misgivings have been raised about the methodologies which are enlisted in evaluating the MIS impacts, thus casting aspersions on evaluations hitherto. Conversely, the presently accessible MIS information suffices to account for their myriad differentiation and their associated prevalent innovations. 1.3 Needs of Farmers Small-scale farmers need equitable and appropriate market prices and signals in order to tailor their production to consumer needs. The farmers need market information in order to know when and how to acquire and/or dispose their commodities; in view of price, place of
  • 18. 6 transaction, grade, quality and the quantity of the commodity on demand or for sale, transport, and local administrative requirements (Ferris and Robbins, 2006; Neils, 2006). This means the farmers who have equitable and appropriate market price information and signals can then be able to tailor their production to consumer needs (Ferris and Robbins, 2006). Both formal and informal markets are important for the needy smallholders who have to sell their labour and products, to ensure upkeep of their livelihoods regarding making investments and self insurance against risks (Kpènavoun, 2009). Efficient markets will stimulate growth and pave way for opportunities for the poor (World Bank, 2001). Indeed, increased access by smallholders to well remunerated markets is pivotal in the rural poverty reduction strategy. MIS are under a rapid momentum of transformation, as proven by the replacement of traditional ad hoc sales marketing conduits; by streamlined linkages amongst market stakeholders such as farmers, retailers, processors and wholesalers. The buyers expect the farmers to timely and reliably supply the market with products of the needed quality, quantity, and traceability. However, high-value product markets may be inconsistent and with competitive prices, thus inhibiting the competitiveness of the smallholders (Shepherd, 2007). Public MIS should mainly enhance competition on the market by fostering participatory and all-inclusive market transparency. Market transparency as a factor which drives liberal competition and upbeat marketing performance, is a crucial trendsetter in the empowerment to sufficiently access the awareness about prices, qualities, quantities, and conditions of sale; which in turn are indispensable arbiters in the shrewd marketing and production decisions (Shepherd,1997). On these premises, the farmers can tailor and strategise their sales, production and consumption decisions in order to attain certain market incentives and satisfy their share of needs. Macro-economically, market transparency ushers vertical co-ordination into the market chain to the effect of issuing authentic prices which help in regulating production and consumption with the focus on optimising welfare and maximising efficiency for tangible economic growth (Gilbert and Tollens, 2002). Improving access to market information is essential in enabling the farmers to be informed and to respond to the fluctuating demands and the shifting consumer preferences. This situation provides a decision-making framework about farming, storage, processing, marketing and investment (Shepherd, 1997; Ferris et al., 2006a; World Bank, 2007). There could also be a spill-over effect of procuring market research and the examination of the changing nature of consumption (Ferris and Robbins, 2006). Efficient MIS help in creation of an even spatial distribution of products within markets and inter-regionally. Farmers who have access to quality historical market information and possibly make crop planting decisions. On the other hand, well informed traders can shrewdly determine the viability of both intra and inter-seasonal storage. Researchers and agricultural planners can also utilize historical information to avail early warning of imminent crises in food security. Predicting prices for food staples in poor regions is
  • 19. 7 indispensable for combating food insecurity, which is most frequently caused by insufficient access to food instead of absolute lack of food availability. However, this forecasting of grain prices is often challenged by the scarcity of data (Brown et al., 2009). In the economies of the developing countries, market information is a key public good on account of the many smallholders to whom costs of marketing and production information are generally out of the farmers’ means of provision. 1.4 Sources of Information Farmers access market information mainly from sources which are institutionalised, product-specific and platform-specific. ICTs as sources of market information may include voice information, radio dial-up and broadcasts, extension outreach services based on cell phones, database monitoring, e-learning for basic skills, video-based approaches and digitalised agricultural education (Mahoney and Smale, 2010). Furthermore, mainstay forms of ICTs notably radio and televisions have traditionally focused on the provision of agricultural advisory counsel (Odame, 2007). Government-controlled chambers of agriculture have attempted to set up information centres in a bid to streamline the ICTs to function effectively both as conveyors and repositories of agricultural information. For example, in close keeping with this effort is the rendering of market information service via the voice-based National Farmers Information Service (NAFIS) and the web-based INFONET. Similarly, select NGOs and research entities have been at the forefront in proactively spearheading technology transfer in the agricultural sector. Additionally, extension workers, libraries and websites currently comprise the main channels of providing market information to the farmers (Aker, 2008; Barasubramanian, 2008; Gakuru et al., 2008). 1.5 The Determinants of the Use of MIS The complexion of the rural settings is on a rapid wave of unpredictable change, while the advent of ICTs has simultaneously rendered the world a global village and augmented the crosscutting contrasts in lifestyles globally. Efficient markets and fecund farm land are conditional for the attainment of bumper agricultural productivity; yet nearly two-thirds of the 1.7 billion farmers in low and middle income countries still grapple with retrogressive poor farm land or inhibited access to markets (Gakuru et al., 2008). Further, the limited or costly information, as is the general case in reality (Stigler, 1961); hinders optimal leverage of arbitrage by the farmers, thus, potentially occasioning excess price dispersion and inefficient allocation of resources on the market. Most developing countries generally have scattered markets and the infrastructure for communication is dilapidated (Jensen, 2007). This necessitates information in order to foster market performance; as theorised by many economists. The smallholders are constrained by limited information on prices; lack of credit; inadequate access to transport facilities, technologies and market trends; checked entrepreneurial and lobbying skills; plus both weak group and haggling power. This plethora of inhibitions does
  • 20. 8 not enable the farmers to exhaustively respond to the opportunities on the market (IFAD 2003; Markelova and Meinzen-Dick 2006; World Bank 2007). Hence, (IFAD, 2003) points out that smallholders do not have a clear-cut basis on which to negotiate market prices or plan market-oriented production. In effect, they are rendered passive and exploitable on the market; besides being unaware of the complete value of their production (IFAD, 2003: 10). High costs of transport, unreliable information on commodity prices, together with the inability to clarify product quality, renders farmers in the developing countries vulnerable to manipulation by intermediaries whose exclusion from the transactions can cause more market efficiency (Siamwalla, 1978; Besley and Burgess, 2000). Economists and policymakers are increasingly recognising that this dwindles both profit margins and incentives regarding production and product quality, hence compromising equity and efficiency (Bardhan, 1989; Jason, 2004; Goyal, 2010). Characteristically, the majority of subsistent producers in the developing countries opt out of markets despite price incentives for them to break out from the perverse optimal choice (Barrett, 2008). In this case, some impetus stemming from the transaction-cost theories has informed the application of various conceptual and empirical analyses of this seemingly viscous cycle. These probes have been done, following the pioneering input by de Janvry et al., (1991) and Goetz (1992). Their research findings point at inflated market entry costs, which are substantially ascribed to costs of accessing market information. On the basis of this observation, concerted proactiveness is being leveraged to effect the implementation of the MIS. However, literature also points out that to design a comprehensive policy package to eliminate the agricultural subsistence trap is problematic. Additional analysis is therefore useful. The review of the literature indicates a gap, which, if filled, could be a good starting point for improving the policy agenda. Indeed, until now the smallholder market participation research agenda focuses mostly on the (discrete) decision to participate or not, in the market; as well as the intensity of the participation. The risks issuing from production, price and access to resources must be curbed, if smallholders who are potential victims to these predicaments are to be bailed out of this precarious situation. In Africa, the hiatus in the currently erratically developed status of the “hard” infrastructure such as power, roads, and water supply; tends to stifle business development and economic growth. Further, it is noteworthy that more than half of the land in Africa is agriculturally non-productive and the soils are heavily leached. That notwithstanding, institutional lapses account for much of the hindrance on Africa’s agriculture. To counter this case, the competitively emerging ICTs in Africa are a plausible “soft” infrastructure on target. The ICTs have been primed to provide the much needed panacea to broaden market participation and the adoption of innovative market information services. The ultimate output and “thread” of consistency is the feasible reduction of transaction costs and volatile price risks and therefore the sealing of the costly gap in economic growth (Mahoney and Smale, 2010).
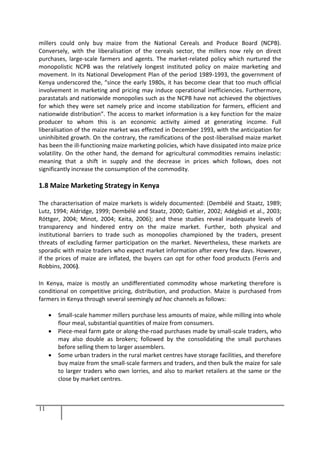
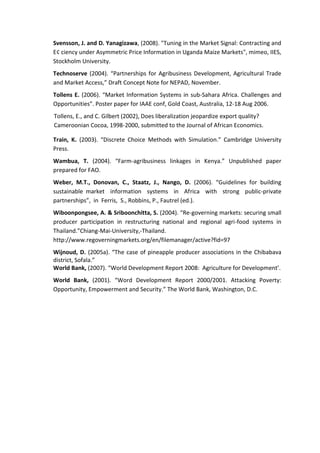
  • 21. 9 1.6 The Effects of MIS In espousing the economic theory, Stigler (1961) explained the role of information in the efficient functioning of the markets. In spite of this, rampant lack and asymmetries of information characterize the market situation in the developing countries and of concern is that only a few data-based empirical studies have been done to determine the effects of information on the markets. Principally, limited revelation exists in the public domain with regard to the outcome of supporting the access to market information on how the farmers decide what to produce, where to sell, how much to sell; besides the prices received by the farmers from their production. 1.7 Market Information Systems in Kenya Kenya's population has grown exponentially from the 2.5 million at the beginning of the last century to the current figure of 38.6m people. There are 38,610,097 people in Kenya: 19,192,458 male and 19,417,639 female, according to the official 2009 population KNBS census. In 1962, Kenya had 8.62 million people, a figure which rose to 10.9 million at the 1969 census, 15.3 million in 1979 and up to 21.4 million in 1989. Figure 1: Population Trend in Kenya Source: KNBS, 2010 Agricultural markets in Kenya are constrained, among others by; long chains of transaction between the farmer and the consumer; poor access to appropriate and timely market information; small volumes of products of highly varied quality offered by individual smallholders; and poorly structured and inefficient markets. The lack of market information represents a significant impediment to market access especially for smallholder poor farmers: it substantially increases transaction costs and reduces market efficiency. For any one commodity, the marketing chain consists of multiple middlemen, each taking a margin at every stage of the chain, and price variations in space and time are often large and erratic. In Kenya, one out of every two acres of land allotted crop production has maize (Zea mays). Maize is the primary staple food for over 85% of the Kenyan population whose per capita
  • 22. 10 maize consumption is 98 kilogrammes. Further, this constitutes a 28 percent expenditure of incomes on maize, by the least-income quartile of Kenyans and notably, a deficit in maize actually denotes famine. In view of the area cultivated, maize is third worldwide, after wheat and rice. Also, maize, the highest yielding cereal crop, thrives at both high and low altitudes and has the greatest average world yield of 4.3 tonnes per hectare (World Grain, September, 2000) 1 . However, maize farming in Kenya has for a long time been done as “farming as a way of life” rather than “farming as a business”. This scenario has been occasioned by poor access by small-scale farmers to markets, inefficient government extension services, ill adoption of improved technologies, inappropriate or inadequate use of farm inputs such as fertilizers and quality seed, and both inept producer organizations and human resource delivery. In Kenya 1,400,000-1,600,000 hectares of maize are cultivated annually. About 3.5 million smallholder maize farmers account for close to 75 percent of the maize production in Kenya, whereby the production is mostly on farm sizes of below two hectares (5 acres). The majority of small maize producers set aside part of the maize produce for subsistence. The remaining 25 percent of maize production comes from a mere 1,000 large-scale producers, almost entirely located in the Trans-Nzoia and Uasin Gishu districts in the Rift Valley province. The productivity of maize differs depending on agro-ecological zones. In Kenya, the national average yield is 1.8 tonnes per hectare; although 4-8 tonnes per hectare so far attained by some farmers indicate the potential for increment. However, in the immediate past, maize production in Kenya has been short of the 3.06 million national consumption demand. The decline in production is attributable to poor market prices, lack of credit facilities, weakness of infrastructure (market, communication, roads, and electricity), and transient weather. On the other hand, Kenya achieved maize production sufficiency during a few years in the 1970s; and exported some maize; but this did not necessarily create overall food security for individual households. Kenya resorted on spearheading economic reforms such as eliminating price legislation and liberalisation of grain marketing in agriculture since the mid-1980s, and reinforced them in the early 1990s (Wambua, 2004). The reforms aimed at inducting private sector participation in the production, value-addition, marketing and the trading of the agricultural commodities. Prior to the reforms, state-controlled marketing boards wielded the monopoly of marketing major agricultural commodities. Presently, in Kenya nearly 80 percent of all maize purchases are done by four maize millers and their associates. Previously, the maize market was monopsonistic 2 such that maize 1 Source: http://www.fas.usda.gov/current2000.html: Accessed on 27th October, 2010 2 Monopsonistic here means only one buyer purchases and uses the product
  • 23. 11 millers could only buy maize from the National Cereals and Produce Board (NCPB). Conversely, with the liberalisation of the cereals sector, the millers now rely on direct purchases, large-scale farmers and agents. The market-related policy which nurtured the monopolistic NCPB was the relatively longest instituted policy on maize marketing and movement. In its National Development Plan of the period 1989-1993, the government of Kenya underscored the, “since the early 1980s, it has become clear that too much official involvement in marketing and pricing may induce operational inefficiencies. Furthermore, parastatals and nationwide monopolies such as the NCPB have not achieved the objectives for which they were set namely price and income stabilization for farmers, efficient and nationwide distribution”. The access to market information is a key function for the maize producer to whom this is an economic activity aimed at generating income. Full liberalisation of the maize market was effected in December 1993, with the anticipation for uninhibited growth. On the contrary, the ramifications of the post-liberalised maize market has been the ill-functioning maize marketing policies, which have dissipated into maize price volatility. On the other hand, the demand for agricultural commodities remains inelastic: meaning that a shift in supply and the decrease in prices which follows, does not significantly increase the consumption of the commodity. 1.8 Maize Marketing Strategy in Kenya The characterisation of maize markets is widely documented: (Dembélé and Staatz, 1989; Lutz, 1994; Aldridge, 1999; Dembélé and Staatz, 2000; Galtier, 2002; Adégbidi et al., 2003; Röttger, 2004; Minot, 2004; Keita, 2006); and these studies reveal inadequate levels of transparency and hindered entry on the maize market. Further, both physical and institutional barriers to trade such as monopolies championed by the traders, present threats of excluding farmer participation on the market. Nevertheless, these markets are sporadic with maize traders who expect market information after every few days. However, if the prices of maize are inflated, the buyers can opt for other food products (Ferris and Robbins, 2006). In Kenya, maize is mostly an undifferentiated commodity whose marketing therefore is conditional on competitive pricing, distribution, and production. Maize is purchased from farmers in Kenya through several seemingly ad hoc channels as follows:  Small-scale hammer millers purchase less amounts of maize, while milling into whole flour meal, substantial quantities of maize from consumers.  Piece-meal farm gate or along-the-road purchases made by small-scale traders, who may also double as brokers; followed by the consolidating the small purchases before selling them to larger assemblers.  Some urban traders in the rural market centres have storage facilities, and therefore buy maize from the small-scale farmers and traders, and then bulk the maize for sale to larger traders who own lorries, and also to market retailers at the same or the close by market centres.
  • 24. 12  Larger traders and keen agents with trucks purchase maize from assemblers and farmers to resale to NCPB, millers as well as to national commodity dealers who have linkage to food security agencies, and may export at their own will.  A handful of farmers deliver maize directly to millers, commodity dealers, hunger relief agencies and NCPB.  Dynamic traders keep track of the sources of maize countrywide, and from other neighbouring countries. These traders have no lasting storage facilities and trade in other commodities on the basis of where higher returns accrue from. Emergent marketing strategies in Kenya feature the innovation of the warehouse receipting marketing system (WRS) operationalised by the Eastern Africa Grain Council (EAGC). This is geared towards resolving aspects of seasonality, and consistency in quality and supply, and fostering regional trade. The EAGC is accountable to enhancing the improvement of the grain sector trade and policy in the producer-consumer value chain. The WRS basically enables the farmers to sell only when the prices on the market are reasonable. Producers are also able to regulate the supply of maize, thus stabilising maize prices; besides using their commodity stocks in the warehouse as collateral to access credit from money lending institutions. In the Kenyan economy where over 60 percent of the population is estimated to be living under the acceptable poverty line, the stabilisation of the supply and price of maize is crucial, in that it allows the heavily maize-dependent producers and consumers, who are too cash-strapped to afford alternative expensive commodities, the opportunity to plan and prioritise beforehand. The ability to predict market demand and supply muffles price variability, thus enhancing both temporal and spatial arbitration (Kizito, 2009). Maize transport costs are important in the marketing process and they depend on the distance of the farmers from the markets as well as the state of the roads. The cost is estimated at 45 cents for 90 kilogram per kilometre. Further, major markets in Kenya are averagely 350 kilometres away from the major maize producing zones, hence indicating that maize transportation cost is increased on average by Kshs 157.50 per 90 kilogrammes. In some cases, transporter-trader negotiations are done to forge low cost transport which may include back-loading the truck on the return trip. The traders also form partnerships in order to collectively bulk their maize, thus reaping the associated economies of scale in the maize sub-sector. Trader activities have increased and they have gained the bigger of the maize market control from the NCPB. Traders are increasingly investing in storage facilities, and also make short-term maize supply contracts with millers and the dealers in large commodities in Kenya. According to the KMDP 3 maize production handbook, the farmers need market information mainly with respect to the following reasons: 3 KMDP is the Kenya Maize Development Programme
  • 25. 13  To be aware of the perception of the buyers or consumers in light of the existence of the produce from the other competitors.  To understand the nature of the market demand alongside the offers by the competitors.  To know the advantages wielded by the competitors.  To be able to size up the marketing strategy vis-à-vis that of competitors.  To project, forecast and simulate the future market scenario.  To be able to understand the existing risks in marketing; and uncertainties such as erratic weather changes and unpredictable market stability. Kenyan farmers can access market information through the cell phone SMS and IVR, via specific codes: 411, 247 and 0900552055 respectively. Other information sources available are Vsat, radio broadcast, and internet portals. Furthermore, traditional means of disseminating market information in Kenya are through the research-extension staff; magazines, plus grain traders and processors. Furthermore, ICTs in Kenya have also been designed to serve the innovation of mobile money in market transactions. The M-PESA innovation launched in 2007 by Safaricom of Kenya is a successful case, in a population where over 18.3 million people own cell phone handsets (Economist, 2009). Currently, there are four licensed mobile phone operators namely Celtel Kenya (Zain/AirTel), Safaricom Limited, Essar Telecom, and Telecom Kenya (which is also the only national fixed network operator). CCK 4 reported that technological convergence and competition in the mobile sub-sector has so far spurred innovations in the provision of information. 1.9 PROBLEM STATEMENT The population growth in Africa is exponential thus overwhelmingly exerting incessant demand on food and many other products of agriculture. Nevertheless, the surplus produce from the farmers often goes to waste because the producers are sparingly aware of how and when to market opportunities and the potential benefits accruable from the transactions which they can make (Ferris and Robbins, 2006). First generation MIS emerged in the aftermath of the economic reforms and market liberalization at the onset of the 1980s. They were intended to correct the asymmetries associated with the economic liberalization; empower the farmers; streamline a clear-cut trading environment; and enhance efficient market systems for all stakeholders (Tollens, 2006). While the evaluation of MIS is expected, empirical data to account for such a situation is lacking. However, the price data collected was meant to be used by the government and large institutions but not the farmers. These first MIS also had inept dissemination methods, lacked innovation and they reneged on their primary function to serve the smallholder famers (Holtzman et al., 1993; Robbins 2000). During the first generation MIS, the government paid the farmers and legislated prices of 4 CCK is the Communications Commission of Kenya
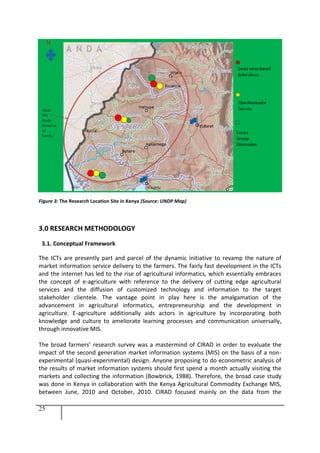
  • 26. 14 key food and cash crop commodities. Cases of success have not aptly addressed themselves to the concept of farming as a business; and instead, they have preoccupied themselves with collecting information which is usually “historical” and seldom used. Nevertheless, they have also had cases of political meddling and of duplication of MIS (Holtzman, et al., 1993; Shepherd, 1997; Ferris and Robbins, 2006). Besides, these MIS suffered bureaucratic problems, and they generally have staffing constraints, and demotivation. Smallholders lack current market information in terms of access to and use of relevant, real- time and actionable information in decision-making. Therefore, as a last resort, they despondently sell their produce to the “briefcase” sales people at whatever price on offer (Coulter et al., 1997; Röttger, 2004; Wambua, 2004; Sriboonchitta and Wiboonpongsee, 2004; Milligan et al., 2010). The supply and demand price forces on the markets for the smallholders are increasingly self-regulated and ascribe to consistent product specifications in commercial amounts. This has set up a precarious situation in which the farmers are prone to fail in fully exploiting returns for commodities such as maize which typically comprise the domain of smallholders and implicitly pose critical concerns for food security. The fluctuation calls for market intelligence in order for the farmers to comprehend and derive benefits. Smallholders lack current market information in terms of access to and use of relevant, real-time and actionable information in decision-making. Therefore, as a last resort, they despondently sell their produce to the “briefcase” sales people at whatever price on offer (Milligan et al., 2010). Well functioning markets stimulate growth and open opportunities for the poor (World Bank, 2001). However, in spite of the relevance of market information, the appraisal of the determinants of the use of second generation MIS is yet scuttled. Besides, in low-income countries, the mainstreaming of ICTs in collecting, collating and disseminating information is punctuated by the argument that much prioritisation should be accorded to the provision of other basic needs such as health, education and nutrition; despite the odds that ICTs increase earnings because of reduced market prices, and this leads to improved health and education (Jensen, 2007). This argument overlooks the crucial role played by output markets in alleviating poverty for the majority of rural agricultural households. On the other hand, while recognising that micro-level evidence of the economic role played by ICTs has so far been anecdotal; some macro-level proof of economic growth caused by ICTs is yet to be seen (Roller and Waverman, 2001). 1.10 RESEARCH OBJECTIVE AND JUSTIFICATION This section will provide insight on the focus of the research which was done, and it will explain the basis for the farmers survey on the determinants of the use of the second generation MIS. 1.10.1 JUSTIFICATION Lack of information is an entry barrier to both production and trade. The MIS are a mainstay sine qua non for enhancing the development and effectiveness of market linkage efficiency. This aspect holds true, whether the SIMs adopt a “top-down” strategy involving pinpointing
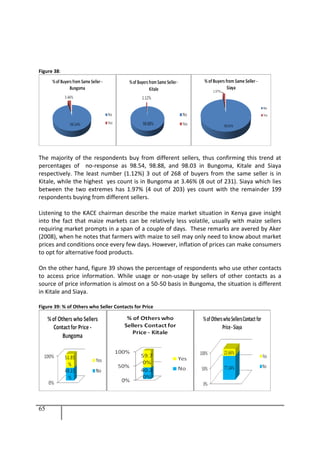
  • 27. 15 market demand and then defining the target farmers to realise it; or a “bottom-up” approach of selecting target farmers alongside markets which they need to supply (Shepherd et al., 1997; Shepherd, 2007). MIS have the potential to significantly reduce transaction costs, especially search and transport costs, and warrant continued investment and evaluation (World Bank, 2007: 120). It is most probable that social benefits of providing improved information to farmers considerably outweigh the associated investment costs. Localized, crop-specific design of the MIS can be of higher returns than the evenly distributed national multi-crop MIS. The former case would focus on crops of higher value, besides being cost-saving in terms of money and time; and increase accuracy and timeliness (Engoru et al., 2005). 1.10.2 Market Transparency and Arbitrage MIS do improve market transparency whereby the transacting parties gain access to prices and other market information. This situation can facilitate the process of spatial arbitrage involving the transfer of goods and services to geographical regions of relatively higher prices. This increases demand where the prices are low, and therefore causes both the rise in the farm gate prices, and increased supplies where supply costs are surpassed by prices. Additionally, market transparency can foster temporal arbitrage involving the hoarding of goods until when the market prices are conducive to make better sales in the future. The farmers can therefore, negotiate selling prices because they know price trends and levels. Eventually, provision of market information facilitates an authentic reflection of the aggregate prices, hence putting in perspective a reliable blueprint which depicts the national market supply and demand, as well as transport and transaction costs (Shepherd, 1997). For market transparency to thrive, and to meet information needs of the main target groups, market information must be: relevant, meaningful, reliable and impartial, easily accessible, simple, and promptly available-in particular view of price information which is essentially a perishable commodity because its value depreciates through time (Schubert, 1983; Ba and David-Benz, 2000). In all, the open produce market will be rendered fairly and equitably competitive for all the users of the MIS. 1.10.3 Reduction of Transaction Costs MIS can help farmers to reduce transaction costs by reducing the time and money required to trace traders. This also checks the time spent in bargaining before sealing a transaction; and minimizes the time spent by the farmers in identifying other trustworthy market players (Kizito, 2009). 1.10.4 Discovery of New Markets The MIS can also enable farmers to discover new and distant markets. This can feature new products and extended intra-national and international geographical coverage of markets. This effect has been observed in Mali, where the revamped market economy severed the national grain board from commercial trading (Dembélé and Staatz, 2000; Staatz et al.,
  • 28. 16 2004a). 1.10.5 Formulation of Specific Policies MIS can provide useful information necessary for the design of specific policies which are required for planning and statistical use, besides monitoring the impacts of the policies by stakeholders. This market information is also a vital element in the framework of early warning and food security (Shepherd, 1997). 1.10.6 Risk Alleviation and Efficient Allocation of Resourses In the advent of liberalisation of markets, marketing boards and minimum price programs have been faced out. This has left the famers in the developing countries to bear substantial production and marketing risks (Kizito, 2009). Market information can help farmers to avoid suicidal delivery of produce on the markets when the prices are not lucrative. Knowledge on current and future market prices also empowers the farmers to diversify crop types, and to shrewdly prioritize the allocation of their scarce resources to farm inputs including fertilizers, labour and pesticides. Thus, their farming risks are spread out (Shepherd, 1997; Minten, 1997). Rent seeking actions such as manipulative and monopolistic manoeuvres by organisations, firms or individuals in order to gain access to governmental policy provisions such as licenses and quotas can curtail the social welfare of producers and consumers who are generally not supported by trade, value addition or production (Krueger, 1974). The access to market information can improve fairness on the market and thus ensure equitable rent distribution amongst the market actors. 1.10.7 Value of Information The costs incurred and benefits which accrue from providing information service determine the value of access to quality information (Stigler, 1961). Despite the benefits cited for public MIS; they have a legacy of ineffectiveness characterised by either too slow dissemination of information, or transmitting information in the wrong format which is seldom actionable by the market players (Shepherd, 1997, World Bank 2007). A late 1990s review by FAO, on the theory and practice of MIS, documented that despite the existence of at least some kind of market information service in most countries, these services are largely not commercialised for the farmers and traders. The government strategy lacks a commercial dimension for the MIS; yet, most MIS have also been unfeasibly designed with regard to sustainability, (Holtzman et al., 1993; Shepherd, 1997: 1). Over a decade later, the wanting state of the first-generation MIS still remains relatively dismal. Nevertheless, this seeming impasse is not a dead end in itself; because the second- generation MIS have been initiated to offset this tinkering access to market information (Knudsen and Nash 1990; Ferris and Robbins, 2006). Additionally, domestic markets now have a tendency to embrace national and multinational
  • 29. 17 chains in which transactions are complex relative to the chains linked to the transactions for traditional foodstuf (DFID 2004; Markelova and Meinzen-Dick 2006). The last observation here is that a combination of escalating competition in domestic markets; lack of access to market information and largely inhibited access to overseas markets, often concurrently marginalizes small-scale farmers while benefiting the relatively large-scale farmers and traders (Ferris and Robbins, 2006). The access to income is vital in the bid for rural development, in which case, the efficient marketing of agricultural products on the basis of provision of essential market information is a pivotal ingredient. New ICTs are instrumental in facilitating this role, to the extend that they expedite aspects such as traceability and certification of farm products to function relatively efficiently than other slower conventional means. Unpredictability of the forces of demand and supply with regard to regulating the balance in the fluctuation of prices on the market is also of great concern to the farmers. Practicality compatible with such a fluctuating market scenario is quite eluding to the resource-poor farmers, who are in dire need for cutting edge market information. This necessitates the use of ICT platforms; for example to timely avail price information to the producers (IICD, 2009). The associated initiatives in market liberalization are vital with regard to most tropical agricultural commodities, as has been observed during the last decade. However, to curb potential machinations and manipulations such as obscure marketing and loss of both market transparency and power by the farmers; in the wake of the liberalization, some bilateral, national agencies and multilateral aid organizations including the World Bank, the European Union (EU), DFID, SIDA, ADB, IFAD and USAID, have been astute in promoting functionally efficient MIS to check such consequences (Tollens and Gilbert, 2002). This indulgence follows the fact that the resource-poor farmers are also market players. It followsw then, that efficient markets, alongside an enabling policy setup could be instrumental in checking poverty amongst the producers, consumers and employees in the market (Knudsen and Nash, 1990; IFAD, 2003; DFID, 2004; Ferrand et al., 2004; Boselie and Van de Kop, 2004; OECD 2006). However, despite concerted efforts to mainstream MIS in availing agricultural information, the numbers of agricultural extension workers are dwindling vis-à-vis the increasing population of farmers. Besides, retrieving market information from some of the platforms can be onerously painstaking, because it necessitates rummaging and surfing through myriad publications and detailed websites, respectively. In fact, at the outset, it might be virtually impossible for some farmers who are illiterate to access information presented in these types of media platform (Allen and Ochs, 2002). The impasse in the access to market information is exacerbated by the still erratic and fledgeling internet infrastructure in Africa. Conversely, relatively easy access is facilitated by the use of mobile phones, and SMSs which relay specific prompts that can also be customised (in the case of interactive voice service), to suit certain desired languages. However, these means are also limited by the amount and detail of information they can relay at a time; besides requiring their potential users to be literate.
  • 30. 18 CHAPTER 2 CASE STUDY AND DESCRIPTION OF KACE MIS
  • 31. 19 2.0 CASE STUDY AND DESCRIPTION OF KACE MIS The research was conducted in Kenya, in collaboration with the Kenya Agricultural Commodity Exchange (KACE), which operates as a private trading floor through market information linkage systems (MILSs). Market information systems are a vital “soft” infrastructure which can kick-start private sector investments (Jaffee, 1992; Robbins, 2000; Mahoney and Smale, 2010). The commodity exchanges are usually interlinked with the warehouse receipt marketing system buyers and sellers. The commodity exchange MIS enlist brokers in transacting purchases and sales. This mechanism facilitates agricultural marketing and furnishes up to date commodity prices. Nevertheless, commodity exchanges are relatively costly than conventional MIS, attract limited donor financing, and in the ACPs, they enable trading mainly of bulky commodities like grains (Dewet, 1999; Moustier and Zebus, 2002; Canz, 2005; Ferris and Robbins, 2006). Commodity markets have changed significantly in the last two decades, with the smallholders increasingly requiring robust market intelligence to understand and secure benefit from the new environment. This has been epitomised by increased privatisation of market institutions vis-à-vis the muffling of the leverage by governmental and parastatal marketing entities; thus causing fluctuating nominal prices. On the same footing, prices of, and demand for agricultural commodities has increased, given the upward trend of urbanisation, population growth, a growing middle class of consumers and changing consumption preferences (de Janvry et al., 1991; Milligan et al., 2010). The Kenya Agricultural Commodity Exchange Limited (KACE) developed a market information and linkage system (MILS) to increase the efficiency of agricultural markets, targeting smallholders and other small-scale agribusinesses in Kenya. The MILS involves harnessing modern information and communication technologies (ICTs) to empower farmers with low-cost reliable and timely market information to enhance the bargaining power of the farmer for a better price in the market place and link the farmer to input and output markets more efficiently and profitably. The components of the KACE MILS are: 2.1 KACE aim To be a of highest commodity exchange integrity in facilitating cutting edge trade in agricultural commodities in Kenyan, regional and international markets. It has set its mission on seeking to establish an outstanding commodity exchange to serve all global clients. 2.2 KACE objectives: • To facilitate linkage between sellers and buyers, exporters and importers of agricultural commodities; • To provide farmers and market intermediaries with various relevant and timely services, including marketing information and intelligence, to enable the farmer to negotiate.
  • 32. 20 • To provide a streamlined price discovery mechanism through exchange trading floors; and; • To harness and apply (ICTs) in rural value addition and empowerment. 2.3 Services Offered by KACE  Market Resource Centres (MRCs) which are located in rural market centers, and users visit them to receive the marketing services such as on offers to sell and bids to buy.  Mobile Phone Short Messaging Service (SMS) which uses mobile telephony to provide the marketing services (i.e. commodity price information, offers and bids).  Interactive Voice Response (IVR) service which provides marketing information through voice mail, by the user dialing the phone number: 0900881188.  Internet based database system which provides the marketing services through emails to subscribers in a database.  Radio, where marketing information is provided through an interactive rural FM radio program branded Soko Hewani (the Supermarket on Air). The KACE commodity price information is also provided through the national public radio-the Kenya Broadcasting Corporation (KBC).  Internet based database system, where information is disseminated through the internet based electronic database and website: www.kacekenya.co.ke5 . KACE has franchised some of its MRCs to local entrepreneurs; and it has also established a virtual trading floor to improve matching offers and bids to an FM radio program. KACE undertook this initiative in order to improve access by farmers and other small and medium agro-enterprises (SMEs) to input and output markets, with particular regard to market information and market linkage; in a financially affordable and sustainable manner. The franchised MRCs also offer other services, although on a smaller scale; and these include: transport brokerage in order to resolve the constraint in matching offers and bids by the smallholders; warehousing services often for short periods of time while the produce awaits to be sold at better prices; weighing services; quality control services such as testing for grain moisture using moisture meters at the MRCs; selling genuine farm inputs (fertilizers, seeds) at affordable prices; brokering financial services to farmers by banks and micro-finance institutions; and providing email service to smallholders as well as their communities in the remote rural areas in which they are located. The franchised MRCs make market price information service available to KACE and maintain the bid-offer service. Farmers are charged kshs. 100 for the placement of offers and bids at the MRC. In addition, 2-5% commission of the whole product price value is charged to the farmers, depending on the quantities of the commodities traded. These are basically commissions charged on a mutual agreement with the clients The MRCs are designed to be financially self-sustaining after two years of operation, while 5 KACE Services: Source: www.kacekenya.co.ke: Accessed on First November 2010.
  • 33. 21 providing affordable services targeted at the smallholders and SMEs. KACE oversees the activities of the franchised MRCs to ensure that they develop services which are standardized, affordable and appropriate to the needs of poor smallholders and their communities. KACE also provides capacity enhancement business training and technical assistance to the franchisees, and also offered them financial guarantees for start-up phase credit under a Rockefeller Foundation guarantee fund through a local bank–the K-Rep Bank. The franchised MRCs are developing into one-stop shops for smallholders and SMEs, stocking farm inputs and catalyzing e-commerce, thus helping to bridge the technology gap between remote rural areas and urban centers. With the franchised MRCs, KACE is now concentrating its activities at a higher level of aggregation in the marketing chain, co- ordinating the market price information service, disseminating reliable and timely market information via ICTs, working with the cell-phone and other ICT companies in refining and updating information dissemination technologies, and providing market linkage and transparency at the national level. This is developing the up-stream marketing channels for the smallholder poor farmers to market their produce beyond their local markets to national, regional and international value-added markets However, KACE faces some financial challenges with regard to the upscaling of its activities. The approximate cost to disseminate radio information has been reported to be US$120,000 per annum in Kenya (Kizito, 2010; Shepherd, 2001a; Shepherd, 2000b). On the other hand, social benefits of providing improved information to farmers considerably outweigh the associated investment costs (Kizito, 2010). Moreover, in the provision of its market information services, KACE experiences some competition from the EAGC. The KACE headquarter central hub in Nairobi, Kenya manages and co-ordinates the MILS, besides collecting the information from its MRC outlets and dissiminating it through cell phone SMSs and IVRs, and the web-based RECOTIS, and on its internet web portal. Since its inception in 1997, KACE has so far started 14 MRC outlets in Kenya; although only 9 of these MRCs are currently operational. Two (Chwele and Cheptais) of the presently 9 operational MRCs are franchises, while 2 (Kisumu and Embu) of the already closed MRCs were franchises. The scaling down and franchising was mainly occasioned by limited funds; and that notwithstanding the downsizing, but conditional on access to financing prospects, KACE still plans to extensify and intensify its activities by establishing more MRCs and innovating more marketing services. The initiative to franchise was also because farmers are willing to pay for the KACE services, thus KACE decided to involve local entrepreneurs to reach out to the farmers.
  • 34. 22 Table 1: KACE Market Resource Centres Name of MRC STATUS Month MRC Started Status of MRC Nairobi (Headquarters) January 1997 Currently Operational Bungoma January 2000 Currently Operational Kitale April 2003 Currently Operational Eldoret January 2003 Currently Operational Chwele January 2003 Currently Operational Cheptais January 2006 Currently Operational Machakos May 2004 Currently Operational Mombasa January 2001 Currently Operational Nakuru May 2004 Currently Operational Kisumu January 2001 Closed on June 2008 Karatina September 2003 Closed on April 2006 Murang’a September 2003 Closed on April 2006 Embu September 2003 Closed on April 2006 Makueni January 2007 Closed on December 2007 Figure 2: KACE MRCs in Kenya (Source: Daniel Dalet/d-maps.com)
  • 35. 23 2.4 THE RESEARCH OBJECTIVE The general objective of the research was to identify the determinants of the use of the second generation MIS and make hypotheses about the effect of the MIS and then compare KACE MIS users and non-users who have similar observed characteristics. The KACE services which were analysed include:  The provision of MRC services on offers to sell and bids to buy  Provision of SMS and IVR services via the cellphone  Market information through the KBC and West FM radio stations, respectively. 2.4.1 The Main Research Question What determines the use of the second generation market information services? / Which characteristics of farmers are likely to be sources of selection bias (i.e. affect both the use of KACE MIS and performance of farmers)? It was important to assess the determinants of the use or non-use of MIS and therefore identify the factors which significantly influence the user-nonuser scenario. This can help to determine appropriate strategies to be adopted in order to enhance MIS use. It can also be imperative to identify hindrances confronting the farmers in accessing market information. 2.4.2 Specific Research Questions 1. What influences the need of market information by the farmers? 2. What are the sources of the market information? 3. Which factors determine the use of information from the market information systems? 2.4.3 Hypothesis Several hypotheses were formulated on the basis of a selection of profiles of household characteristics such as: (Household size, Age of head of household, literacy level, gender of household head, farming as the main source of the income), ownership of assets (such as bicycles, tractors, number of cows, number of goats, number of poultry); distance from Chwele, membership to farmer’s organization, membership to farmers’ group. The postulation was that the selected attributes influence the use of the second generation market information systems (MIS). This report focuses on the following hypotheses which were tested using the LOGIT econometric model: i: Ownership of land encourages the use of MIS ii: Membership to a farmers’ group enhances the use of MIS iii: Educated farmers use MIS iv: Long distance from the MRC results into non-users of the MRC MIS v: Being male makes it likely to use the MIS
  • 37. 25 Figure 3: The Research Location Site in Kenya (Source: UNDP Map) 3.0 RESEARCH METHODOLOGY 3.1. Conceptual Framework The ICTs are presently part and parcel of the dynamic initiative to revamp the nature of market information service delivery to the farmers. The fairly fast development in the ICTs and the internet has led to the rise of agricultural informatics, which essentially embraces the concept of e-agriculture with reference to the delivery of cutting edge agricultural services and the diffusion of customized technology and information to the target stakeholder clientele. The vantage point in play here is the amalgamation of the advancement in agricultural informatics, entrepreneurship and the development in agriculture. E-agriculture additionally aids actors in agriculture by incorporating both knowledge and culture to ameliorate learning processes and communication universally, through innovative MIS. The broad farmers’ research survey was a mastermind of CIRAD in order to evaluate the impact of the second generation market information systems (MIS) on the basis of a non- experimental (quasi-experimental) design. Anyone proposing to do econometric analysis of the results of market information systems should first spend a month actually visiting the markets and collecting the information (Bowbrick, 1988). Therefore, the broad case study was done in Kenya in collaboration with the Kenya Agricultural Commodity Exchange MIS, between June, 2010 and October, 2010. CIRAD focused mainly on the data from the