Location via proxy:   [ UP ]  
[Report a bug]   [Manage cookies]                
SlideShare a Scribd company logo

1

SECOND-QUARTER 2008
FINANCIAL RESULTS
April 2, 2008

2

Forward-Looking Statements
2
Certain statements contained in this presentation are "forward-looking statements," such as statements
concerning the company's anticipated financial results, current and future product performance,
regulatory approvals, business and financial plans and other non-historical facts. These statements are
based on current expectations and currently available information. However, since these statements are
based on factors that involve risks and uncertainties, the company's actual performance and results may
differ materially from those described or implied by such forward-looking statements. Factors that could
cause or contribute to such differences include, among others: continued competition in seeds, traits and
agricultural chemicals; the company's exposure to various contingencies, including those related to
intellectual property protection, regulatory compliance and the speed with which approvals are received,
and public acceptance of biotechnology products; the success of the company's research and
development activities; the outcomes of major lawsuits; developments related to foreign currencies and
economies; successful operation of recent acquisitions; fluctuations in commodity prices; compliance
with regulations affecting our manufacturing; the accuracy of the company's estimates related to
distribution inventory levels; the company's ability to fund its short-term financing needs and to obtain
payment for the products that it sells; the effect of weather conditions, natural disasters and accidents on
the agriculture business or the company's facilities; and other risks and factors detailed in the company's
most recent reports on forms 10-Q and 10-K. Undue reliance should not be placed on these forward-
looking statements, which are current only as of the date of this presentation. The company disclaims any
current intention or obligation to update any forward-looking statements or any of the factors that may
affect actual results.
Trademarks
Trademarks owned by Monsanto Company and its wholly-owned subsidiaries are italicized in this
presentation. All other trademarks are the property of their respective owners.
© 2008 Monsanto Company

3

Non-GAAP Financial Information
This presentation may use the non-GAAP financial measures of “free cash flow,” and earnings per share (EPS) on
an ongoing basis. We define free cash flow as the total of cash flows from operating activities and investing
activities. A non-GAAP EPS financial measure, which we refer to as on-going EPS, excludes certain after-tax items
that we do not consider part of ongoing operations, which are identified in the reconciliation. ROC means net
income (without the effect of certain items) exclusive of after-tax interest expenses, divided by the average of the
beginning year and ending year net capital employed, as defined in the reconciliation. Our presentation of non-
GAAP financial measures is intended to supplement investors’ understanding of our operating performance. These
non-GAAP financial measures are not intended to replace net income (loss), cash flows, financial position, or
comprehensive income (loss), as determined in accordance with accounting principles generally accepted in the
United States. Furthermore, these non-GAAP financial measures may not be comparable to similar measures used
by other companies. The non-GAAP financial measures used in this presentation are reconciled to the most
directly comparable financial measures calculated and presented in accordance with GAAP, which can be found at
the end of this presentation.
3

4

Ongoing and As-Reported Earnings
PERFORMANCE SUMMARY
Second
Quarter 2008
Second
Quarter 2007
First Half
2008
First Half
2007
Diluted Earnings
Per Share $2.02 $0.98 $2.48 $1.14
Loss (Income) From
Discontinued
Operations
- $0.01 - $0.02
Diluted Earnings
Per Share on an
Ongoing Basis
$1.79 $0.99 $2.25 $1.16
-($0.23)
Solutia Claim
Settlement
($0.23) -
4

5

Second
Quarter
2008
Second
Quarter
2007
Change
First
Half
2008
First Half
2007
$5,878M $4,148M
$2,130M
$633M
$1.14
$290M
$3,284M
$1,385M
$2.48
$1,473M
45%
54%
108%
106%
Change
NET SALES $3,779M $2,609M 42%
54%
119%
DILUTED
EPS ON AS-
REPORTED
BASIS
$2.02 $0.98 118%
FREE CASH
FLOW 408%
GROSS
PROFIT $2,229M $1,448M
NET INCOME $1,129M $543M
PERFORMANCE SUMMARY
Second-Quarter Financial Summary
5

6

FINANCIAL OUTLOOK
Monsanto’s Strategic and Financial Opportunity Lies in
Seeds and Traits
$0
$2,000
$4,000
$6,000
$8,000
$10,000
2007 2008F 2012F
SEEDS & GENOMICS
ROUNDUP AND OTHER GLYPHOSATE-
BASED HERBICIDES
ALL OTHER AGRICULTURAL
PRODUCTIVITY
INMILLIONS
GROSS PROFIT OUTLOOK BY SEGMENT
2007-2012F
SEEDS &
GENOMICS CAGR
FROM 2008
15-18%
FLAT
ROUNDUP AND
ALL OTHER
GLYPHOSATE-
BASED
HERBICIDES CAGR
FROM 2008
Gross Profit
2008 STATUS
• New FY2008 targets of $3.6 -
$3.7B gross profit for Seeds and
Genomics; $1.7 - $1.8B for
Roundup and other glyphosate-
based herbicides
2012 OUTLOOK
2012F
$6.5-7.0B
$1.8B
$350M
SEEDS &
GENOMICS
ROUNDUP AND
OTHER
GLYPHOSATE-
BASED
HERBICIDES
ALL OTHER AG
PRODUCTIVITY
6

7

7
2008 U.S. TRAIT
PENETRATION –
ALL CHANNELS
1.6 1.4 0.95
FINANCIAL OUTLOOK
Monsanto Has Portfolio Balance That Carries Between Crops
When Acres Switch Year-to-Year
PORTFOLIO BALANCE:
INDEXED GROSS PROFIT FOR MONSANTO-BRANDED CROP OFFERINGS
0.94
1.00
0.47
0
0.2
0.4
0.6
0.8
1
1.2
CORN COTTON SOYBEANS
STATE OF AGRICULTURE:
Portfolio Balance
► In 2008, for every 1 million
acres that shift between
soybeans and corn or
cotton, on average, there is
an estimated $0.01 EPS
change for Monsanto
► With brands in corn, cotton
and soybeans, Monsanto is
positioned to meet demand
regardless of crop planting
patterns in any given year

8

FINANCIAL OUTLOOK
8
Vegetable Seed Business On Track; De Ruiter Seeds Boosts
Achievement of Identified Goals
VALUE CREATION FOR VEGETABLE SEED PLATFORM:
STAGED OPPORTUNITIES FOR INCREASING GROSS PROFIT
Focus on operational excellence; working capital management
VALUECREATIONOPPORTUNITY
Assemble genetic maps for key crops
Identify and implement opportunities to price products to value
Aggressively shift mix via protected culture and hybrid conversion
New product launches;
use of molecular markers
2007 2008 2009 2010 2011 2012
2007
Monsanto vegetable
seed sales top
$600M in 2007; 7.5%
top-line growth
2008
De Ruiter Seeds
acquisition announced –
strengthens protected-
culture portfolio
2012
Monsanto vegetable
seeds projected to
be >$1B in sales,
mid-60s margin
2012
Molecular marker platform
begins transforming
Seminis and De Ruiter
portfolios
~2010
De Ruiter Seeds accretive to
Monsanto vegetable seed EPS
contribution in second full fiscal
year following closing
OPERATIONAL EXCELLENCE NEW VALUE CREATION
PIPELINE
ADVANCEMENT

9

2008 Again Projects Double-Digit Earnings Growth,
Strong Cash Generation and Improved Margins
FINANCIAL OUTLOOK
2007 2008F
EARNINGS
ONGOING EARNINGS PER SHARE
$2.00
54% GROWTH
FROM 2006
$3.15-$3.25
58-63% GROWTH
FROM 2007
Gross Profit as a Percent of Sales 50%
53%; two years ahead of
2010 target of 52-54%
Seeds & Traits Gross Profit $3.0B $3.6 - $3.7B
Roundup and All Other Glyphosate-based
Herbicides Gross Profit
$854M $1.7 – $1.8B
All Other Ag Productivity Gross Profit $418M ~$350M
CASH MANAGEMENT AND SPENDING
FREE CASH FLOW $(57)M ~$1.3B
Capital Expenditures $509M ~$950M
SG&A as a Percent of Sales 22% ~20%
R&D as a Percent of Sales 9% ~9%
Receivables as a Percent of Sales 18% High Teens
Inventories as a Percent of Sales 20% High Teens
9

10

$1.30
$0.80
$1.04
$2.00
$3.15-$3.25
$0.50
$0.75
$1.00
$1.25
$1.50
$1.75
$2.00
$2.25
$2.50
$2.75
$3.00
$3.25
$3.50
2004 2005 2006 2007 2008F
FINANCIAL REVIEW
EARNINGS PER SHARE GROWTH
PROGRESSION OF ONGOING EPS (2004-2008F)
30% 25% 54% 58-63%
Note: EPS figures reflect the stock split effective July 28, 2006
2008F ONGOING EPS GUIDANCE:
58-63% GROWTH
CASH FLOW PROJECTIONS
2007-2008F
Guidance previously
set as $2.70 to $2.80
per share
Earnings Growth of 58 to 63 Percent and Increased
Cash from Operations Reflect Strong Growth Drivers
($1,402)
($509)
$2,450
$1,854
($200)
($950)
($2,000)
($1,500)
($1,000)
($500)
$0
$500
$1,000
$1,500
$2,000
$2,500
$3,000
10
2007 2008F
Cash Flows from Operations
Capital Expenditures
Cash Used in Investing,
Excluding Capital Expenditures

11

On Track to Double Gross Profit From 2007 to 2012, Growth
Drivers Roll Out In Balanced, Additive Progression
OVERVIEW
GROSS PROFIT DRIVERS:
TIMELINE OF INCREMENTAL IMPACT
2008 2009 2010 2011 2012
U.S. Corn
International Corn
Soybean
2009
Roundup Ready 2
Yield soybeans
controlled
commercial release
Cotton
2010
U.S. SmartStax
corn launch
Large-scale
Roundup Ready 2
Yield soybean
launch
MILESTONES
Seminis
R&D Pipeline
• Trait penetration and seed share growth
• SmartStax platformDRIVERS:
• Seed share growth
• New trait approvals in LADRIVERS:
• Roundup Ready 2 Yield platform
• Seed share growth
DRIVERS:
• 2nd
-gen trait acceleration
• Breeding inroads
DRIVERS:
• Protected culture
• Molecular markers
DRIVERS:
• Yield & stress platform
• Breakthrough platforms
DRIVERS:
Planned progression of significant new
gross-profit generation from each
strategic driver
2008 to 2012 Projected branded corn share gains globally
2012+
U.S. drought-
tolerant corn launch
2011-2012
Delta and Pine
Land U.S.
portfolio
converted to
second-
generation stack
2012+
Stacked trait
soybean launches,
including dedicated
product for Brazil
First major selling
season for LA corn
traits
11

12

U.S. CORN
DEKALB AND ASI U.S. CORN SHARE EVOLUTION:
2001-2008F
U.S. Corn
GEOGRAPHY: U.S.
OBJECTIVE: Grow footprint
2008 STATUS
• DEKALB brand expected to
gain 2- 3 points in 2008 for
total share of 25-to-26
percent in U.S.
• ASI expected to gain 1-to-2
share points organically in
2008 season
2012 OUTLOOK
• DEKALB to grow share
through 2012 by up to 10
points cumulatively from
2007 share of 23 percent
• Continued organic share
growth in ASI
10%
12%
13%
14%
16%
20%
23%
9%
5%
4%
0%
5%
10%
15%
20%
25%
30%
2001 2002 2003 2004 2005 2006 2007 2008F
25 - 26%
10 - 11%
12
DEKALB Brand Share – U.S.
DEKALB and ASI Share Growth Ahead of Original Plan –
2008 Milestones Reinforce Acceleration
ASI Share – U.S.

13

Monsanto Expected to Gain Corn Share in Argentina and Hold
Share in Brazil; Retaining Leadership in Both Markets
INTERNATIONAL CORN
International Corn
GEOGRAPHY:
Argentina &
Brazil
OBJECTIVE:
Expand
international
footprint
2008 STATUS
• Expected to grow 5 share
points in a market that is
25 percent larger than in
2007 in Argentina
• DEKALB and Agroeste
combined are forecasted
to be flat with 2007 in
Brazil, delivering on our
goal to stabilize share
2012 OUTLOOK
• Target 1-to-2 share points
of growth annually
through 2012
LATIN AMERICA: SEED FOOTPRINT
$29/ac
45%
10M1
2008F
(07/08 SEASON)
$29/ac
40%
23M
2007
(06/07 SEASON)
BRAZILARGENTINA
$34/ac$23/ac
AVG. RETAIL
PRICE FOR
DEKALB HYBRID
CORN SEED
40%40%MONSANTO
SHARE
27M8M1
HYBRID MARKET
SIZE
2008F
(07/08 SEASON)
2007
(06/07 SEASON)
1. Source: KLEFFMANN Marketing Services 13

14

14
U.S. CORN
2008 Triple Penetration Ahead of Expectations – Reinforcing
Continued Opportunity and Setting Stage for SmartStax
U.S.TRAITACRES
(INMILLIONS)
0
20
40
60
80
100
120
140
160
180
200
220
2005 2006 2007 2008 2010F
0
10
20
30
40
50
60
U.S.TRIPLE-STACKACRES
(INMILLIONS)
U.S. CORN TRAIT OPPORTUNITY: 2005-2010F
Trait acres reflect the total acres planted with each individual trait. In the case of stacked traits, each absolute
acre will be reflected by two or more trait acres.
2008F 2010
Opportunity
2007 ORIGINAL
OUTLOOK
Q2
UPDATE
20.8M 27-29M
40-42M
65-67M
26-28M
42.4M
57.9M
17.6M
45-55M
60-70M
80M
45-55MTriple Stack 25-27M
Rootworm Control 26-28M
Corn Borer Control 40-42M
63-65MGlyphosate Tolerance

15

INTERNATIONAL CORN
International Corn
GEOGRAPHY:
Argentina &
Brazil
OBJECTIVE: Trait Penetration
2008 STATUS
• Roundup Ready Corn 2
with YieldGard Corn Borer
stack received regulatory
approval in Argentina end
of August 2007
• YieldGard Corn Borer
received regulatory
approval in Brazil from
CTNBio and CNBS
• Hybrid registrations just
received, opening door for
seed production
2012 OUTLOOK
• Increasing trait penetration
sets the stage for
SmartStax introduction 5M5MROOTWORM
CONTROL
15-20M9MGLYPHOSATE
TOLERANCE
15-20M7MCORN BORER
CONTROL
On par with U.S.On par with U.S.
TRAIT RETAIL
PRICING
LATIN AMERICA: TRAIT OPPORTUNITY
Seed production
underway for 1-2M
commercial acres of
YieldGard corn
Granted first corn trait
approval in February
• YieldGard Corn Borer
BRAZILARGENTINA
30-40% of DEKALB seed
will be double-stack
2009 OUTLOOK
Granted approval for
stack in August 2007
RECENT
DEVELOPMENTS
• YieldGard Corn Borer
• Roundup Ready Corn 2
• YieldGard Corn Borer +
Roundup Ready Corn 2
Stack
APPROVED
TRAITS
With Two Recent Approvals, New Growth Opportunity Exists
For Corn Traits in Latin America
2010TRAIT
OPPORTUNITIES
15

16

Roundup Ready 2 Yield on Track for 2009 Controlled
Commercial Release of One to Two Million Acres
SOYBEANS
ROUNDUP READY 2 YIELD SOYBEANS:
LAUNCH PLANSSoybeans
GEOGRAPHY: U.S.
OBJECTIVE:
2nd-Gen
Launch
2008 STATUS
• Consistent 7-to-11
percent yield advantage
with Roundup Ready 2
Yield versus Roundup
Ready
• U.S., Canadian and
Japanese approvals
received; awaiting key
export approvals from
China, Mexico and Europe
PRICING
• Yield improvement shared
with grower using a multi-
year soybean commodity
price
Branded and licensed seed production
U.S. Full-Scale
Launch Target:
5- 6M Acres
Grower level marketing, awareness and trial
Licensee breeding
U.S. Controlled
Commercial
Release Target:
1- 2M Acres
2010200920082007
Pursuit of export approvals in China, Europe and
Mexico – JAPAN RECEIVED
Industry coordination and communications
• American Soybean Association and key agri-food
stakeholders
P R O J E C T
16

17

Reconciliation of Non-GAAP Financial Measures
Reconciliation of Free Cash Flow Fiscal Year
2008
Forecast
Fiscal Year
2007
6 Months Ended
Feb. 29, 2008
6 Months Ended
Feb. 28, 2007
$1,877 $520
(230)
290
(200)
15
$105
(404)
$1,473
(142)
88
$1,419
$2,450
(1,150)
$1,300
N/A
Effect of Exchange Rate Changes on Cash and Cash Equivalents N/A 46
N/A
Net Cash Provided (Required) by Operations $1,854
Net Cash Provided (Required) by Investing Activities (1,911)
Free Cash Flow ($57)
Net Cash Provided (Required) by Financing Activities (583)
Net Increase (Decrease) in Cash and Cash Equivalents ($594)
$ Millions
$ per share
Fiscal Year
2008F
Fiscal Year
2007
Fiscal Year
2006
Fiscal Year
2005
Fiscal Year
2004
Net Income (Loss) per Share $3.38 - $3.48
-
$3.38 - $3.48
Solutia Claim Settlement ($0.23)
--
--
--
--
--
--
--
$1.25
--
$3.15 - $3.25
Cumulative Effect of Change in Accounting Principle
$0.50$0.47$1.79
-
$1.79
--
--
--
--
$0.01
--
($0.13)
--
--
$0.34
--
$0.47
$2.00
--
$0.38
$0.32
$(0.19)
$0.01
$0.05
Impairment of Goodwill -- -- $0.12
In-Process R & D Write-Off Related to the Delta & Pine Land
(D&PL) Acquisition
-- --
$0.50
--
$1.04
--
--
--
--
$0.18
--
$0.80
Tax Charge on Repatriated Earnings
Diluted Earnings (Loss) per Share Before Effect of
Accounting Change
$1.26
$0.04
Seminis In-Process R&D --
Solutia-Related Charge --
Tax Benefit on Loss from European Wheat and
Barley Business
--
Loss (Income) on Discontinued Operations1
--
Restructuring Charges -- Net --
Diluted Earnings (Loss) per Share from Ongoing Business $1.30
Reconciliation of Non-GAAP EPS
17
Note: EPS figures reflect the stock split effective July 28, 2006
1. The operating results of Stoneville and Nexgen have been conformed to discontinued operations for all relevant years presented.

More Related Content

Monsanto Q2 2008 Financial Results

  • 2. Forward-Looking Statements 2 Certain statements contained in this presentation are "forward-looking statements," such as statements concerning the company's anticipated financial results, current and future product performance, regulatory approvals, business and financial plans and other non-historical facts. These statements are based on current expectations and currently available information. However, since these statements are based on factors that involve risks and uncertainties, the company's actual performance and results may differ materially from those described or implied by such forward-looking statements. Factors that could cause or contribute to such differences include, among others: continued competition in seeds, traits and agricultural chemicals; the company's exposure to various contingencies, including those related to intellectual property protection, regulatory compliance and the speed with which approvals are received, and public acceptance of biotechnology products; the success of the company's research and development activities; the outcomes of major lawsuits; developments related to foreign currencies and economies; successful operation of recent acquisitions; fluctuations in commodity prices; compliance with regulations affecting our manufacturing; the accuracy of the company's estimates related to distribution inventory levels; the company's ability to fund its short-term financing needs and to obtain payment for the products that it sells; the effect of weather conditions, natural disasters and accidents on the agriculture business or the company's facilities; and other risks and factors detailed in the company's most recent reports on forms 10-Q and 10-K. Undue reliance should not be placed on these forward- looking statements, which are current only as of the date of this presentation. The company disclaims any current intention or obligation to update any forward-looking statements or any of the factors that may affect actual results. Trademarks Trademarks owned by Monsanto Company and its wholly-owned subsidiaries are italicized in this presentation. All other trademarks are the property of their respective owners. © 2008 Monsanto Company
  • 3. Non-GAAP Financial Information This presentation may use the non-GAAP financial measures of “free cash flow,” and earnings per share (EPS) on an ongoing basis. We define free cash flow as the total of cash flows from operating activities and investing activities. A non-GAAP EPS financial measure, which we refer to as on-going EPS, excludes certain after-tax items that we do not consider part of ongoing operations, which are identified in the reconciliation. ROC means net income (without the effect of certain items) exclusive of after-tax interest expenses, divided by the average of the beginning year and ending year net capital employed, as defined in the reconciliation. Our presentation of non- GAAP financial measures is intended to supplement investors’ understanding of our operating performance. These non-GAAP financial measures are not intended to replace net income (loss), cash flows, financial position, or comprehensive income (loss), as determined in accordance with accounting principles generally accepted in the United States. Furthermore, these non-GAAP financial measures may not be comparable to similar measures used by other companies. The non-GAAP financial measures used in this presentation are reconciled to the most directly comparable financial measures calculated and presented in accordance with GAAP, which can be found at the end of this presentation. 3
  • 4. Ongoing and As-Reported Earnings PERFORMANCE SUMMARY Second Quarter 2008 Second Quarter 2007 First Half 2008 First Half 2007 Diluted Earnings Per Share $2.02 $0.98 $2.48 $1.14 Loss (Income) From Discontinued Operations - $0.01 - $0.02 Diluted Earnings Per Share on an Ongoing Basis $1.79 $0.99 $2.25 $1.16 -($0.23) Solutia Claim Settlement ($0.23) - 4
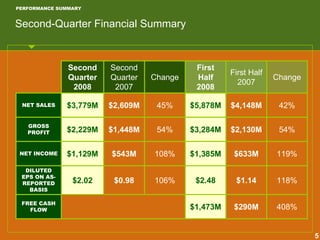
  • 5. Second Quarter 2008 Second Quarter 2007 Change First Half 2008 First Half 2007 $5,878M $4,148M $2,130M $633M $1.14 $290M $3,284M $1,385M $2.48 $1,473M 45% 54% 108% 106% Change NET SALES $3,779M $2,609M 42% 54% 119% DILUTED EPS ON AS- REPORTED BASIS $2.02 $0.98 118% FREE CASH FLOW 408% GROSS PROFIT $2,229M $1,448M NET INCOME $1,129M $543M PERFORMANCE SUMMARY Second-Quarter Financial Summary 5
  • 6. FINANCIAL OUTLOOK Monsanto’s Strategic and Financial Opportunity Lies in Seeds and Traits $0 $2,000 $4,000 $6,000 $8,000 $10,000 2007 2008F 2012F SEEDS & GENOMICS ROUNDUP AND OTHER GLYPHOSATE- BASED HERBICIDES ALL OTHER AGRICULTURAL PRODUCTIVITY INMILLIONS GROSS PROFIT OUTLOOK BY SEGMENT 2007-2012F SEEDS & GENOMICS CAGR FROM 2008 15-18% FLAT ROUNDUP AND ALL OTHER GLYPHOSATE- BASED HERBICIDES CAGR FROM 2008 Gross Profit 2008 STATUS • New FY2008 targets of $3.6 - $3.7B gross profit for Seeds and Genomics; $1.7 - $1.8B for Roundup and other glyphosate- based herbicides 2012 OUTLOOK 2012F $6.5-7.0B $1.8B $350M SEEDS & GENOMICS ROUNDUP AND OTHER GLYPHOSATE- BASED HERBICIDES ALL OTHER AG PRODUCTIVITY 6
  • 7. 7 2008 U.S. TRAIT PENETRATION – ALL CHANNELS 1.6 1.4 0.95 FINANCIAL OUTLOOK Monsanto Has Portfolio Balance That Carries Between Crops When Acres Switch Year-to-Year PORTFOLIO BALANCE: INDEXED GROSS PROFIT FOR MONSANTO-BRANDED CROP OFFERINGS 0.94 1.00 0.47 0 0.2 0.4 0.6 0.8 1 1.2 CORN COTTON SOYBEANS STATE OF AGRICULTURE: Portfolio Balance ► In 2008, for every 1 million acres that shift between soybeans and corn or cotton, on average, there is an estimated $0.01 EPS change for Monsanto ► With brands in corn, cotton and soybeans, Monsanto is positioned to meet demand regardless of crop planting patterns in any given year
  • 8. FINANCIAL OUTLOOK 8 Vegetable Seed Business On Track; De Ruiter Seeds Boosts Achievement of Identified Goals VALUE CREATION FOR VEGETABLE SEED PLATFORM: STAGED OPPORTUNITIES FOR INCREASING GROSS PROFIT Focus on operational excellence; working capital management VALUECREATIONOPPORTUNITY Assemble genetic maps for key crops Identify and implement opportunities to price products to value Aggressively shift mix via protected culture and hybrid conversion New product launches; use of molecular markers 2007 2008 2009 2010 2011 2012 2007 Monsanto vegetable seed sales top $600M in 2007; 7.5% top-line growth 2008 De Ruiter Seeds acquisition announced – strengthens protected- culture portfolio 2012 Monsanto vegetable seeds projected to be >$1B in sales, mid-60s margin 2012 Molecular marker platform begins transforming Seminis and De Ruiter portfolios ~2010 De Ruiter Seeds accretive to Monsanto vegetable seed EPS contribution in second full fiscal year following closing OPERATIONAL EXCELLENCE NEW VALUE CREATION PIPELINE ADVANCEMENT
  • 9. 2008 Again Projects Double-Digit Earnings Growth, Strong Cash Generation and Improved Margins FINANCIAL OUTLOOK 2007 2008F EARNINGS ONGOING EARNINGS PER SHARE $2.00 54% GROWTH FROM 2006 $3.15-$3.25 58-63% GROWTH FROM 2007 Gross Profit as a Percent of Sales 50% 53%; two years ahead of 2010 target of 52-54% Seeds & Traits Gross Profit $3.0B $3.6 - $3.7B Roundup and All Other Glyphosate-based Herbicides Gross Profit $854M $1.7 – $1.8B All Other Ag Productivity Gross Profit $418M ~$350M CASH MANAGEMENT AND SPENDING FREE CASH FLOW $(57)M ~$1.3B Capital Expenditures $509M ~$950M SG&A as a Percent of Sales 22% ~20% R&D as a Percent of Sales 9% ~9% Receivables as a Percent of Sales 18% High Teens Inventories as a Percent of Sales 20% High Teens 9
  • 10. $1.30 $0.80 $1.04 $2.00 $3.15-$3.25 $0.50 $0.75 $1.00 $1.25 $1.50 $1.75 $2.00 $2.25 $2.50 $2.75 $3.00 $3.25 $3.50 2004 2005 2006 2007 2008F FINANCIAL REVIEW EARNINGS PER SHARE GROWTH PROGRESSION OF ONGOING EPS (2004-2008F) 30% 25% 54% 58-63% Note: EPS figures reflect the stock split effective July 28, 2006 2008F ONGOING EPS GUIDANCE: 58-63% GROWTH CASH FLOW PROJECTIONS 2007-2008F Guidance previously set as $2.70 to $2.80 per share Earnings Growth of 58 to 63 Percent and Increased Cash from Operations Reflect Strong Growth Drivers ($1,402) ($509) $2,450 $1,854 ($200) ($950) ($2,000) ($1,500) ($1,000) ($500) $0 $500 $1,000 $1,500 $2,000 $2,500 $3,000 10 2007 2008F Cash Flows from Operations Capital Expenditures Cash Used in Investing, Excluding Capital Expenditures
  • 11. On Track to Double Gross Profit From 2007 to 2012, Growth Drivers Roll Out In Balanced, Additive Progression OVERVIEW GROSS PROFIT DRIVERS: TIMELINE OF INCREMENTAL IMPACT 2008 2009 2010 2011 2012 U.S. Corn International Corn Soybean 2009 Roundup Ready 2 Yield soybeans controlled commercial release Cotton 2010 U.S. SmartStax corn launch Large-scale Roundup Ready 2 Yield soybean launch MILESTONES Seminis R&D Pipeline • Trait penetration and seed share growth • SmartStax platformDRIVERS: • Seed share growth • New trait approvals in LADRIVERS: • Roundup Ready 2 Yield platform • Seed share growth DRIVERS: • 2nd -gen trait acceleration • Breeding inroads DRIVERS: • Protected culture • Molecular markers DRIVERS: • Yield & stress platform • Breakthrough platforms DRIVERS: Planned progression of significant new gross-profit generation from each strategic driver 2008 to 2012 Projected branded corn share gains globally 2012+ U.S. drought- tolerant corn launch 2011-2012 Delta and Pine Land U.S. portfolio converted to second- generation stack 2012+ Stacked trait soybean launches, including dedicated product for Brazil First major selling season for LA corn traits 11
  • 12. U.S. CORN DEKALB AND ASI U.S. CORN SHARE EVOLUTION: 2001-2008F U.S. Corn GEOGRAPHY: U.S. OBJECTIVE: Grow footprint 2008 STATUS • DEKALB brand expected to gain 2- 3 points in 2008 for total share of 25-to-26 percent in U.S. • ASI expected to gain 1-to-2 share points organically in 2008 season 2012 OUTLOOK • DEKALB to grow share through 2012 by up to 10 points cumulatively from 2007 share of 23 percent • Continued organic share growth in ASI 10% 12% 13% 14% 16% 20% 23% 9% 5% 4% 0% 5% 10% 15% 20% 25% 30% 2001 2002 2003 2004 2005 2006 2007 2008F 25 - 26% 10 - 11% 12 DEKALB Brand Share – U.S. DEKALB and ASI Share Growth Ahead of Original Plan – 2008 Milestones Reinforce Acceleration ASI Share – U.S.
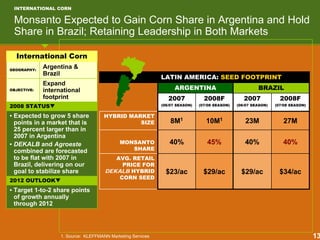
  • 13. Monsanto Expected to Gain Corn Share in Argentina and Hold Share in Brazil; Retaining Leadership in Both Markets INTERNATIONAL CORN International Corn GEOGRAPHY: Argentina & Brazil OBJECTIVE: Expand international footprint 2008 STATUS • Expected to grow 5 share points in a market that is 25 percent larger than in 2007 in Argentina • DEKALB and Agroeste combined are forecasted to be flat with 2007 in Brazil, delivering on our goal to stabilize share 2012 OUTLOOK • Target 1-to-2 share points of growth annually through 2012 LATIN AMERICA: SEED FOOTPRINT $29/ac 45% 10M1 2008F (07/08 SEASON) $29/ac 40% 23M 2007 (06/07 SEASON) BRAZILARGENTINA $34/ac$23/ac AVG. RETAIL PRICE FOR DEKALB HYBRID CORN SEED 40%40%MONSANTO SHARE 27M8M1 HYBRID MARKET SIZE 2008F (07/08 SEASON) 2007 (06/07 SEASON) 1. Source: KLEFFMANN Marketing Services 13
  • 14. 14 U.S. CORN 2008 Triple Penetration Ahead of Expectations – Reinforcing Continued Opportunity and Setting Stage for SmartStax U.S.TRAITACRES (INMILLIONS) 0 20 40 60 80 100 120 140 160 180 200 220 2005 2006 2007 2008 2010F 0 10 20 30 40 50 60 U.S.TRIPLE-STACKACRES (INMILLIONS) U.S. CORN TRAIT OPPORTUNITY: 2005-2010F Trait acres reflect the total acres planted with each individual trait. In the case of stacked traits, each absolute acre will be reflected by two or more trait acres. 2008F 2010 Opportunity 2007 ORIGINAL OUTLOOK Q2 UPDATE 20.8M 27-29M 40-42M 65-67M 26-28M 42.4M 57.9M 17.6M 45-55M 60-70M 80M 45-55MTriple Stack 25-27M Rootworm Control 26-28M Corn Borer Control 40-42M 63-65MGlyphosate Tolerance
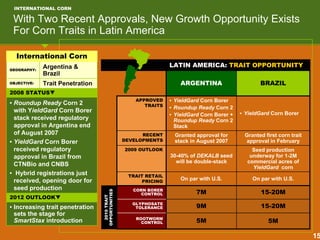
  • 15. INTERNATIONAL CORN International Corn GEOGRAPHY: Argentina & Brazil OBJECTIVE: Trait Penetration 2008 STATUS • Roundup Ready Corn 2 with YieldGard Corn Borer stack received regulatory approval in Argentina end of August 2007 • YieldGard Corn Borer received regulatory approval in Brazil from CTNBio and CNBS • Hybrid registrations just received, opening door for seed production 2012 OUTLOOK • Increasing trait penetration sets the stage for SmartStax introduction 5M5MROOTWORM CONTROL 15-20M9MGLYPHOSATE TOLERANCE 15-20M7MCORN BORER CONTROL On par with U.S.On par with U.S. TRAIT RETAIL PRICING LATIN AMERICA: TRAIT OPPORTUNITY Seed production underway for 1-2M commercial acres of YieldGard corn Granted first corn trait approval in February • YieldGard Corn Borer BRAZILARGENTINA 30-40% of DEKALB seed will be double-stack 2009 OUTLOOK Granted approval for stack in August 2007 RECENT DEVELOPMENTS • YieldGard Corn Borer • Roundup Ready Corn 2 • YieldGard Corn Borer + Roundup Ready Corn 2 Stack APPROVED TRAITS With Two Recent Approvals, New Growth Opportunity Exists For Corn Traits in Latin America 2010TRAIT OPPORTUNITIES 15
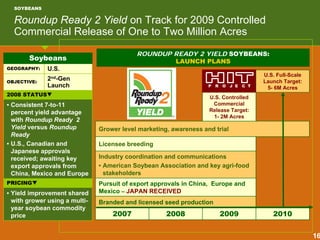
  • 16. Roundup Ready 2 Yield on Track for 2009 Controlled Commercial Release of One to Two Million Acres SOYBEANS ROUNDUP READY 2 YIELD SOYBEANS: LAUNCH PLANSSoybeans GEOGRAPHY: U.S. OBJECTIVE: 2nd-Gen Launch 2008 STATUS • Consistent 7-to-11 percent yield advantage with Roundup Ready 2 Yield versus Roundup Ready • U.S., Canadian and Japanese approvals received; awaiting key export approvals from China, Mexico and Europe PRICING • Yield improvement shared with grower using a multi- year soybean commodity price Branded and licensed seed production U.S. Full-Scale Launch Target: 5- 6M Acres Grower level marketing, awareness and trial Licensee breeding U.S. Controlled Commercial Release Target: 1- 2M Acres 2010200920082007 Pursuit of export approvals in China, Europe and Mexico – JAPAN RECEIVED Industry coordination and communications • American Soybean Association and key agri-food stakeholders P R O J E C T 16
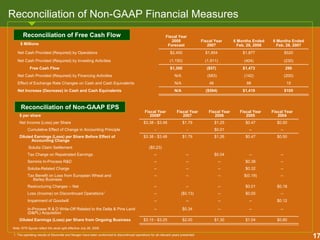
  • 17. Reconciliation of Non-GAAP Financial Measures Reconciliation of Free Cash Flow Fiscal Year 2008 Forecast Fiscal Year 2007 6 Months Ended Feb. 29, 2008 6 Months Ended Feb. 28, 2007 $1,877 $520 (230) 290 (200) 15 $105 (404) $1,473 (142) 88 $1,419 $2,450 (1,150) $1,300 N/A Effect of Exchange Rate Changes on Cash and Cash Equivalents N/A 46 N/A Net Cash Provided (Required) by Operations $1,854 Net Cash Provided (Required) by Investing Activities (1,911) Free Cash Flow ($57) Net Cash Provided (Required) by Financing Activities (583) Net Increase (Decrease) in Cash and Cash Equivalents ($594) $ Millions $ per share Fiscal Year 2008F Fiscal Year 2007 Fiscal Year 2006 Fiscal Year 2005 Fiscal Year 2004 Net Income (Loss) per Share $3.38 - $3.48 - $3.38 - $3.48 Solutia Claim Settlement ($0.23) -- -- -- -- -- -- -- $1.25 -- $3.15 - $3.25 Cumulative Effect of Change in Accounting Principle $0.50$0.47$1.79 - $1.79 -- -- -- -- $0.01 -- ($0.13) -- -- $0.34 -- $0.47 $2.00 -- $0.38 $0.32 $(0.19) $0.01 $0.05 Impairment of Goodwill -- -- $0.12 In-Process R & D Write-Off Related to the Delta & Pine Land (D&PL) Acquisition -- -- $0.50 -- $1.04 -- -- -- -- $0.18 -- $0.80 Tax Charge on Repatriated Earnings Diluted Earnings (Loss) per Share Before Effect of Accounting Change $1.26 $0.04 Seminis In-Process R&D -- Solutia-Related Charge -- Tax Benefit on Loss from European Wheat and Barley Business -- Loss (Income) on Discontinued Operations1 -- Restructuring Charges -- Net -- Diluted Earnings (Loss) per Share from Ongoing Business $1.30 Reconciliation of Non-GAAP EPS 17 Note: EPS figures reflect the stock split effective July 28, 2006 1. The operating results of Stoneville and Nexgen have been conformed to discontinued operations for all relevant years presented.