Motion Notes PPT STUDENT KEY.pdf
•
0 likes•73 views
The document discusses key concepts related to motion including distance, displacement, speed, velocity, acceleration, and free fall. It defines these terms and provides examples to illustrate them. For instance, it explains that displacement refers to how far an object is from its starting point, while distance describes the total length traveled. It also discusses that acceleration can change in different ways such as increasing or decreasing speed, changing direction, or altering both speed and direction simultaneously. Free fall acceleration on Earth is specified as 9.8 m/s2 due to gravity.
Report
Share


Motion Notes PPT STUDENT KEY.pdf
- 2. DO NOW: Motion is described with respect to a: a.Graph b.Displacement c.Slope d.Frame of reference Pg. 18
- 3. Why is it necessary to choose a single reference point (frame of reference) when measuring motion? DO NOW: The motion appears to be different in different frames of reference. Pg. 18
- 4. Motion Motion – an object’s change in position relative to a reference point
- 5. You don't always need to see something move to know that motion has taken place. A reference point is needed to determine the position of an object. Motion and Position Motion occurs when an object changes its position relative to a reference point. The motion of an object depends on the reference point that is chosen.
- 6. Reference Point The Earth’s surface is used as a common reference point A moving object can be used as a reference point as well
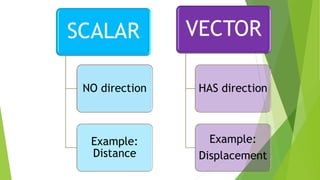
- 7. Definition: quantities that just have magnitude (strength) but NO direction. Examples: 1. Speed 60 mph 2. Mass 42 kg 3. Volume 33 mL 4. Density 6 g/mL 5. Temperature 32°C 6. Distance 100 m SCALAR QUANTITIES
- 8. Definition: quantities that have both magnitude (strength) and direction. Examples: 1. Velocity 60 mph East 2. Force 8 N south 3. Acceleration 3 m/s/s (m/s2) Left 4. Momentum16 Kg m/s Right 5. Electric Field 112 N/C East 6. Displacement 100 m, west VECTOR QUANTITIES
- 9. Check For Understanding #2 Quantity Scalar or Vector Quantity 5m 30 m/s East 5 mi. North 20 degrees Celsius 256 g 4000 calories 88 N south scalar vector vector scalar scalar scalar vector Pg 18
- 10. refers to how much ground an object has covered during its motion. An important part of describing the motion of an object is to describe how far it has moved, which is distance. DISTANCE
- 11. refers to “how far” an object is from its starting point. DISPLACEMENT
- 12. Displacement Displacement is how far you are from the starting point, as if you moved in a straight line. The displacement and distance traveled do not have to be the same.
- 13. The runner travels 50 m in the original direction (north) plus 30 m in the opposite direction (south), so the total distance she ran is 80 m. Suppose a runner jogs to the 50-m mark and then turns around and runs back to the 20-m mark.
- 14. Check for Understanding #3 A physics teacher walks 4 meters East, 2 meters South, 4 meters West, and finally 2 meters North. Teacher’s Distance: __________ Teacher’s Displacement: __________ 12m 0m Pg 18
- 15. The SI unit of length or distance is the meter (m). Longer distances are measured in kilometers (km). Shorter distances are measured in centimeters (cm). MEASURED IN:
- 16. Check for Understanding #4 What is the difference between distance and displacement? Pg 18
- 17. Answer Distance describes how far (total amount) an object moves. Displacement describes how far form the starting point an object ends up. Check for Understanding #4
- 18. COMBINING DISPLACEMENTS DISPLACEMENT ALONG A STRAIGHT LINE DISPLACEMENT THAT ISN’T A STRAIGHT LINE Same direction: ADD Opposite direction: SUBRACT
- 19. Vector Diagrams • 1 block East Vector A • 1 block North Vector B • 2 blocks East Vector C • 3 blocks north Vector D • 3 blocks west Vector E Calculate Distance = Displacement =
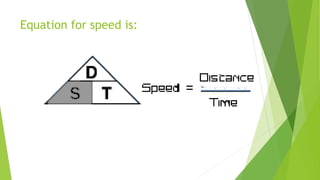
- 22. Equation for speed is:
- 23. Speed Example C4U #1 A plane travels 350 mph for north 6.5 hours. How far did it travel?
- 24. A plane travels 350 mph for 6.5 hours. How far did it travel? Given: S= 350 mph Work: T= 6.5 hrs D= (350 mph) x ( 6.5 hours) = Find: D Formula: D = S x T Speed Example C4U #1
- 29. Distance-Time Graphs C4U #2 1.Complete the graph by plotting the given data points on the graph. Each set of data points represents (time, distance). Data points: (0, 0), (2, 40), (4, 80), (6, 120), (8, 160), (10, 200) 2.Connect the plotted points with a straight line. 3. Describe the motion shown on the graph.
- 30. How are speed and velocity different?
- 31. Acceleration
- 32. Essential question: how are changes in Acceleration described? How can we define acceleration? The rate at which velocity changes
- 33. The basketball constantly changes velocity as it rises and falls. Describing changes in velocity, and how fast they occur, is a part of describing motion.
- 34. Changes in Speed In science, acceleration applies to any change in an object’s velocity. Acceleration can be caused by positive (increasing) change in speed or by negative (decreasing) change in speed. 3 ways to change acceleration:
- 35. Deceleration is an acceleration that slows an object’s speed. 3 ways to change acceleration:
- 36. Changes in Direction Acceleration can be the result of a change in direction at constant speed, for example, riding a bicycle around a curve. 3 ways to change acceleration:
- 37. Changes in Speed and Direction Sometimes motion is characterized by changes in both speed and direction at the same time. For example: Turning a corner. The car is accelerating both because it is changing direction and because its speed is decreasing. 3 ways to change acceleration:
- 39. Acceleration can change in different ways: 2. Slowing down 1. Speeding up 3. Changing direction 4. Both Speed and Direction
- 40. C4U #1: Identify the following as a change in speed, changing direction or both: 1. Taking off when the light changes from red to green 2. Riding on a carousel 3. A roller coaster
- 41. Acceleration changes by: A car moving after stopping at a red light is accelerating as it takes off. The acceleration is the result of an increase in speed. C4U #1:
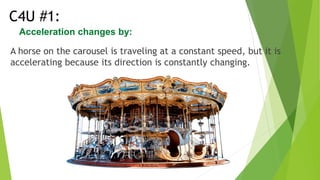
- 42. A horse on the carousel is traveling at a constant speed, but it is accelerating because its direction is constantly changing. C4U #1: Acceleration changes by:
- 43. A roller coaster produces acceleration due to changes in both speed and direction. C4U #1: Acceleration changes by:
- 44. C4U #2 Is acceleration a vector or scalar quantity? Vector
- 45. Constant Acceleration Constant acceleration is a steady change in velocity. Ex: An airplane’s acceleration may be constant during a portion of its takeoff. What Is Constant Acceleration?
- 46. Constant acceleration during takeoff results in changes to an aircraft’s velocity that is in a constant direction. What Is Constant Acceleration?
- 48. a = acceleration v= change in velocity Vf = final velocity Vi= initial velocity t = time = change ( final - initial
- 49. Formula How can you calculate acceleration? Acceleration is the rate at which velocity changes. Vi is the initial velocity, vf is the final velocity, and t is total time.
- 50. Units used:
- 51. Example 1: A car moving at 35 mph comes to a stop in 5 seconds. Find the acceleration of the car. (Hint – it is actually decelerating).
- 52. C4U #3 A car is traveling at 50 mph. The driver speeds up to 70 mph in 4 seconds. Find the car’s acceleration. (include units) a = Vf = Vi= t = Formula:
- 53. BrainPop BrainPop Video – Acceleration
- 54. C4U #4 Pg. 30 1. What is acceleration? a. the rate at which speed increases b. the time an object’s velocity increases c. the rate at which displacement changes d. the rate at which velocity changes D
- 55. A distance-time graph of accelerated motion is a curve. Ex: The data in this graph are for a ball dropped from rest toward the ground. Graphing Acceleration In a nonlinear graph, a curve connects the data points that are plotted.
- 56. Ex: The biker moves at a constant speed and then slows to a stop. Constant negative acceleration decreases speed. • On a speed-time graph of a bicycle slowing to a stop, a line sloping downward represents the bicycle decelerating. • The change in speed is negative, so the slope of the line is negative. Graphing Acceleration
- 57. Ex: The skier’s acceleration is positive. The acceleration is 4 m/s2. Speed-Time Graphs Constant acceleration is represented on a speed–time graph by a straight line. The slope of the line is the acceleration. The graph is an example of a linear graph, in which the displayed data form straight- line parts. Graphing Acceleration
- 59. The steeper the graph, the greater the acceleration. A horizontal line means the object is moving at a steady speed. A downward sloping line means the object is slowing down. A speed- time graph shows us how the speed of a moving object changes with time.
- 60. Instantaneous Acceleration What is instantaneous acceleration? Instantaneous acceleration is how fast a velocity is changing at a specific instant.
- 61. the movement of an object toward Earth solely because of gravity. What Is Freefall? Free fall is Objects falling near Earth’s surface accelerate downward at a rate of 9.8 m/s2.
- 62. Each second an object is in free fall, its velocity increases downward by 9.8 meters per second. The change in the stone’s speed is 9.8 m/s2, the acceleration due to gravity. t = 0 s v = 0 m/s t = 1 s v = 9.8 m/s t = 2 s v = 19.6 m/s t = 3 s v = 29.4 m/s What Is Freefall?
- 63. ways to change your acceleration: 1. Increase your speed (gas pedal) (accelerate) 2. Slow down (brake) – decelerate (negative acceleration) 3. Change your direction (steering wheel) 4. Change in both speed and direction