Murphy Oil Corporation 2012 Annual Shareholders Presentation
- 1. Annual Meeting of Shareholders El Dorado, Arkansas May 9, 2012 M U R P H Y O I L C O R P O R AT I O N
- 2. A Growing Value Business David M. Wood President and Chief Executive Officer May 9, 2012 MURPHY OIL CORPORATION 2
- 3. Agenda External Environment Murphy Portfolio Upstream Downstream Conclusions MURPHY OIL CORPORATION 3
- 4. Growing Population Needs Energy World Population World Gross Domestic Product Millions Billions 2005 US $ 10,000 180,000 Annual Percentage Change 2010-2035 9,000 OECD: 0.42% Non-OECD: 0.91% 160,000 8,000 140,000 7,000 120,000 6,000 100,000 5,000 Growth: 4.6% 80,000 4,000 60,000 3,000 2,000 40,000 Growth: 2.3% 1,000 20,000 0 0 2010 2015 2020 2025 2030 2035 2010 2015 2020 2025 2030 2035 OECD Non-OECD OECD Non-OECD Source: EIA – International Energy Outlook 2011 MURPHY OIL CORPORATION 4
- 5. World Energy Use by Fuel Type Quadrillion btu 900 History Projection 800 Renewables 700 Nuclear 600 500 27% Coal 400 28% 300 Natural Gas 200 52% 55% 100 Liquids 0 1990 1995 2000 2005 2010 2015 2020 2025 2030 2035 Source: EIA – International Energy Outlook 2011 MURPHY OIL CORPORATION 5
- 6. Global Crude Oil Supply/Demand World Liquids Consumption World Liquids Production MMBOEPD Oil Price ($/bbl) MMBOEPD 120 240 120 100 200 100 80 160 80 Non-OPEC 60 120 60 40 80 40 OPEC 20 40 20 0 0 0 2010 2015 2020 2025 2030 2035 2010 2015 2020 2025 2030 2035 Transportation OECD China OPEC Non-OPEC India Other Non-OECD Oil Price Source: EIA – Annual Energy Outlook 2012 Early Release MURPHY OIL CORPORATION 6
- 7. Global LNG Outlook BCFPD Global LNG Supply/Demand BCFPD LNG Demand in Asia 60 60 50 50 Probable 40 40 Under Construction 30 30 S. Korea 20 20 Operational Capacity Japan 10 10 India China - - 2011 2013 2015 2017 2019 2021 2023 2025 2011 2013 2015 2017 2019 2021 2023 2025 Source: Wood Mackenzie MURPHY OIL CORPORATION 7
- 8. Historical Prices Global demand continues to drives oil prices Gas remains a regional game $/bbl US over-supplied with gas price de-linked to oil $/mmbtu 150 25.00 Brent Brent WTI 120 20.00 HH Asian LNG 90 WTI 15.00 60 10.00 Asian LNG 30 5.00 Henry Hub 0 - 2000 2001 2002 2003 2004 2005 2006 2007 2008 2009 2010 2011 2012 MURPHY OIL CORPORATION 8
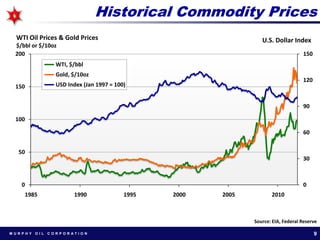
- 9. Historical Commodity Prices WTI Oil Prices & Gold Prices U.S. Dollar Index $/bbl or $/10oz 200 150 WTI, $/bbl Gold, $/10oz 120 150 USD Index (Jan 1997 = 100) 90 100 60 50 30 0 0 1985 1990 1995 2000 2005 2010 Source: EIA, Federal Reserve MURPHY OIL CORPORATION 9
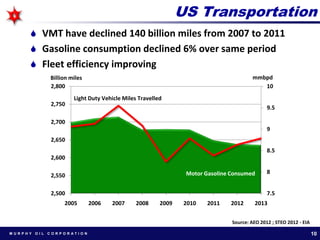
- 10. US Transportation VMT have declined 140 billion miles from 2007 to 2011 Gasoline consumption declined 6% over same period Fleet efficiency improving Billion miles mmbpd 2,800 10 Light Duty Vehicle Miles Travelled 2,750 9.5 2,700 9 2,650 8.5 2,600 Motor Gasoline Consumed 8 2,550 2,500 7.5 2005 2006 2007 2008 2009 2010 2011 2012 2013 Source: AEO 2012 ; STEO 2012 - EIA MURPHY OIL CORPORATION 10
- 11. US Retail Prices v. WTI $/barrel $/gallon 4.50 180 4.00 160 3.50 140 3.00 120 2.50 100 80 2.00 60 1.50 40 1.00 20 0.50 0 0.00 WTI US Retail Gasoline Sources: EIA MURPHY OIL CORPORATION 11
- 12. Global Retail Prices UK $/gal Gasoline Cost $3.71 Fuel Taxes $5.00 US $/gal Retail Price $8.71 China $/gal Gasoline Cost $3.29 Gasoline Cost $5.39 Fuel Taxes $0.50 Fuel Taxes $0.60 Retail Price $3.79 Retail Price $5.99 $/gal Gasoline Prices US v. China 8.00 China US 6.00 4.00 2.00 0.00 Sources: EIA, Reuters MURPHY OIL CORPORATION 12
- 13. Observations for 2012 What has not changed: Oil, Natural Gas and Coal – the key energy supplies OPEC role Non OECD demand key driver Climate debate US $ as world currency Europe What has changed: Global LNG N America gas US Energy Policy MURPHY OIL CORPORATION 13
- 14. UPSTREAM MURPHY OIL CORPORATION 14
- 15. Upstream Global Footprint Produce in 5 countries; explore in 10 countries Oil weighted production (73 %); exploration focus (75%) Value gas – sought Making the hard call on N Am dry gas – choke back Expansion in Malaysia gas 300 Capital 2012 – 2015 Production - MBOEPD 250 37% US Ongoing 200 Projects Canada 26% 150 New 100 Projects Base M’sia 50 17% - Exploration Oil & 2012 2013 2014 2015 20% Oil Indexed: 73% 77% 81% 80% MURPHY OIL CORPORATION 15
- 16. Oil Weighted Long Range Plan 300 260 250 250 193 200 200 Oil-Indexed SK Gas NA Dry Gas MBOEPD 150 80% Oil-Weighted 100 73% Oil-Weighted 50 Oil - 2012 2013 2014 2015 MURPHY OIL CORPORATION 16
- 17. Montney – Quality Gas Resource Facilities- On Time- On Budget R21 R20 R19 R18 R17 R16 R15 R14 R13 T79 First Quartile Well Costs British Columbia Alberta T78 Groundbirch Tupper West Opex = $ 0.65/MCF T77 DD&A = $2.50/MCF T76 Brassey Tupper T75 EUR = 4.0 BCF/ Well Murphy Acreage T74 – 156,000 Acres Sundown Total Resource = T73 0 Miles 6 1,700 - 3,500 Bcf X AECO Price MURPHY OIL CORPORATION 17
- 18. Eagle Ford – Premier Resource KARNES 216,000 Net Acres N TILDEN 60 % Oil 61 Producing Wells 10 Drilling Rigs 13 Facilities 2 Dedicated Frac Crews 42 MMBOE Booked TILDEN NUECES CATARINA Murphy Acreage Murphy Gas Well Oil Murphy Oil Well Oil Condensate 0 10 mi Drilled Gas MURPHY OIL CORPORATION 18
- 19. EFS Production 12 2012 Production Mix 11 Production 50 6% Net MBOEPD 10 40 30 13% 9 20 10 8 Net MBOEPD 0 7 2011 2012 2013 2014 2015 81% 6 5 Oil Associated Gas Dry Gas 4 3 2012 Guidance: 2 15,450 BOEPD 1 0 December Rate: 25,275 BOEPD MURPHY OIL CORPORATION 19
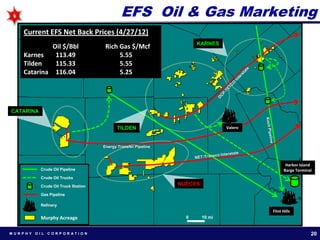
- 20. EFS Oil & Gas Marketing Current EFS Net Back Prices (4/27/12) KARNES Oil $/Bbl Rich Gas $/Mcf Karnes 113.49 5.55 Tilden 115.33 5.55 Catarina 116.04 5.25 CATARINA TILDEN Valero Energy Transfer Pipeline Harbor Island Crude Oil Pipeline Barge Terminal Crude Oil Trucks Crude Oil Truck Station NUECES Gas Pipeline Refinery Flint Hills Murphy Acreage 0 10 mi MURPHY OIL CORPORATION 20
- 21. Eagle Ford Summary $2.0 Billion Business, High Production – MBOEPD Returns 50 Other 40 EURs Increasing Catarina 30 D&C Costs Improving 20 Tilden 10 Moving from 10 to 12 Rigs Karnes - Early Days for Technology 2012 2013 2014 2015 Oil: 81% 86% 86% 86% 275 MMBOE Resource Significant Downspacing Potential MURPHY OIL CORPORATION 21
- 22. Canada Seal Lake Murphy 100% Lands Polymer Murphy 50% W.I. Lands Thermal 70 HZ Wells in 2012 Successful Strat Wells CSS Pilot VSD Pilot Increase Production by 20% CADOTTE NORTH to 8,500 BOPD Successful Polymer Pilot CLIFFDALE Successful 16 Well Strat EAST WEST CENTRAL Program SOUTH Cyclic Steam Pilot- Q4 2012 Vertical Steam Pilot – Q3 SOUTH 2013 HARMON MURPHY OIL CORPORATION 22
- 23. Well Pad Producer Seal Polymer Update Injector Injection Started Oct 2010 Response July 2011 600 Start of Polymer Injection Incremental Production - 500 400 Targeted range of response 380 BOPD from 4 Wells 300 200 Commercial Polymer 100 Project 0 Phase 1: Q2 2012 Mar-11 Apr-11 Mar-12 Sep-11 Jan-11 Feb-11 Jun-11 Jul-11 Aug-11 Jan-12 Feb-12 Oct-10 Nov-10 Dec-10 May-11 Oct-11 Nov-11 Dec-11 Phase 2: Q4 2012 Pilot Oil Production - BOPD MURPHY OIL CORPORATION 23
- 24. Seal Resources 5,850 STOIIP MMSTB Polymer / Thermal Type of Recovery Primary Polymer Thermal Total TBD 2,555 500-700 1,000-1300 1,295 – 1,795 5,850 Identified STOIIP MMSTB MMSTB MMSTB MMSTB MMSTB 200-300 45-75 190-370 50-450 485-1195 EUR Range MMSTB MMSTB MMSTB MMSTB MMSTB 210 45 110 365 YE11 Resource MMSTB MMSTB MMSTB MMSTB Reserve Group Focus- Resource Increased by 105% Current Proven Reserves: 20 MMBOE Focus on Polymer and Thermal EOR MURPHY OIL CORPORATION 24
- 25. Southern Alberta - New Play 150,000 Acres Low Entry Costs Testing Current Focus Kanai - 3 Forks 350 BOPD IP Cum Prod: 2012 Plan 24,000 BBLs Lower Costs Enhanced Fracs Longer Laterals MURPHY OIL CORPORATION 25
- 26. Muskwa - New Area Murphy Lands Murphy Well Targeting the Muskwa Competitor Well Shale Equivalent to Duvernay Fm Total Acres to Date: 168,000 Low Entry Cost Murphy 4-1-109 Well IP = 150 BOPD Put Well on Pump Evaluation 4 - 1 – 109 Well 0 Miles 6 MURPHY OIL CORPORATION 26
- 27. International and Offshore MURPHY OIL CORPORATION 27
- 28. International/Offshore – Pillar for Growth Production – MBOEPD 175 $1.7 Billion Spend Per 150 Other Year 125 GoM 100 Srwk Malaysia – Attractive for 75 Continued Investment 50 Sabah 25 - Back to Work in GOM 2012 2013 2014 2015 Oil & Oil Indexed: 89% 90 % 92% 90% Malaysia FLNG – Capital 2012 – 2015 Significant New Project 33% 40% Exploration New Projects Base 27% MURPHY OIL CORPORATION 28
- 29. Sarawak Oil Projects Moving Forward 30 Future Fields 25 Existing Utilizes Existing Infrastructure Net MBOPD 20 15 10 Progressing on 5 Schedule 0 2003 2006 2009 2012 2015 2018 2021 2024 2027 Sanctioned Oil Projects Resource Levels Net First Oil Status MMBOE Serendah & Patricia 25 Q2 2013 Construction and Drilling South Acis 23 Q3 2013 Construction Permas & Endau 12 Q4 2013 FEED Work MURPHY OIL CORPORATION 29
- 30. Long Term Oil Indexed Growth Malaysia FLNG Block H Gross Risked Resources: ~2,200 BCF 300 250 Discovered Drill Ready Prospects Leads Discovered 910 BCF 635 BCF 260 BCF 425 BCF 200 MMCFD 150 100 Murphy Net Entitlement = ~1,150 BCF 50 0 2016 2018 2020 2022 2024 2026 2028 2030 2032 2034 2036 2038 2040 De-Risked by Recent Exploration Success Sanction 2013 Award FEED Q3 2012 First Gas Planned 2016/17 MURPHY OIL CORPORATION 30
- 31. Dalmatian Development 3 Well Subsea Development to Petronius Dalmatian Gross, MBOEPD 55 MMBOE Recoverable Resource 20 15 40% Oil Mix 10 5 Robust Economics 0 2015 2017 2019 2021 2023 2025 2027 2029 Path Forward DOCD Approval June 2012 Project Sanction June 2012 Completions Mid 2013 First Oil Q1 2015 MURPHY OIL CORPORATION 31
- 32. Medusa Subsea Development Murphy 60% W.I. Existing Completions Exceeding Expectations 3 Well Subsea Development 16-27 MMBOE Recoverable Spud 1st Well Q2 2013 Net MBOEPD 1st Oil Q2 2015 18 16 14 12 10 8 6 4 2 0 2015 2016 2017 2018 2019 2020 2021 2022 2023 2024 2025 2026 2027 MURPHY OIL CORPORATION 32
- 33. 2012-13 Exploration Program Iraq 2-4 Wells GOM 2-4 Wells Malaysia 5-7 Wells Cameroon Brunei 1-2 Wells 2-5 Wells Congo 1-3 Wells Technically Grounded, Value Driven Indonesia 2 Wells Up to 30 Wells; Oil / LNG-Scale Gas Focus Australia Leveraging Operational Expertise – Partner of Choice 1-3 Wells Balance - Frontier & Lower Risk Proven Plays 5 Billion BOE Gross; 500 Million BOE Risked Net 2012- 2013 Portfolio MURPHY OIL CORPORATION 33
- 34. Exploration Program 2012 2013 Q1 Q2 Q3 Q4 Q1 Q2 Q3 Q4 Block H Buluh-1 MALAYSIA Block H/P Bunga Lili-1 Block H Block P Julong BRUNEI CA-1 East-1 Jagus East-1 CA-2 C. Dohuk & Linnava-1 Gali IRAQ Baranan Baranan-1 CAMEROON Ntem MPN CONGO MPN/MPS MPN MPS WA-423-P Eupheme-1 AUSTRALIA ACP/36 NTP/80 Bassett Deep INDONESIA Semai II Semai II Dalmatian GOM Multiple South Exact Timing Discovery Rig Contracted Wells Shown by Spud Date TBD MURPHY OIL CORPORATION 34
- 35. Reserves – Continue to Grow & Replace Total Proved – 534 MMBOE 65% Oil 65% North America Resource Play Deepwater 67% Developed 28% 27% 220% Replacement Conventional Syncrude 24% 17% 3.4 BBOE 3.3 BBOE 2.8 BBOE Heavy Oil Contingent (Unconventional) 4% Contingent (Conventional) Possible Probable Proved Reserves YE 2009 YE 2010 YE 2011 MURPHY OIL CORPORATION 35
- 36. Low Risk Non-Proved Resource Total Non-Proved – 2.9 BBOE 75% Oil Weighted Seal Syncrude 54% Low Risk – Existing EFS Oil 12% 11% Development Areas & Assoc Gas Msia Oil 11% 15% 38% NA Onshore Oil North America Msia Gas 10% Dry Gas Other Oil 25% 3.4 BBOE Projects 3.3 BBOE 16% 2.8 BBOE Contingent (Unconventional) Contingent (Conventional) Possible Probable Proved Reserves YE 2009 YE 2010 YE 2011 MURPHY OIL CORPORATION 36
- 37. DOWNSTREAM MURPHY OIL CORPORATION 37
- 38. Refining MURPHY OIL CORPORATION 38
- 39. Ethanol Plants HANKINSON, ND Running at 120+ mmgpy Rates Best-in-Class Production Increasing to 135+ mmgpy Co-product Development Advantaged by Corn Supply HEREFORD, TX Running at 104+ mmgpy Rates 115+ mmgpy Target in 2013 Full 12 Months Operations Advantaged by Local Demand MURPHY OIL CORPORATION 39
- 40. US Marketing MURPHY OIL CORPORATION 40
- 41. Murphy USA Overview Opened First Retail Store in 1996 Operating Sites 1,400 Operate 1,137 sites in 23 states 1,175* 1,200 998 Murphy USAs on Walmart Lots 139 Murphy Express Stores 1,000 Provide 3% of Total US Retail 800 Gasoline (5% in Mkt Area) 600 We serve ~1.6 Million Customers 400 Every Day 200 Historically Strong Growth Model 0 91% Fee-owned Real Estate 100% Company Operated *By End 2012 MURPHY OIL CORPORATION 41
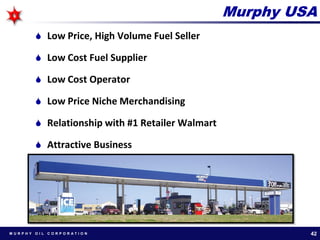
- 42. Murphy USA Low Price, High Volume Fuel Seller Low Cost Fuel Supplier Low Cost Operator Low Price Niche Merchandising Relationship with #1 Retailer Walmart Attractive Business MURPHY OIL CORPORATION 42
- 43. Murphy USA’s Model Crude Refineries/ Product Supply Oil Fields Marketing Secondary Pipeline/ Commodity & Primary Customer Vessel Terminal Distribution Markets Distribution / Trucking Wholesale MURPHY OIL CORPORATION Booz & Company March 2011 43
- 44. 2011 Gasoline Market Share 0% - 2% US Market Share ~3% 3% - 6% (5% Mkt Area) 7% - 14% TN OK MURPHY OIL CORPORATION Source: EIA, Internal Calculations 44
- 45. High Revenue Business $ Billion 18 16 14 12 10 8 6 4 2 0 Barnes & Nordstrom Starbucks Murphy USA Southwest Noble 2011 MURPHY OIL CORPORATION Source: Company Reports 45
- 46. Fuel Volume vs. Publicly-Traded Peers 2011 Fuel Sales/Store/Month (000 Gallons) 300 250 200 150 100 50 0 Murphy Casey's Delek Couche Pantry Susser Sunoco Valero Tesoro Marathon USA Tard MURPHY OIL CORPORATION Source: Company Reports 46
- 47. Low Operating Expenses 2011 Murphy USA vs. NACS Top Quartile Operating Expenses Per Store Month ($000) $60 $51.8 $50 $40 $30.2 $30 $26.7 $20 $12.6 $8.6 $8.5 $7.5 $10 $3.7 $3.6 $4.8 $2.0 $1.0 $1.0 $1.8 $0 Wages Maintenance Supplies Total Murphy USA NACs MURPHY OIL CORPORATION Source: NACs and Internal Data 47
- 48. 2011 Competitor Comps Operating statistics (LTM) # of Retail Locations 1,128 5,715 1,677 1,649 541 Fuel Volumes (MM Gallons) 3,715 3,672 1,416 1,889 768 Retail Fuel Volume/Store 3,333 894 858 1,157 1,430 (000 Gallons) Average Fuel Margin (¢/Gallon) 15.6¢ 15.9¢ 15.9¢ 17.5¢ 16.5¢ Merchandise Sales ($MM) $2,115 $6,343 $1,779 $1,779 $863 Merchandise Sales/Store/Week ($000) $36 $21 $20 $21 $31 EBITDA per Store ($000) $326 $131 $164 $133 $263 Total EBITDA $363 $747 $275 $275 $142 EBITDA Multiple (TEV/EBITDA) ?? 10.8x 8.9x 5.4x 5.5x Real Estate % Ownership 91% 30% 99% 26% 45% ROIC 13% 17% 10% 1% 6% Fuel 68% 26% 24% 30% 38% 74% 76% 70% Merchandise 32% 62% MURPHY OIL CORPORATION Source: Company Reports, Capital IQ 48
- 49. US Retail Merchandise Contribution Merchandise Sales Merchandise Margin Billion Per Year Million Per Year $2.2 $2.2 $300 $2.0 $270 $2.0 $259 $1.8 $1.8 $250 $1.6 $214 $1.3 $200 $1.4 $178 $1.2 $1.2 $152 $150 $1.0 $0.9 $120 $0.8 $100 $0.6 $0.4 $50 $0.2 $0.0 $0 2006 2007 2008 2009 2010 2011 2006 2007 2008 2009 2010 2011 2011 included nonrecurring adjustment of $(8.4)MM MURPHY OIL CORPORATION 49
- 50. Connecting with our Customers Murphy USA Mobile App Re-launched in March – Expecting 250,000+ Downloads This Year Provides Real-time Pricing and Location Information for Murphy USA & Competitors Innovative GPS Technology to Match to In-station Merchandise & Fuel Discounts MURPHY OIL CORPORATION 50
- 51. US Retail Financial Performance 2006-2011 Key Financial Indicators ($Millions) 2006 2007 2008 2009 2010 2011 Total Margin 454 511 812 535 707 849 Operating Expense 270 306 339 340 384 404 Admin and G&A 27 30 54 61 66 76 Total Operating Cost 297 336 393 401 450 480 Operating Income (Loss) 157 175 419 134 257 369 EBITDA 156 164 408 130 255 363 EBITDA per Site 0.17 0.17 0.41 0.13 0.24 0.33 After-tax Cash Flow 124 128 278 111 186 273 MURPHY OIL CORPORATION 51
- 52. Growth Avenues Walmart Cross Promotion & New Site Growth Opportunities with Third parties Growth Outside the Walmart Pad MURPHY OIL CORPORATION 52
- 53. Murphy Value Platform Global Upstream business Operator – organization skills and excellence Solid existing projects with new growth opportunities Exploration – 12 +/- wells per year program Oil weighting Repositioning in Downstream Sale of refineries US Retail Premium business – critical mass achieved Value created – more to come MURPHY OIL CORPORATION 53
- 54. Annual Meeting of Shareholders El Dorado, Arkansas May 9, 2012 M U R P H Y O I L C O R P O R AT I O N


