


Newgoldpresafton
- 1. 2010 Mine Tour New Afton Project Kamloops, British Columbia 1 September 22-23, 2010
- 2. Cautionary statement All monetary amounts in U.S. dollars unless otherwise stated CAUTIONARY NOTE REGARDING FORWARD-LOOKING STATEMENTS Certain information contained in this presentation, including any information relating to New Gold‟s future financial or operating performance may be deemed “forward looking”. All statements in this presentation, other than statements of historical fact, that address events or developments that New Gold expects to occur, are “forward-looking statements”. Forward-looking statements are statements that are not historical facts and are generally, but not always, identified by the words “expects”, “does not expect”, “plans”, “anticipates”, “does not anticipate”, “believes”, “intends”, “estimates”, “projects”, “potential”, ”scheduled”, “forecast”, “budget” and similar expressions, or that events or conditions “will”, “would”, “may”, “could”, “should” or “might” occur. All such forward looking statements are based on the opinions and estimates of management as of the date such statements are made and are subject to important risk factors and uncertainties, many of which are beyond New Gold‟s ability to control or predict. Forward-looking statements are necessarily based on estimates and assumptions that are inherently subject to known and unknown risks, uncertainties and other factors that may cause New Gold‟s actual results, level of activity, performance or achievements to be materially different from those expressed or implied by such forward-looking statements. Such factors include, without limitation: significant capital requirements; fluctuations in the international currency markets and in the rates of exchange of the currencies of Canada, the United States, Australia, Mexico and Chile; price volatility in the spot and forward markets for commodities; impact of any hedging activities, including margin limits and margin calls; discrepancies between actual and estimated production, between actual and estimated reserves and resources and between actual and estimated metallurgical recoveries; changes in national and local government legislation in Canada, the United States, Australia, Mexico and Chile or any other country in which New Gold currently or may in the future carry on business; taxation; controls, regulations and political or economic developments in the countries in which New Gold does or may carry on business; the speculative nature of mineral exploration and development, including the risks of obtaining and maintaining the validity and enforceability of the necessary licenses and permits and complying with the permitting requirements of each jurisdiction that New Gold operates, including, but not limited to, Mexico, where New Gold is involved with ongoing challenges relating to its environmental impact statement for Cerro San Pedro Mine; the lack of certainty with respect to the Mexican and other foreign legal systems, which may not be immune from the influence of political pressure, corruption or other factors that are inconsistent with the rule of law; the uncertainties inherent to current and future legal challenges the company is or may become a party to, including the third party claim related to the El Morro transaction with respect to New Gold's exercise of its right of first refusal on the El Morro copper-gold project in Chile and its partnership with Goldcorp Inc., which transaction and third party claim were announced by New Gold in January 2010; diminishing quantities or grades of reserves; competition; loss of key employees; additional funding requirements; actual results of current exploration or reclamation activities; changes in project parameters as plans continue to be refined; accidents; labour disputes; defective title to mineral claims or property or contests over claims to mineral properties. In addition, there are risks and hazards associated with the business of mineral exploration, development and mining, including environmental hazards, industrial accidents, unusual or unexpected formations, pressures, cave-ins, flooding and gold bullion losses (and the risk of inadequate insurance or inability to obtain insurance, to cover these risks) as well as “Risks Factors” included in New Gold‟s Annual Information Form filed on March 26, 2010 and Management Information Circular filed on April 8, 2010, both available at www.sedar.com. Forward-looking statements are not guarantees of future performance, and actual results and future events could materially differ from those anticipated in such statements. All of the forward-looking statements contained in this presentation are qualified by these cautionary statements. New Gold expressly disclaims any intention or obligation to update or revise any forward-looking statements, whether as a result of new information, events or otherwise, except in accordance with applicable securities laws. 2
- 3. Cautionary statement (cont‟d) CAUTIONARY NOTE TO U.S. READERS CONCERNING ESTIMATES OF MEASURED, INDICATED AND INFERRED RESOURCES Information concerning the properties and operations of New Gold has been prepared in accordance with Canadian standards under applicable Canadian securities laws, and may not be comparable to similar information for United States companies. The terms “Mineral Resource”, “Measured Mineral Resource”, “Indicated Mineral Resource” and “Inferred Mineral Resource” used in this presentation are Canadian mining terms as defined in accordance with NI 43-101 under guidelines set out in the Canadian Institute of Mining, Metallurgy and Petroleum (“CIM”) Standards on Mineral Resources and Mineral Reserves adopted by the CIM Council on December 11, 2005. While the terms “Mineral Resource”, “Measured Mineral Resource”, “Indicated Mineral Resource” and “Inferred Mineral Resource” are recognized and required by Canadian regulations, they are not defined terms under standards of the United States Securities and Exchange Commission. Under United States standards, mineralization may not be classified as a “reserve” unless the determination has been made that the mineralization could be economically and legally produced or extracted at the time the reserve calculation is made. As such, certain information contained in this presentation concerning descriptions of mineralization and resources under Canadian standards is not comparable to similar information made public by United States companies subject to the reporting and disclosure requirements of the United States Securities and Exchange Commission. An “Inferred Mineral Resource” has a great amount of uncertainty as to its existence and as to its economic and legal feasibility. It cannot be assumed that all or any part of an “Inferred Mineral Resource” will ever be upgraded to a higher category. Under Canadian rules, estimates of Inferred Mineral Resources may not form the basis of feasibility or other economic studies. Readers are cautioned not to assume that all or any part of Measured or Indicated Resources will ever be converted into Mineral Reserves. Readers are also cautioned not to assume that all or any part of an “Inferred Mineral Resource” exists, or is economically or legally mineable. In addition, the definitions of “Proven Mineral Reserves” and “Probable Mineral Reserves” under CIM standards differ in certain respects from the standards of the United States Securities and Exchange Commission. TOTAL CASH COST “Total cash cost” per ounce figures are calculated in accordance with a standard developed by The Gold Institute, which was a worldwide association of suppliers of gold and gold products and included leading North American gold producers. The Gold Institute ceased operations in 2002, but the standard is widely accepted as the standard of reporting cash cost of production in North America. Adoption of the standard is voluntary and the cost measures presented may not be comparable to other similarly titled measures of other companies. New Gold reports total cash cost on a sales basis. Total cash cost includes mine site operating costs such as mining, processing, administration, royalties and production taxes, but is exclusive of amortization, reclamation, capital and exploration costs. Total cash cost is reduced by any by-product revenue and is then divided by ounces sold to arrive at the total by-product cash cost of sales. The measure, along with sales, is considered to be a key indicator of a company‟s ability to generate operating earnings and cash flow from its mining operations. This data is furnished to provide additional information and is a non-GAAP measure. Total cash cost presented do not have a standardized meaning prescribed by GAAP and may not be comparable to similar measures presented by other mining companies. It should not be considered in isolation as a substitute for measures of performance prepared in accordance with GAAP and is not necessarily indicative of operating costs presented under GAAP. A reconciliation has been provided in the MD&A accompanying the audited annual financial statements and the unaudited quarterly financial statements. TECHNICAL INFORMATION The scientific and technical information in this presentation has been prepared under the supervision of Mark Petersen, a qualified person under National Instrument 43-101 and employee of New Gold. 3
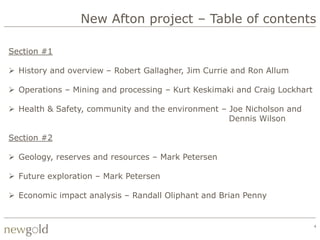
- 4. New Afton project – Table of contents Section #1 History and overview – Robert Gallagher, Jim Currie and Ron Allum Operations – Mining and processing – Kurt Keskimaki and Craig Lockhart Health & Safety, community and the environment – Joe Nicholson and Dennis Wilson Section #2 Geology, reserves and resources – Mark Petersen Future exploration – Mark Petersen Economic impact analysis – Randall Oliphant and Brian Penny 4
- 5. History and overview Historical Afton open pit 5
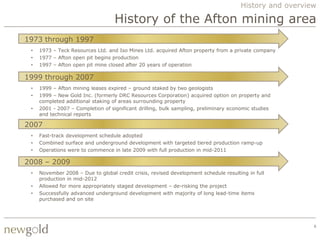
- 6. History and overview History of the Afton mining area 1973 through 1997 • 1973 – Teck Resources Ltd. and Iso Mines Ltd. acquired Afton property from a private company • 1977 – Afton open pit begins production • 1997 – Afton open pit mine closed after 20 years of operation 1999 through 2007 • 1999 – Afton mining leases expired – ground staked by two geologists • 1999 – New Gold Inc. (formerly DRC Resources Corporation) acquired option on property and completed additional staking of areas surrounding property • 2001 - 2007 – Completion of significant drilling, bulk sampling, preliminary economic studies and technical reports 2007 • Fast-track development schedule adopted • Combined surface and underground development with targeted tiered production ramp-up • Operations were to commence in late 2009 with full production in mid-2011 2008 – 2009 • November 2008 – Due to global credit crisis, revised development schedule resulting in full production in mid-2012 • Allowed for more appropriately staged development – de-risking the project • Successfully advanced underground development with majority of long lead-time items purchased and on site 6
- 7. History and overview Overview of New Afton project • Located 350 kilometres northeast of Vancouver, 10 kilometres west of Kamloops • Total area of interest – 111km2 • Proven and probable reserves – • Gold – 1.05 million ounces • Copper – 993 million pounds • Silver – 3.1 million ounces • Being developed as underground block cave mine • 11,000 tonne per day processing plant • $246 million capital spent, ~$388 million remaining • Average annual production – • Concentrate – 120,000 tonnes • Gold – 85,000 ounces • Copper – 75 million pounds • Co-product cash costs – consensus prices • Gold – $359 per ounce • Copper - $0.90 per pound • At today‟s gold and copper prices, potential for ~$200 million per year of cash flow New Afton core shacks 7
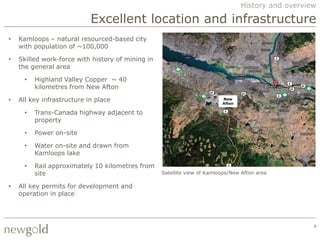
- 8. History and overview Excellent location and infrastructure • Kamloops – natural resourced-based city with population of ~100,000 • Skilled work-force with history of mining in the general area • Highland Valley Copper ~ 40 kilometres from New Afton • All key infrastructure in place New Afton • Trans-Canada highway adjacent to property • Power on-site • Water on-site and drawn from Kamloops lake • Rail approximately 10 kilometres from site Satellite view of Kamloops/New Afton area • All key permits for development and operation in place 8
- 9. History and overview Development through end of 2009 • Due to credit crisis in fall of 2008 – shifted from fast-tracked tiered production development plan to current schedule • De-risked both project cost and timeline • $219 million of capital spent through end of 2009 on surface infrastructure, equipment and underground development • Surface infrastructure: mine operations, mill and office buildings, tire and maintenance shops, tailing impoundment, mine dry, shotcrete plant, Fully enclosed mill building offices, water and power supply • Key long-lead time equipment purchased and in place: SAG and Ball mills, main transformer • Vertical mill and Flotation cells purchased • Continued to improve underground development advance • Shifted to owner-operator mining crews in first quarter of 2009 • ~10,000 metres of advance completed Inside New Afton mill building 9
- 10. History and overview Present – 2010 development plan • Total 2010 capital budget of $110 – 120 million (excluding capitalized interest) • $27 million spent through June 30, 2010 • Enhanced financial flexibility allowed for $50 million in capital to be moved from 2011/12 into 2010 including surface works and underground conveyor • Further de-risks project and targeted mid-2012 production start • Development work completed in first half of 2010 • 1,413 metres of development advance • Excavation of conveyor transfer stations • Installation of buried piping on surface • Focus in second half of 2010 • Complete development of the second and third conveyor transfer chambers • Break-thru the conveyor leg 4 drift • Start development of the extraction and undercut level in Block 2 • Establish a system of vent raises to provide fresh air directly to the extraction level and lowest workings of the mine 10
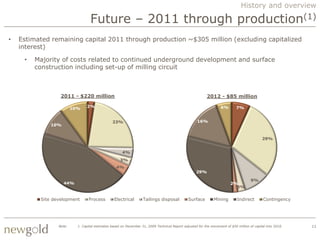
- 11. History and overview Future – 2011 through production(1) • Estimated remaining capital 2011 through production ~$305 million (excluding capitalized interest) • Majority of costs related to continued underground development and surface construction including set-up of milling circuit 2011 - $220 million 2012 - $85 million 2% 6% 7% 10% 23% 16% 10% 29% 4% 3% 4% 29% 9% 44% 2% 3% Site development Process Electrical Tailings disposal Surface Mining Indirect Contingency Note: 1. Capital estimates based on December 31, 2009 Technical Report adjusted for the movement of $50 million of capital into 2010. 11
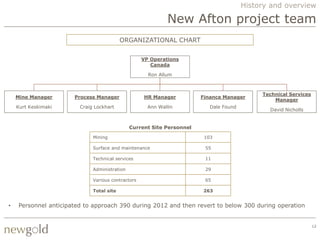
- 12. History and overview New Afton project team ORGANIZATIONAL CHART VP Operations Canada Ron Allum Technical Services Mine Manager Process Manager HR Manager Finance Manager Manager Kurt Keskimaki Craig Lockhart Ann Wallin Dale Found David Nicholls Current Site Personnel Mining 103 Surface and maintenance 55 Technical services 11 Administration 29 Various contractors 65 Total site 263 • Personnel anticipated to approach 390 during 2012 and then revert to below 300 during operation 12
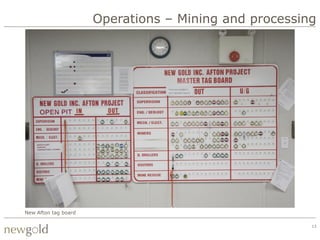
- 13. Operations – Mining and processing New Afton tag board 13
- 14. Operations – Mining and processing Overview • New Afton deposit being developed as block cave mining operation • To process 11,000 tonnes per day (4Mt per year) of copper-gold ore • Processed in flotation plant to recover gold and copper in concentrate • Concentrate to be shipped via truck or rail to Vancouver for transport to Asia • See detailed section on Concentrate marketing in Economic Impact Analysis section • Average annual production • Tonnes of concentrate ~120,000 • Gold ~85,000 ounces • Copper ~75 million pounds • 12-year mine life based on current reserve • Life of mine co-product total cash cost(1) • $359 per ounce of gold • $0.90 per pound of copper • Average annual sustaining capital – $14 million(2) Note: 1. See page 45 for detailed breakdown of cost calculation. 14 2. Based on C$0.90/US$ foreign exchange rate.
- 15. Operations – Mining and processing Block caving overview • Block caving will involve • Undercutting the ore body allowing the ore to collapse and fragment into underlying draw points • Ore extraction from draw points by 3m3 scoops, transfer to underground crusher by 10m3 scoops, then transferred to surface via conveyor system • New Afton has two primary blocks • B1 & B2 bottom at ~600m below surface • B3 bottom at ~720m below surface • Higher upfront capital than non-caving methods, but very low operating costs in comparison Simplified schematic of block caving 15
- 16. Operations – Mining and processing Block model B1 B2 B3 • Commence production from Block 2, followed by Blocks 1 and 3, respectively 16
- 17. Operations – Mining and processing Block cave mines around the world Pebble Cassiar Ekati New Afton Resolution Jeffrey Bingham Canyon San Manuel Henderson LEGEND Bell Oyu Tolgoi Questa Climax Past Producers Several Projects And Mines In China Producers Development Projects Didipio Santo Tomas II Grasberg Ok Tedi Nchanga Argyle Wafi King Shabani Debswana Mines Palabora Olympic Dam Northparkes E26 And Kimberley Mines Cullihan E48 Chuquicamata Mt Keith Finsch Salvador Koffiefontein Ridgeway Deeps And Andina Cadia East El Teniente Mines Mt Lyell 17
- 18. Operations – Mining and processing Revised layout B1 B2 B3 18
- 19. Operations – Mining and processing Schematic – Undercut and extraction level 19
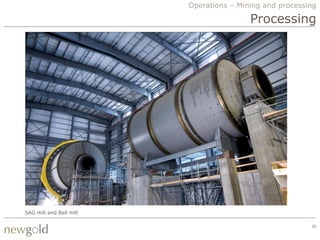
- 20. Operations – Mining and processing Processing SAG mill and Ball mill 20
- 21. Operations – Mining and processing Simplified processing flowsheet • Primary crushing underground to 150 mm then conveyed to surface stockpile for further processing 21
- 22. Operations – Mining and processing Mill building layout 22
- 23. Operations – Mining and processing Ore type, grade and recoveries • Mill will process Primary (Hypogene), Transition (Mesogene) and Supergene ores totaling 47.4 Mt • ~86% of ore is Hypogene • Design criteria for grinding circuit (SAG/Ball mill) based on Hypogene ores • Gold and copper grades anticipated to improve year-over-year in the first five to six years of production • Life-of-mine average grades: • Gold – 0.69 grams per tonne • Copper – 0.95% • Silver – 2.03 grams per tonne • Life-of-mine average metal recoveries(1): • Gold – 88.4% • Copper – 88.9% • Silver – 77.4% Note: 1. New Gold recovery estimates slightly above those in the December 31, 2009 Technical Report as the company expects to realize the benefit 23 of experience and process optimization after the initial start-up period. Additionally, New Gold has three recovery units whose contributions to total metal recovery are not accounted for in the laboratory equations, as they were added post-feasibility.
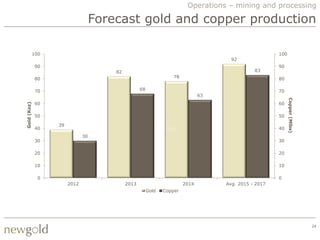
- 24. Operations – mining and processing Forecast gold and copper production 100 100 92 90 90 82 83 80 78 80 70 68 70 63 Copper (Mlbs) 60 60 Gold (Koz) 50 50 39 40 40 30 30 30 20 20 10 10 0 0 2012 2013 2014 Avg. 2015 - 2017 Gold Copper 24
- 25. Health & safety, community and the environment 25
- 26. Health & Safety, community and the environment Health and safety COMPLETED MILESTONES ONGOING DELIVERABLES Functioning joint employee/management safety committee Continue to work towards zero injuries Compliance in all aspects of the Health 7,000 metres of underground development without lost time injury Safety and Reclamation Code for BC mines Mine rescue team earned top award at provincial competition Gap analysis completed on safety & reclamation code for mines in British Columbia Awarded 2009 J T Ryan Special Award in recognition of notable achievement in safe mining All Injury Frequency Rate 2008 - June 2010(1) 24 21 18 15 12 9 6 3 0 Avg. 08 Avg. 09 Jan Feb Mar Apr May Jun All injury count AIFR 12 MMA Mine rescue team 26
- 27. Health & Safety, community and the environment Social Responsibility – First Nations • Signed a participation agreement with First Nations, two local bands in March 2008 • Highlights of the socioeconomic trust created for Bank members include: – C$250,000 payment into trust by New Gold – During years with commercial production, a minimum of C$250,000 shall be paid by New Gold (annually), increasing to C$500,000 if copper prices exceed C$2.50 a pound – After mine costs have been repaid to New Gold, payment to increase to C$1 million per year • Participation agreement consists of four main components: – Education and Scholarships – Preferential Employment/Contract opportunities – Financial • Employ a First Nations Coordinator to assist with implementation of agreement • Joint Implementation Committee meets regularly • Relationship is progressing well and is conducted on the basis of mutual respect and collaboration 27
- 28. Health & Safety, community and the environment Environment and sustainability KEY PERMITS/MILESTONES Mine permit obtained from the B.C Government Received Agreement with First Nations March 2008 Completed Topsoil stockpiled for future reclamation Completed Environmentally friendly reagents implemented Completed Artifact training Completed Noxious weed control Completed Mines act permit amendment – Tailings Storage Facility permit Received Effluent discharge permit and air emissions permit Received Water license permit received April 2010 Received 28
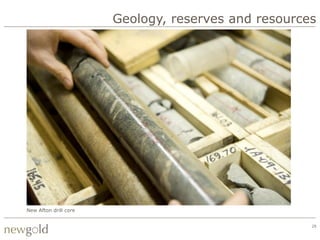
- 29. Geology, reserves and resources New Afton drill core 29
- 30. Geology, reserves and resources Geologic setting and mineralization • New Afton area underlain by rocks of Upper to Lower Paleozoic Quesnel Terrane • Immediate project area comprised of: • Late Triassic to early Jurassic Nicola group volcanic and sedimentary rocks • Alkalic to subalkalic intrusions of the Iron Mask batholith • New Afton deposit hosted within Cherry Creek member of Iron Mask batholith • Porphyry host rocks at New Afton include: • Fine to medium-grained pyroxene hornblende monzodiorite • Fine-grained biotite-monzonite • Copper-gold mineralization occurs primarily as finely disseminated chalcopyrite with lesser amounts of bornite and chalocite. • Gold occurs primarily within Chalcopyrite and Bornite and in other sulphide minerals 30
- 31. Geology, reserves and resources Drilling and resource delineation • Seven drill holes initially completed by Teck Resources into the deeper Afton underground in 1973 and 1980 • Delineation drilling by New Gold from 2000 through 2009 totals 130,439 metres in 276 diamond drill holes • Updated mineral resource and reserve estimates completed in December 2009(1): Tonnes Copper Gold Cu% Au g/t (Mt) (Mlbs) (Moz) 2P Reserves 47.4 0.95% 0.69 993 1.05 M&I Resources 65.0 1.07% 0.80 1,535 1.67 Inferred 25.2 0.66% 0.54 367 0.43 • Drilling in 2006 and 2007 also identified and delineated the C-Zone which lies below the current reserve block • A total of 14 holes have been drilled into the C- Zone to date • Further drilling planned once underground development is sufficiently advanced Underground at New Afton Note: 1. See page 34 of presentation for detailed Resource table. 31
- 32. Geology, reserves and resources New Afton geology New Afton Deposit Geology 32
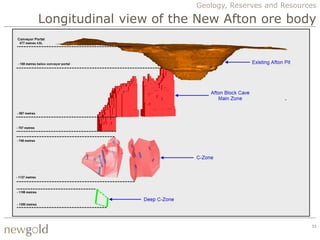
- 33. Geology, Reserves and Resources Longitudinal view of the New Afton ore body 33
- 34. Geology, reserves and resources Reserves and resources New Afton Mineral Reserves statement as at December 31, 2009 Metal grade Contained metal Tonnes Gold Silver Copper Gold Silver Copper 000’s g/t g/t % Koz Koz Mlbs Proven - - - - - - - Probable 47,400 0.69 2.03 0.95 1,052 3,094 993 Total P&P 47,400 0.69 2.03 0.95 1,052 3,094 993 Measured 35,100 0.91 2.80 1.26 1,027 3,160 975 Indicated 29,900 0.67 2.20 0.85 644 2,115 560 Total M&I 65,000 0.80 2.52 1.07 1,671 5,275 1,535 Inferred 25,200 0.54 1.70 0.66 438 1,377 367 Key Assumptions: • Mineral Reserves are contained within Measured and Indicated mineral Resources. Measured and Indicated mineral Resources that are not mineral Reserves do not have demonstrated economic viability. Inferred mineral Resources are not known with the same degree of certainty as Measured and Indicated Resources, do not have demonstrated economic viability, and are exclusive of mineral Reserves • Mineral Reserves for the company‟s mining operations and development projects have been calculated based on the following metal prices and lower cut-off criteria: Gold - $800/oz, Silver - $12.00/oz, Copper - $2.00/lb, cut-off - $19/t NSR • Mineral Resources for the company‟s mining operations and development projects have been calculated based on the following metal prices and lower cut-off criteria: Gold - $900/oz, Silver - $15/oz, Copper - $2.00/lb, cut-off – 0.4% CuEq all resources • Mineral Resources have been estimated and reported in accordance with the standards of the Canadian Institute of Mining, Metallurgy and Petroleum and National Instrument 43-101, or the AusIMM JORC equivalent • The following sets out the individuals who are the Qualified Persons as defined by Canadian National Instrument 43-101 in connection with this Mineral Reserve and Mineral Resource Statements as of December 31, 2009 – Reserves: Mr. Dennis Bergen, P.Eng. and Associate Principal Mining Engineer for Scott Wilson Roscoe Postle & Assoc. – Resources: Mr. David Rennie, P. Eng. and Principal Geologist for Scott Wilson Roscoe Postle Assoc. 34
- 35. Future exploration Land surrounding New Afton site 35
- 36. Future exploration New Gold mining tenure • Overview of mining tenure at New Afton and surrounding areas New Afton New Afton 36
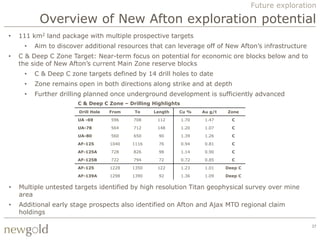
- 37. Future exploration Overview of New Afton exploration potential • 111 km2 land package with multiple prospective targets • Aim to discover additional resources that can leverage off of New Afton‟s infrastructure • C & Deep C Zone Target: Near-term focus on potential for economic ore blocks below and to the side of New Afton‟s current Main Zone reserve blocks • C & Deep C zone targets defined by 14 drill holes to date • Zone remains open in both directions along strike and at depth • Further drilling planned once underground development is sufficiently advanced C & Deep C Zone – Drilling Highlights Drill Hole From To Length Cu % Au g/t Zone UA -69 596 708 112 1.70 1.47 C UA-78 564 712 148 1.20 1.07 C UA-80 560 650 90 1.39 1.26 C AF-125 1040 1116 76 0.94 0.81 C AF-125A 728 826 98 1.14 0.90 C AF-125B 722 794 72 0.72 0.85 C AF-125 1228 1350 122 1.23 1.01 Deep C AF-139A 1298 1390 92 1.36 1.09 Deep C • Multiple untested targets identified by high resolution Titan geophysical survey over mine area • Additional early stage prospects also identified on Afton and Ajax MTO regional claim holdings 37
- 38. Future exploration Targeting the C-Zone C & Deep C-zones represent key drill targets once underground development sufficiently advanced Main Zone Reserve C-Zone Looking SW Looking NE 38
- 39. Future exploration Beyond the C-Zone Afton Pit Main Zone Base of Block Cave C & Deep C Zone Faulted Offset Extension? 39
- 40. Future exploration New Afton site geology Buried Offset Extension Target New Afton Site Geology 40
- 41. Future exploration New Afton regional setting Iron Mask District Geology 41
- 42. Economic impact analysis Overview of New Afton site 42
- 43. Economic impact analysis New Afton a potential „game changer‟ • Project is fully funded for development - $376 million cash at June 30, 2010 • Approximately 75% denominated in Canadian dollars to mitigate foreign exchange risk • With $246 million in capital already spent – go forward economics even more robust • Combination of strong production, low cost and limited sustaining capital result in significant free cash flow potential from New Afton • At today‟s commodity prices, New Afton alone has potential to generate over $200 million, or $0.50/share, in cash flow from operations for New Gold • Significant incremental cash flow generation allows for evaluation of other strategies to provide investor returns: • Re-invest in similarly compelling projects • Institute a dividend(1) • Special dividend(1) Note: 1. Subject to restrictions related to New Gold’s Senior Secured Notes. 43
- 44. Economic impact analysis Project development capital overview • Total estimated project capital remains Breakdown of Total Development Costs ($mm) on budget at $634 million (Excluding capitalized interest) Total capital expenditure through December 31, • On time for mid-2012 production 2009, before updated 43-101(1) $219 • Most recent capital cost update to Projected capital per 43-101 (January 1, 2010 forward) (2) 415 complete project of $415 million TOTAL ESTIMATED DEVELOPMENT CAPITAL $634 completed at end of 2009 • Includes $28 million(2) or 7% Breakdown of Remaining Development Costs ($mm) contingency (Excluding capitalized interest) • $388 million of capital expenditure Total estimated development capital $634 projected from mid-2010 through Capital expenditure through December 31, 2009(1) (219) production start Capital expenditure 2010 (through June 30, 2010)(3) (27) • Future projected capital(4) Total capital expenditures through June 30, 2010 (246) • Remaining 2010 – $80 – 90 million TOTAL REMAINING DEVELOPMENT CAPITAL $388 • 2011 – ~$220 million • 2012 – ~$85 million Note: 1. Per New Gold 2008 and 2009 Annual Reports. 2. Per December 31, 2009 New Afton 43-101 Technical Report. Capital estimate converted at a foreign exchange rate of C$0.90/US$. 44 3. Per New Gold Second Quarter 2010 Second Quarter Management Discussion and Analysis. 4. Based on C$0.90/US$ foreign exchange rate assumption.
- 45. Economic impact analysis Breakdown of operating costs Mining Costs Total Operating Costs LOM Average – C$7.35/tonne LOM Average – $15.54/tonne Processing Costs LOM Average – C$7.59/tonne Treatment charge ~$82/ dry concentrate tonne G&A Costs LOM Average – C$2.33/tonne Refining charges $0.08/ pound payable copper • Projected operating costs inclusive of all $6.00/ ounce payable gold TCRC‟s and First Nations Royalty $0.35/ ounce payable silver • Estimated transportation charge includes: • Truck and/or Rail Transportation charge • Port handling ~$120/wet concentrate tonne • Ocean freight • Insurance Royalty Varies based on Cu, Au prices 45
- 46. Economic impact analysis Co-product/by-product costs (spot prices)(1) Average annual operating cost $100 million Co-product By-product • Copper revenue ~$260m • Copper revenue ~$260m • 76Mlbs at $3.40/lb • 76Mlbs at $3.40/lb • Gold revenue ~$110m • Gold revenue ~$110m • 88koz at $1,250/oz • 88koz at $1,250/oz • Revenue split 70/30 – Cu/Au • Deduct Au/Cu revenue from • Split cost on same total cost percentage • Co-product copper cost – • By-product copper cost – $0.92/lb ($0.13)/lb • Co-product gold cost – • By-product gold cost – $341/oz ($1,820)/oz Note: 1. Calculation based on period 2013 through 2017 representing first five years of full production from the New Afton mine. 46
- 47. Economic impact analysis Co-product/by-product costs (consensus prices)(1) Average annual operating cost $100 million Co-product By-product • Copper revenue ~$170m • Copper revenue ~$170m • 76Mlbs at $2.25/lb • 76Mlbs at $2.25/lb • Gold revenue ~$80m • Gold revenue ~$80m • 88koz at $900/oz • 88koz at $900/oz • Revenue split ~70/30 – • Deduct Au/Cu revenue from Cu/Au total cost • Split cost on same percentage • Co-product copper cost – • By-product copper cost – $0.90/lb $0.28/lb • Co-product gold cost – • By-product gold cost – $359/oz ($824)/oz Note: 1. Calculation based on period 2013 through 2017 representing first five years of full production from the New Afton mine. 47
- 48. Economic impact analysis Concentrate marketing Strategy • We have focused on – Mid to long term contracts, due to the more complex nature of the concentrate – Counterparties with strong reputations, longevity, solid financial backing and ability to offer attractive terms • Engaged an adviser with over 20 years of experience in the concentrate business Concentrate Marketing Transportation & Logistics • The market has been very receptive to • From mine to Vancouver wharves the New Afton concentrate during – Reviewing proposals from truck and 2009/10 rail service providers • Approached interested parties in late – Vancouver wharves will have 17- 2009 20,000t of storage on site – Traders • From Vancouver to final destination – Smelters – Engaged in dialogue with shipping • Bid process completed during Q2 2010 agents and brokers – 1 trader – 40% offtake – Trader material likely to go to China in – 2 smelters (Asia) – 60% offtake first 2.5 years when impurity levels • Detailed contract negotiations on- are low; full freight benefits of going going and expected to be completed to this destination are for New Afton‟s in Q4 2010 account – Contract durations to be from 4.5 – New Afton also to receive freight to 6.5 years credits for delivery to other customer destinations 48
- 49. Economic impact analysis Forecast gold and copper production 100 100 92 90 90 82 83 80 78 80 70 68 70 63 Copper (Mlbs) 60 60 Gold (Koz) 50 50 39 40 40 30 30 30 20 20 10 10 0 0 2012 2013 2014 Avg. 2015 - 2017 Gold Copper 49
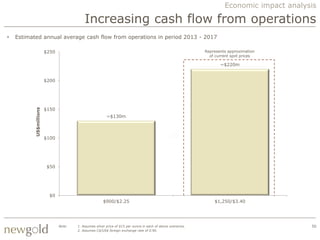
- 50. Economic impact analysis Increasing cash flow from operations • Estimated annual average cash flow from operations in period 2013 - 2017 $250 Represents approximation of current spot prices ~$220m $200 $150 US$millions ~$130m $100 $50 $0 $900/$2.25 $1,250/$3.40 Note: 1. Assumes silver price of $15 per ounce in each of above scenarios. 50 2. Assumes C$/US$ foreign exchange rate of 0.90.
- 51. Economic impact analysis Project economics 6/30/10 Forward Full Project(1) Development Capital ($mm) $388 $634 Average annual after-tax free cash flow (2013-2017) $900 Au/$2.25 Cu $114 $114 $1,250 Au/$3.40 Cu 206 206 Average annual return on invested capital (2013-2017) $900 Au/$2.25 Cu 29% 18% $1,250 Au/$3.40 Cu 53% 32% After-tax Internal Rate of Return $900 Au/$2.25 Cu 24% 12% $1,250 Au/$3.40 Cu 38% 22% Net Present Value (7% discount) $900 Au/$2.25 Cu $433 $187 $1,250 Au/$3.40 Cu 920 674 Note: 1. NPV and IRR for full project calculated based on a June 30, 2010 starting point adjusted for the $246 million in capital already spent. 51
- 52. Economic impact analysis Comfortable with copper exposure • New Gold‟s copper exposure (as a percentage of revenue) is anticipated to increase to approximately 27% in 2013(1) – In line with other large/intermediate producers non-gold revenue percentage 2010 2013 5% 5% Ag Ag 10% Cu 27% Cu 68% Au 85% Au Note: 1. Based on current spot prices for 2010 and consensus prices for 2013. 52
- 53. Thank you for your interest in New Afton Underground bolter 53