


ODSC May 2019 - The DataOps Manifesto
- 1. @ODSC THE DATAOPS MANIFESTO Boston | April 30 - May 4, 2019
- 2. Copyright © 2019 by DataKitchen, Inc. All Rights Reserved.
- 3. Copyright © 2019 by DataKitchen, Inc. All Rights Reserved. Topics Why DataOps Is Essential Seven Steps to DataOps DataOps
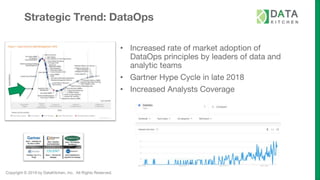
- 4. Copyright © 2019 by DataKitchen, Inc. All Rights Reserved. Strategic Trend: DataOps • Increased rate of market adoption of DataOps principles by leaders of data and analytic teams • Gartner Hype Cycle in late 2018 • Increased Analysts Coverage
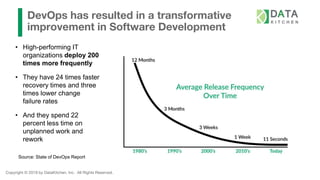
- 5. Copyright © 2019 by DataKitchen, Inc. All Rights Reserved. DevOps has resulted in a transformative improvement in Software Development • High-performing IT organizations deploy 200 times more frequently • They have 24 times faster recovery times and three times lower change failure rates • And they spend 22 percent less time on unplanned work and rework Source: State of DevOps Report
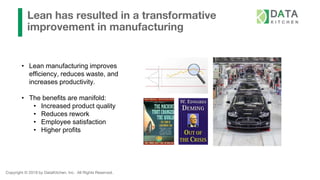
- 6. Copyright © 2019 by DataKitchen, Inc. All Rights Reserved. Lean has resulted in a transformative improvement in manufacturing • Lean manufacturing improves efficiency, reduces waste, and increases productivity. • The benefits are manifold: • Increased product quality • Reduces rework • Employee satisfaction • Higher profits
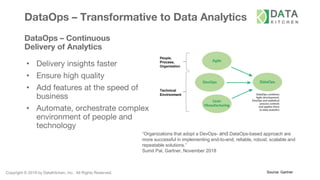
- 7. Copyright © 2019 by DataKitchen, Inc. All Rights Reserved. DataOps – Transformative to Data Analytics DataOps – Continuous Delivery of Analytics • Delivery insights faster • Ensure high quality • Add features at the speed of business • Automate, orchestrate complex environment of people and technology Source: Gartner “Organizations that adopt a DevOps- and DataOps-based approach are more successful in implementing end-to-end, reliable, robust, scalable and repeatable solutions.” Sumit Pal, Gartner, November 2018 People, Process, Organization Technical Environment
- 8. Copyright © 2019 by DataKitchen, Inc. All Rights Reserved. From To Change Fear Change Velocity Manual Operations Automated Operations Hope For Quality Integrated Quality Hero Mentality Repeatable Processes Tool Centric Code Centric Vendor Lock-In Diverse Tools How To Succeed? A Mindset Change to DataOps… …to power your highly agile data culture.
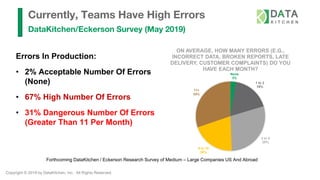
- 9. Copyright © 2019 by DataKitchen, Inc. All Rights Reserved. Currently, Teams Have High Errors DataKitchen/Eckerson Survey (May 2019) Errors In Production: • 2% Acceptable Number Of Errors (None) • 67% High Number Of Errors • 31% Dangerous Number Of Errors (Greater Than 11 Per Month) None 3% 1 to 2 18% 3 to 5 29% 6 to 10 20% 11+ 30% ON AVERAGE, HOW MANY ERRORS (E.G., INCORRECT DATA, BROKEN REPORTS, LATE DELIVERY, CUSTOMER COMPLAINTS) DO YOU HAVE EACH MONTH? Forthcoming DataKitchen / Eckerson Research Survey of Medium – Large Companies US And Abroad
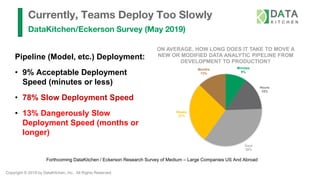
- 10. Copyright © 2019 by DataKitchen, Inc. All Rights Reserved. Currently, Teams Deploy Too Slowly DataKitchen/Eckerson Survey (May 2019) Minutes 9% Hours 15% Days 36% Weeks 27% Months 13% ON AVERAGE, HOW LONG DOES IT TAKE TO MOVE A NEW OR MODIFIED DATA ANALYTIC PIPELINE FROM DEVELOPMENT TO PRODUCTION? Pipeline (Model, etc.) Deployment: • 9% Acceptable Deployment Speed (minutes or less) • 78% Slow Deployment Speed • 13% Dangerously Slow Deployment Speed (months or longer) Forthcoming DataKitchen / Eckerson Research Survey of Medium – Large Companies US And Abroad
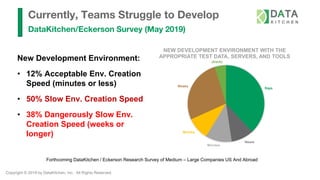
- 11. Copyright © 2019 by DataKitchen, Inc. All Rights Reserved. Currently, Teams Struggle to Develop DataKitchen/Eckerson Survey (May 2019) New Development Environment: • 12% Acceptable Env. Creation Speed (minutes or less) • 50% Slow Env. Creation Speed • 38% Dangerously Slow Env. Creation Speed (weeks or longer) Forthcoming DataKitchen / Eckerson Research Survey of Medium – Large Companies US And Abroad Days Hours Minutes Months Weeks (blank) NEW DEVELOPMENT ENVIRONMENT WITH THE APPROPRIATE TEST DATA, SERVERS, AND TOOLS
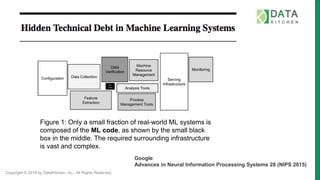
- 12. Copyright © 2019 by DataKitchen, Inc. All Rights Reserved. Figure 1: Only a small fraction of real-world ML systems is composed of the ML code, as shown by the small black box in the middle. The required surrounding infrastructure is vast and complex. Google Advances in Neural Information Processing Systems 28 (NIPS 2015)
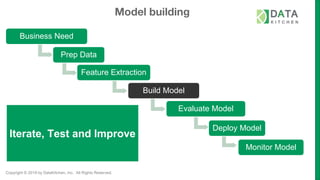
- 13. Copyright © 2019 by DataKitchen, Inc. All Rights Reserved. Business Need Prep Data Feature Extraction Build Model Evaluate Model Deploy Model Monitor Model Iterate, Test and Improve Model building
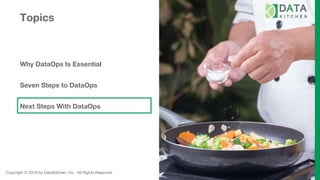
- 14. Copyright © 2019 by DataKitchen, Inc. All Rights Reserved. Topics Why DataOps Is Essential Seven Steps to DataOps Next Steps With DataOps
- 15. Copyright © 2019 by DataKitchen, Inc. All Rights Reserved. Seven Steps to DataOps 1. Orchestrate Two Journeys 2. Add Tests And Monitoring 3. Use a Version Control System 4. Branch and Merge 5. Use Multiple Environments 6. Reuse & Containerize 7. Parameterize Your Processing People, Process, Organization Technical Environment = 7 steps
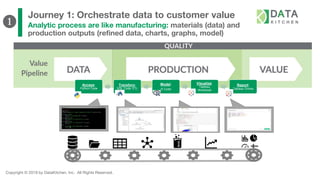
- 16. Copyright © 2019 by DataKitchen, Inc. All Rights Reserved. Journey 1: Orchestrate data to customer value Analytic process are like manufacturing: materials (data) and production outputs (refined data, charts, graphs, model) Access: Python Code Transform: SQL Code, ETL Model: R Code Visualize: Tableau Workbook Report: Tableau Online ❶
- 17. Copyright © 2019 by DataKitchen, Inc. All Rights Reserved. Journey 2: Speed deployment to production Analytic processes are like software development: deliverables continually move from development to production Data Engineers Data Scientists Data Analysts Diverse Team Diverse Tools Diverse Customers Business Customer Products & Systems ❶
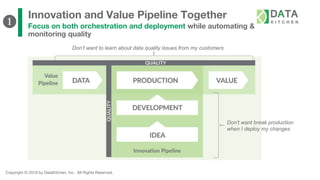
- 18. Copyright © 2019 by DataKitchen, Inc. All Rights Reserved. Innovation and Value Pipeline Together Focus on both orchestration and deployment while automating & monitoring quality Don’t want break production when I deploy my changes Don’t want to learn about data quality issues from my customers ❶
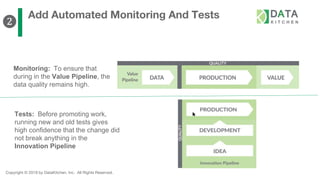
- 19. Copyright © 2019 by DataKitchen, Inc. All Rights Reserved. Add Automated Monitoring And Tests Monitoring: To ensure that during in the Value Pipeline, the data quality remains high. Tests: Before promoting work, running new and old tests gives high confidence that the change did not break anything in the Innovation Pipeline ❷
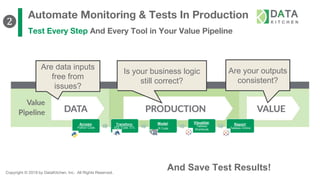
- 20. Copyright © 2019 by DataKitchen, Inc. All Rights Reserved. Automate Monitoring & Tests In Production Test Every Step And Every Tool in Your Value Pipeline Are your outputs consistent? And Save Test Results! Are data inputs free from issues? Is your business logic still correct? Access: Python Code Transform: SQL Code, ETL Model: R Code Visualize: Tableau Workbook Report: Tableau Online ❷
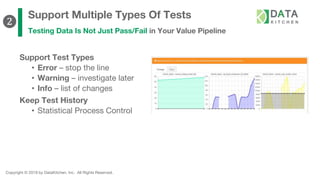
- 21. Copyright © 2019 by DataKitchen, Inc. All Rights Reserved. Support Multiple Types Of Tests Testing Data Is Not Just Pass/Fail in Your Value Pipeline Support Test Types • Error – stop the line • Warning – investigate later • Info – list of changes Keep Test History • Statistical Process Control ❷
- 22. Copyright © 2019 by DataKitchen, Inc. All Rights Reserved. Types of Tests ❷
- 23. Copyright © 2019 by DataKitchen, Inc. All Rights Reserved. Example Tests Simple ❷
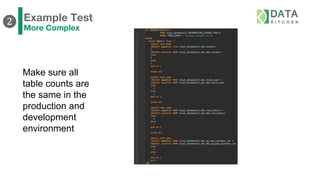
- 24. Example Test More Complex Make sure all table counts are the same in the production and development environment ❷
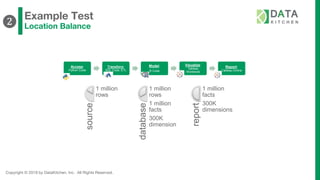
- 25. Copyright © 2019 by DataKitchen, Inc. All Rights Reserved. Example Test Location Balance❷ Access: Python Code Transform: SQL Code, ETL Model: R Code Visualize: Tableau Workbook Report: Tableau Online source 1 million rows database 1 million rows 1 million facts 300K dimension report 1 million facts 300K dimensions
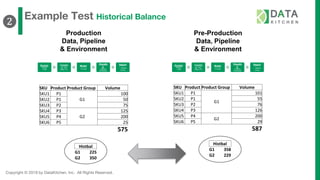
- 26. Copyright © 2019 by DataKitchen, Inc. All Rights Reserved. Example Test Historical Balance ❷ SKU Product Product Group Volume SKU1 P1 G1 100 SKU2 P1 50 SKU3 P2 75 SKU4 P3 G2 125 SKU5 P4 200 SKU6 P5 25 575 Production Data, Pipeline & Environment Pre-Production Data, Pipeline & Environment SKU Product Product Group Volume SKU1 P1 G1 101 SKU2 P1 55 SKU3 P2 76 SKU4 P3 126 SKU5 P4 G2 200 SKU6 P5 29 587 Access: Python Code Transfor m: SQL Code, ETL Model: R Code Visualiz e: Tableau Workbook Report : Tableau Online Access: Python Code Transfor m: SQL Code, ETL Model: R Code Visualiz e: Tableau Workbook Report : Tableau Online Histbal G1 225 G2 350 Histbal G1 358 G2 229
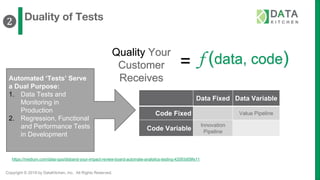
- 27. Copyright © 2019 by DataKitchen, Inc. All Rights Reserved. Automated ‘Tests’ Serve a Dual Purpose: 1. Data Tests and Monitoring in Production 2. Regression, Functional and Performance Tests in Development Data Fixed Data Variable Code Fixed Value Pipeline Code Variable Innovation Pipeline Quality Your Customer Receives = f (data, code) https://medium.com/data-ops/disband-your-impact-review-board-automate-analytics-testing-42093d09fe11 Duality of Tests❷
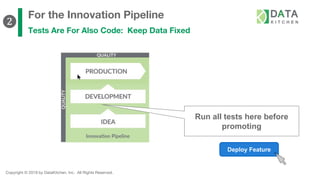
- 28. Copyright © 2019 by DataKitchen, Inc. All Rights Reserved. For the Innovation Pipeline Tests Are For Also Code: Keep Data Fixed Deploy Feature Run all tests here before promoting ❷
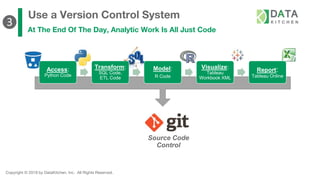
- 29. Copyright © 2019 by DataKitchen, Inc. All Rights Reserved. Use a Version Control System At The End Of The Day, Analytic Work Is All Just Code Access: Python Code Transform: SQL Code, ETL Code Model: R Code Visualize: Tableau Workbook XML Report: Tableau Online Source Code Control ❸
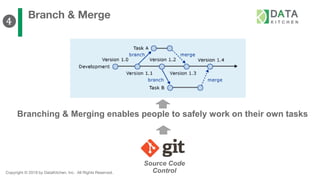
- 30. Copyright © 2019 by DataKitchen, Inc. All Rights Reserved. Branch & Merge Source Code Control Branching & Merging enables people to safely work on their own tasks ❹
- 31. Copyright © 2019 by DataKitchen, Inc. All Rights Reserved. Example Branch And Merge Pattern Sprint 1 Sprint 2 f1 f2 f3 main / master / trunk f5 ❹
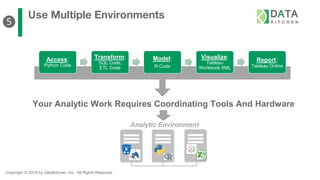
- 32. Copyright © 2019 by DataKitchen, Inc. All Rights Reserved. Access: Python Code Transform: SQL Code, ETL Code Model: R Code Visualize: Tableau Workbook XML Report: Tableau Online Use Multiple Environments Analytic Environment Your Analytic Work Requires Coordinating Tools And Hardware ❺
- 33. Copyright © 2019 by DataKitchen, Inc. All Rights Reserved. Use Multiple Environments Provide an Analytic Environment for each branch • Analysts need a controlled environment for their experiments • Engineers need a place to develop outside of production • Update Production only after all tests are run! ❺
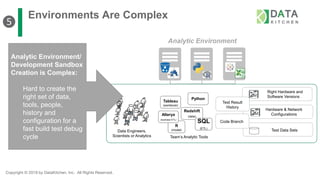
- 34. Copyright © 2019 by DataKitchen, Inc. All Rights Reserved. Environments Are Complex Analytic Environment ❺ Data Engineers, Scientists or Analytics Team’s Analytic Tools R (model) Alteryx (business ETL) Redshift (data) SQL (ETL) Hardware & Network Configurations Right Hardware and Software Versions Tableau (workbook) Python Test Data Sets Code Branch Test Result History Analytic Environment/ Development Sandbox Creation is Complex: Hard to create the right set of data, tools, people, history and configuration for a fast build test debug cycle
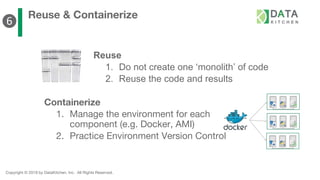
- 35. Copyright © 2019 by DataKitchen, Inc. All Rights Reserved. Reuse & Containerize Containerize 1. Manage the environment for each component (e.g. Docker, AMI) 2. Practice Environment Version Control Reuse 1. Do not create one ‘monolith’ of code 2. Reuse the code and results ❻
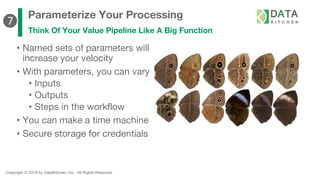
- 36. Copyright © 2019 by DataKitchen, Inc. All Rights Reserved. Parameterize Your Processing Think Of Your Value Pipeline Like A Big Function • Named sets of parameters will increase your velocity • With parameters, you can vary • Inputs • Outputs • Steps in the workflow • You can make a time machine • Secure storage for credentials ❼
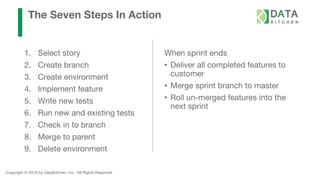
- 37. Copyright © 2019 by DataKitchen, Inc. All Rights Reserved. The Seven Steps In Action 1. Select story 2. Create branch 3. Create environment 4. Implement feature 5. Write new tests 6. Run new and existing tests 7. Check in to branch 8. Merge to parent 9. Delete environment When sprint ends • Deliver all completed features to customer • Merge sprint branch to master • Roll un-merged features into the next sprint
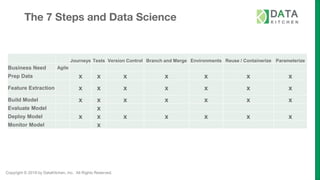
- 38. Copyright © 2019 by DataKitchen, Inc. All Rights Reserved. The 7 Steps and Data Science Journeys Tests Version Control Branch and Merge Environments Reuse / Containerize Parameterize Business Need Agile Prep Data x x x x x x x Feature Extraction x x x x x x x Build Model x x x x x x x Evaluate Model x Deploy Model x x x x x x x Monitor Model x
- 39. Copyright © 2019 by DataKitchen, Inc. All Rights Reserved. Topics Why DataOps Is Essential Seven Steps to DataOps Next Steps With DataOps
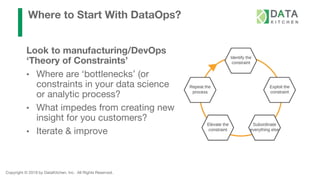
- 40. Copyright © 2019 by DataKitchen, Inc. All Rights Reserved. Where to Start With DataOps? Look to manufacturing/DevOps ‘Theory of Constraints’ • Where are ‘bottlenecks’ (or constraints in your data science or analytic process? • What impedes from creating new insight for you customers? • Iterate & improve
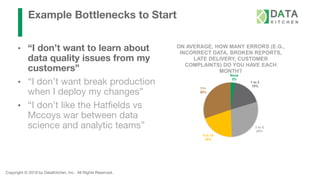
- 41. Copyright © 2019 by DataKitchen, Inc. All Rights Reserved. Example Bottlenecks to Start • “I don’t want to learn about data quality issues from my customers” • “I don’t want break production when I deploy my changes” • “I don’t like the Hatfields vs Mccoys war between data science and analytic teams” None 3% 1 to 2 18% 3 to 5 29% 6 to 10 20% 11+ 30% ON AVERAGE, HOW MANY ERRORS (E.G., INCORRECT DATA, BROKEN REPORTS, LATE DELIVERY, CUSTOMER COMPLAINTS) DO YOU HAVE EACH MONTH?
- 42. Copyright © 2019 by DataKitchen, Inc. All Rights Reserved. Example Bottlenecks to Start • “I don’t want to learn about data quality issues from my customers” • “I don’t want break production when I deploy my changes” • “I don’t like the Hatfields vs Mccoys war between data science and analytic teams” Minutes 9% Hours 15% Days 36% Weeks 27% Months 13% ON AVERAGE, HOW LONG DOES IT TAKE TO MOVE A NEW OR MODIFIED DATA ANALYTIC PIPELINE FROM DEVELOPMENT TO PRODUCTION?
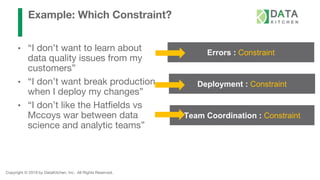
- 43. Copyright © 2019 by DataKitchen, Inc. All Rights Reserved. Example: Which Constraint? • “I don’t want to learn about data quality issues from my customers” • “I don’t want break production when I deploy my changes” • “I don’t like the Hatfields vs Mccoys war between data science and analytic teams” Errors : Constraint Deployment : Constraint Team Coordination : Constraint
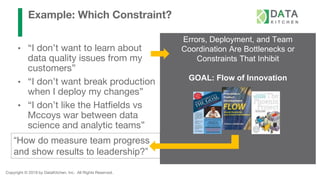
- 44. Copyright © 2019 by DataKitchen, Inc. All Rights Reserved. Example: Which Constraint? • “I don’t want to learn about data quality issues from my customers” • “I don’t want break production when I deploy my changes” • “I don’t like the Hatfields vs Mccoys war between data science and analytic teams” Errors, Deployment, and Team Coordination Are Bottlenecks or Constraints That Inhibit GOAL: Flow of Innovation “How do measure team progress and show results to leadership?”
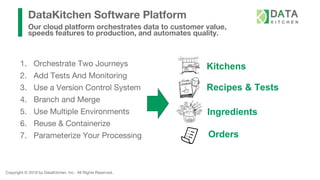
- 45. Copyright © 2019 by DataKitchen, Inc. All Rights Reserved. DataKitchen Software Platform Our cloud platform orchestrates data to customer value, speeds features to production, and automates quality. Kitchens Recipes & Tests Orders Ingredients 1. Orchestrate Two Journeys 2. Add Tests And Monitoring 3. Use a Version Control System 4. Branch and Merge 5. Use Multiple Environments 6. Reuse & Containerize 7. Parameterize Your Processing
- 46. Copyright © 2019 by DataKitchen, Inc. All Rights Reserved. For More Information • For These Slides, Contact Me: • cbergh@datakitchen.io • DataOps Manifesto: • http://dataopsmanifesto.org • DataOps Blog: • http://medium.com/data-ops • Follow Twitter: • #DataOps