Location via proxy:   [ UP ]  
[Report a bug]   [Manage cookies]                
SlideShare a Scribd company logo
Copyright of Shell International B.V. 
MODELLING AND QUALITATIVE 
SCENARIOS 
Wim Thomas 
Chief Energy Advisor, Shell International BV 
OECD - NAEC Seminar 
Learning with Futures using 
Narratives and Numbers 
1 December 2014
Copyright of Shell International B.V. 
DEFINITIONS AND CAUTIONARY NOTE 
2 
Reserves: Our use of the term “reserves” in this presentation means SEC proved oil and gas reserves. 
Resources: Our use of the term “resources” in this presentation includes quantities of oil and gas not yet classified as SEC proved oil and gas reserves. Resources are consistent with the Society of Petroleum Engineers 2P and 2C definitions. 
Organic: Our use of the term Organic includes SEC proved oil and gas reserves excluding changes resulting from acquisitions, divestments and year-average pricing impact. 
Resources plays: our use of the term ‘resources plays’ refers to tight, shale and coal bed methane oil and gas acreage. 
The companies in which Royal Dutch Shell plc directly and indirectly owns investments are separate entities. In this presentation “Shell”, “Shell group” and “Royal Dutch Shell” are sometimes used for convenience where references are made to Royal Dutch Shell plc and its subsidiaries in general. Likewise, the words “we”, “us” and “our” are also used to refer to subsidiaries in general or to those who work for them. These expressions are also used where no useful purpose is served by identifying the particular company or companies. ‘‘Subsidiaries’’, “Shell subsidiaries” and “Shell companies” as used in this presentation refer to companies in which Royal Dutch Shell either directly or indirectly has control, by having either a majority of the voting rights or the right to exercise a controlling influence. The companies in which Shell has significant influence but not control are referred to as “associated companies” or “associates” and companies in which Shell has joint control are referred to as “jointly controlled entities”. In this presentation, associates and jointly controlled entities are also referred to as “equity-accounted investments”. The term “Shell interest” is used for convenience to indicate the direct and/or indirect ownership interest held by Shell in a venture, partnership or company, after exclusion of all third-party interest. 
This presentation contains forward-looking statements concerning the financial condition, results of operations and businesses of Royal Dutch Shell. All statements other than statements of historical fact are, or may be deemed to be, forward-looking statements. Forward-looking statements are statements of future expectations that are based on management’s current expectations and assumptions and involve known and unknown risks and uncertainties that could cause actual results, performance or events to differ materially from those expressed or implied in these statements. Forward-looking statements include, among other things, statements concerning the potential exposure of Royal Dutch Shell to market risks and statements expressing management’s expectations, beliefs, estimates, forecasts, projections and assumptions. These forward-looking statements are identified by their use of terms and phrases such as ‘‘anticipate’’, ‘‘believe’’, ‘‘could’’, ‘‘estimate’’, ‘‘expect’’, ‘‘intend’’, ‘‘may’’, ‘‘plan’’, ‘‘objectives’’, ‘‘outlook’’, ‘‘probably’’, ‘‘project’’, ‘‘will’’, ‘‘seek’’, ‘‘target’’, ‘‘risks’’, ‘‘goals’’, ‘‘should’’ and similar terms and phrases. There are a number of factors that could affect the future operations of Royal Dutch Shell and could cause those results to differ materially from those expressed in the forward-looking statements included in this presentation, including (without limitation): (a) price fluctuations in crude oil and natural gas; (b) changes in demand for Shell’s products; (c) currency fluctuations; (d) drilling and production results; (e) reserves estimates; (f) loss of market share and industry competition; (g) environmental and physical risks; (h) risks associated with the identification of suitable potential acquisition properties and targets, and successful negotiation and completion of such transactions; (i) the risk of doing business in developing countries and countries subject to international sanctions; (j) legislative, fiscal and regulatory developments including potential litigation and regulatory measures as a result of climate changes; (k) economic and financial market conditions in various countries and regions; (l) political risks, including the risks of expropriation and renegotiation of the terms of contracts with governmental entities, delays or advancements in the approval of projects and delays in the reimbursement for shared costs; and (m) changes in trading conditions. All forward-looking statements contained in this presentation are expressly qualified in their entirety by the cautionary statements contained or referred to in this section. Readers should not place undue reliance on forward-looking statements. Additional factors that may affect future results are contained in Royal Dutch Shell’s 20-F for the year ended 31 December, 2013 (available at www.shell.com/investor and www.sec.gov ). These factors also should be considered by the reader. Each forward-looking statement speaks only as of the date of this presentation, 27 November, 2014. Neither Royal Dutch Shell nor any of its subsidiaries undertake any obligation to publicly update or revise any forward-looking statement as a result of new information, future events or other information. In light of these risks, results could differ materially from those stated, implied or inferred from the forward-looking statements contained in this presentation. There can be no assurance that dividend payments will match or exceed those set out in this presentation in the future, or that they will be made at all. 
We use certain terms in this presentation, such as discovery potential, that the United States Securities and Exchange Commission (SEC) guidelines strictly prohibit us from including in filings with the SEC. U.S. Investors are urged to consider closely the disclosure in our Form 20-F, File No 1-32575, available on the SEC website www.sec.gov. You can also obtain this form from the SEC by calling 1-800-SEC-0330.
Copyright of Shell International B.V. 
OVERVIEW 
Success in the future depends not on the success of future decisions but on the future success of decisions taken today 
Introduction 
Shell’s scenario methodology 
From storyline to quantification 
3
Copyright of Shell International B.V. 
WHY DO WE USE SCENARIOS? 
Relevant to our business 
Develop or test strategies and plans 
Search for resilience 
Identify threats & opportunities and develop options 
Make risky decisions more transparent 
Focus on the ‘near future’, i.e. strategy & policy agenda next 1-3 years NOT on scenario horizon 
Ask “what if” questions, not necessarily give answers 
Challenge assumptions and mental models 
Enrich debate and identify ‘certainties’ 
? 
4
Copyright of Shell International B.V. 
LONG RISK HORIZONS 
0 
5 
10 
15 
20 
Years from discovery to first sales 
Sakhalin II, Russia 
2010 
Gas Project Lead-time 
5 
SAKHALIN II LNG PLANT 
LUNSKOYA PLATFORM
Copyright of Shell International B.V. 
OUR LEARNING TO DATE 
Scenarios can help generate vision and strategy 
Proper use requires ‘good’ scenarios and receptive organisation & culture 
All scenarios need to be ‘focused’, plausible, recognisable, challenging and consequential 
Must be underpinned by rigorous analysis and quantification 
Integrate into the strategy process for flexibility in the strategic plan 
Scenarios can be used for better project evaluation 
BUT 
Actual events often fall outside scenario range 
A good “forecast” now and then helps credibility 
Scenarios can be misused to justify bad judgement, strategy or timing 
DO NOT FORGET 
Communication, communication, communication 
… after 40 years we are still learning 
6
Copyright of Shell International B.V. 
SHELL’S SCENARIO METHODOLOGY
Copyright of Shell International B.V. 
UNDERSTANDING THE INTERACTIONS 
Politics 
Environment 
Technology 
Society 
Economics 
8
Copyright of Shell International B.V. 
WHAT REALLY MATTERS? 
Outside the Box: 
Things that matter and that people in the business don’t know about 
Important/Impact 
Inside the Box: 
Things that matter and that people in the business know that matter 
Critical Issues 
9
Copyright of Shell International B.V. 
Surface implicit assumptions 
Drivers 
ELEMENTS OF SCENARIO BUILDING 
Dynamics 
Framework 
1 2 3 4 
Quantification 
 
Pre-determined 
? 
Uncertainties 
Frames of reference 
Scenarios 
relevant to decisions 
10 
Time Horizon 
Problematique 
Surface conflicts and dilemmas 
? 
Dominant mental models
Copyright of Shell International B.V. 
VARIETY OF METHODS 
Inductive 
Scenario 1 
Scenario 2 
Scenario 3 
Official future 
Forecast 
Alternative scenario 
Incremental 
Normative 
Vision 
Scenario 1 
Scenario 2 
Scenario 3 
Scenario 4 
Deductive 
Uncertainty 1 
Uncertainty 2 
11
Copyright of Shell International B.V. 
HOW FAR AHEAD DO WE SEE? 
Event/Problem 
focused 
Short term 
(2 years) 
Medium term 
(5-15 years) 
Long term 
(20 years) 
Very 
long term 
(50 years) 
Country/ 
business 
focused 
Business 
focused 
Issue 
focused 
(September 11th) 
Subprime crisis 
Deepwater Horizon 
(Your Company) 
(Mobility, 
Cities) 
(Energy systems) 
Global 
Scenarios 
Long Term Energy Scenarios 
Focussed Scenarios 
12
Copyright of Shell International B.V. 
FEATURES OF A GOOD SCENARIO 
Plausible 
Recognisable from signals in the present 
Internally consistent 
Challenging 
Consequential 
… stories describing paths to different futures 
Predictions 
Projections 
Preferences 
 
X 
13
Copyright of Shell International B.V. 
SHELL’S WORLD ENERGY DEMAND MODEL 
TOTAL FINAL CONSUMPTION 
100 
100 
YEARS 
COUNTRIES & REGIONS (INC. 82 COUNTRIES INDIVIDUALLY) 
14 
SECTORS 
10 
ENERGY CARRIERS 
18 
ENERGY SOURCES 
USA 
CONVERSION TECHNOLOGIES 
TOTAL PRIMARY ENERGY DEMAND 
ENERGY SUPPLY 
REST OF EUROPE WEST OTHER 
HEAVY INDUSTRY 
SOLID HYDROCARBON FUELS 
OIL 
CHINA 
REST OF EUROPE EAST OTHER 
AGRICULTURE & OTHER INDUSTRY 
LIQUID HYDROCARBON FUELS 
NATURAL GAS 
RUSSIA 
REST OF EU NEW 13 
GASEOUS HYDROCARBON FUELS 
COAL 
SERVICES 
PASSENGER TRANSPORT – SHIP 
PASSENGER TRANSPORT – RAIL 
PASSENGER TRANSPORT – ROAD 
PASSENGER TRANSPORT – AIR 
FREIGHT TRANSPORT – SHIP 
FREIGHT TRANSPORT – RAIL 
FREIGHT TRANSPORT – ROAD 
FREIGHT TRANSPORT – AIR 
RESIDENTIAL – HEATING & COOKING 
RESIDENTIAL – LIGHTING & APPLIANCES 
NON ENERGY USE 
INDIA 
BALTIC STATES 
ELECTRICITY – COMMERCIAL 
NUCLEAR 
JAPAN 
REST OF CENTRAL ASIA 
ELECTRICITY – DISTRIBUTED SOLAR PV 
HYDRO-ELECTRICITY 
GERMANY 
REST OF EAST ASIA 
BIO-FUELS – 1ST GEN 
FRANCE 
REST OF SE ASIA 
BIO-FUELS – 2ND GEN 
UNITED KINGDOM 
REST OF MIDDLE EAST 
BIOMASS – TRADITIONAL 
CANADA 
REST OF SOUTH ASIA 
BIO-FUELS – MARINE 
REST OF NORTH AFRICA 
REST OF ARABIAN PENINSULA 
REST OF AFRICA 
OMAN 
REST OF SOUTHERN AFRICA 
REST OF NORTH AMERICA 
REST OF WEST AFRICA 
REST OF SOUTH AMERICA 
REST OF CENTRAL AMERICA & CARIBBEAN 
REST OF OCEANIA 
AZERBAIJAN 
PERU 
MOROCCO 
MOZAMBIQUE 
ANGOLA 
ECUADOR 
LUXEMBOURG 
YEMEN 
HYDROGEN 
HEAT – COMMERCIAL 
HEAT – DISTRIBUTED SOLAR THERMAL 
BIOMASS – COMMERCIAL 
BIOMASS – TRADITIONAL 
BIOMASS – COMMERCIAL 
WASTE 
GEOTHERMAL – HYDROTHERMAL 
GEOTHERMAL – ENGINEERED 
SOLAR – PHOTOVOLTAIC 
WIND 
TIDAL 
WAVE 
14
Copyright of Shell International B.V. 
SHELL’S OIL & GAS SUPPLY MODEL 
YET TO FINDS 
PRODUCTION 
DEVELOPED RESERVES 
UNDEVELOPED 
DISCOVERED VOLUMES 
15
Copyright of Shell International B.V. 
OIL 32% 
GAS 22% 
COAL 28% 
BIOMASS 10% 
NUCLEAR 5% 
RENEWABLES 3% 
FUELS 82% 
ELECTRICITY 
18% 
RESIDENTIAL 24% 
INDUSTRY & SERVICES 50% 
TRANSPORT 26% 
Shell’s World Energy Model sees the global energy system as one integrated ‘balloon’, expanding and contracting with population and economic development. Developments in one part of the world or value chain will interact elsewhere, allowing competitive and policy forces to play out coherently throughout the system. 
TODAY’S ENERGY SYSTEM SETS THE CONTEXT FOR THE FUTURE 
16
Copyright of Shell International B.V. 
FROM STORYLINE TO QUANTIFICATION
Copyright of Shell International B.V. 
SIX KEY DRIVERS OF THE ENERGY SYSTEM 
18
WE ARE ENTERING 
AN ERA OF VOLATILITY & TRANSITIONS 
Political & social instability 
Demographic transitions- urbanisation 
Emerging resources Shale gas & oil 
Challenged environmental boundaries 
Building a ‘mini-lateral’ world 
Intensified economic cycles 
19
MOUNTAINS 
A VIEW FROM THE TOP 
Concentration of power – elites drive policy 
Global economic growth moderates 
Nationalist world 
The Gas Backbone – the global shale revolution 
Nuclear renaissance 
Renewables sluggish 
‘Clean’ energy: CCS takes off by 2030 
1200 
1000 
800 
600 
400 
200 
0 
EJ/yr 
2000 
2010 
2020 
2030 
2040 
2050 
2060 
World Total Primary Energy 
Oil 
Biofuels 
Natural Gas 
Biomass Gasified 
Coal 
Biomass/Waste 
Biomass Traditional 
Nuclear 
Hydro 
Geothermal 
Solar 
Wind 
20 
Social stability, the long view
OCEANS 
A VIEW OF THE HORIZON 
World Total Primary Energy 
Rising aspirations drive people power 
Reform unleashes market forces and economic growth 
A fast adaptors, open borders world 
Energy supply struggles to keep pace with demand 
Unconventional gas proves disappointing outside of NA 
Rise of renewables 
A late ‘Green’ world 
Oil 
Biofuels 
Natural Gas 
Biomass Gasified 
Coal 
Biomass/Waste 
Biomass Traditional 
Nuclear 
Hydro 
Geothermal 
Solar 
Wind 
EJ/yr 
1200 
1000 
800 
600 
400 
200 
0 
2000 
2010 
2020 
2030 
2040 
2050 
2060 
21 
Churn, innovation, reform
22 
GLOBAL ENERGY-RELATED CO2 EMISSIONS 
? 
Normative scenario 
theoretically feasible but seemingly implausible 
plausible but unfeasible? 
Exploratory scenarios 
OVERSHOOT, DAMAGE … REPAIR?
23 
NATIONAL CONTRAST 
TOTAL PRIMARY ENERGY IN OCEANS 
USA 
China 
Oil 
Natural Gas 
Coal 
Nuclear 
Hydro-electricty 
Biofuels 
Biomass/Waste 
Biomass Traditional 
Geothermal 
Solar 
Wind 
Other Renewables 
2000 
2010 
2020 
2030 
2040 
2050 
2060 
0 
20 
40 
60 
80 
100 
120 
140 
160 
180 
200 
EJ/Year (energy Source) 
2000 
2010 
2020 
2030 
2040 
2050 
2060 
0 
20 
40 
60 
80 
100 
120 
140 
160 
180 
200
24 
SCENARIO CONTRAST 
WORLD PASSENGER TRANSPORT 
Mountains 
Oceans 
Combined with the impact of higher economic development, Oceans sprawling suburbs lead to higher travel needs than Mountains compact cities 
Electricity and Hydrogen 
Gaseous Hydrocarbon Fuels 
Liquid Hydrocarbon Fuels & Biofuels 
2000 
2010 
2020 
2030 
2040 
2050 
2060 
0 
10,000 
20,000 
30,000 
40,000 
50,000 
60,000 
Billion vehicle km 
2000 
2010 
2020 
2030 
2040 
2050 
2060 
0 
10,000 
20,000 
30,000 
40,000 
50,000 
60,000
25 
SCENARIO CONTRAST 
OPEC AND NON-OPEC PRODUCTION 
Mountains 
Oil, condensate & NGL production 
Oceans 
Oil, condensate & NGL production 
The effect of abundant gas and a slower growing global economy affect the call on OPEC in Mountains 
OPEC 
Non OPEC 
0 
10 
20 
30 
40 
50 
60 
2000 
2010 
2020 
2030 
2040 
2050 
2060 
mboe / day 
0 
10 
20 
30 
40 
50 
60 
2000 
2010 
2020 
2030 
2040 
2050 
2060 
mboe / day
Copyright of Shell International B.V. 
Q & A
Copyright of Shell International B.V. 
HOW DO SCENARIOS COMPARE WITH OTHERS’ OUTLOOKS?
Copyright of Shell International B.V. 
Overall energy system balances on people’s needs, options, actions and reactions 
0 
200 
400 
600 
800 
1,000 
1,200 
2010 
2015 
2020 
2025 
2030 
2035 
2040 
2045 
2050 
EJ / year 
Year 
Total Primary Energy - World - All Sources 
Mountains 
Oceans 
WEO14 CP 
WEO14 NP 
WEO14 450 
EIA13 Ref 
EIA13 HighEG 
XOM 2014 
BP 2014 
FSB Energy External Scenario Comparison Tool v3.4
Copyright of Shell International B.V. 
We envisage the possibility of a significant different pathway for oil use 
0 
50 
100 
150 
200 
250 
300 
2010 
2015 
2020 
2025 
2030 
2035 
2040 
2045 
2050 
EJ / year 
Year 
Total Primary Energy - World - Oil & Biofuels 
Mountains 
Oceans 
WEO14 CP 
WEO14 NP 
WEO14 450 
EIA13 Ref 
EIA13 HighEG 
XOM 2014 
BP 2014 
FSB Energy External Scenario Comparison Tool v3.4
Copyright of Shell International B.V. 
Unconventional gas could make gas the dominant fuel in the 2030s … or perhaps not if fracking is opposed outside NA 
0 
50 
100 
150 
200 
250 
2010 
2015 
2020 
2025 
2030 
2035 
2040 
2045 
2050 
EJ / year 
Year 
Total Primary Energy - World - Gas 
Mountains 
Oceans 
WEO14 CP 
WEO14 NP 
WEO14 450 
EIA13 Ref 
EIA13 HighEG 
XOM 2014 
BP 2014 
FSB Energy External Scenario Comparison Tool v3.4
Copyright of Shell International B.V. 
Is coal still king in future …? 
0 
50 
100 
150 
200 
250 
300 
350 
2010 
2015 
2020 
2025 
2030 
2035 
2040 
2045 
2050 
EJ / year 
Year 
Total Primary Energy - World - Coal 
Mountains 
Oceans 
WEO14 CP 
WEO14 NP 
WEO14 450 
EIA13 Ref 
EIA13 HighEG 
XOM 2014 
BP 2014 
FSB Energy External Scenario Comparison Tool v3.4
Copyright of Shell International B.V. 
… or will nuclear see a revival …? 
0 
10 
20 
30 
40 
50 
60 
70 
80 
90 
100 
2010 
2015 
2020 
2025 
2030 
2035 
2040 
2045 
2050 
EJ / year 
Year 
Total Primary Energy - World - Nuclear 
Mountains 
Oceans 
WEO14 CP 
WEO14 NP 
WEO14 450 
EIA13 Ref 
EIA13 HighEG 
XOM 2014 
BP 2014 
FSB Energy External Scenario Comparison Tool v3.4
Copyright of Shell International B.V. 
… or is the age of Renewables upon us? 
0 
50 
100 
150 
200 
250 
300 
2010 
2015 
2020 
2025 
2030 
2035 
2040 
2045 
2050 
EJ / year 
Year 
Total Primary Energy - World - Renewables & Biomass 
Mountains 
Oceans 
WEO14 CP 
WEO14 NP 
WEO14 450 
EIA13 Ref 
EIA13 HighEG 
XOM 2014 
BP 2014 
FSB Energy External Scenario Comparison Tool v3.4
Copyright of Shell International B.V.

More Related Content

2014.12.01 - NAEC-Strategic Foresight Workshop_Session 4_Wim Thomas

  • 1. Copyright of Shell International B.V. MODELLING AND QUALITATIVE SCENARIOS Wim Thomas Chief Energy Advisor, Shell International BV OECD - NAEC Seminar Learning with Futures using Narratives and Numbers 1 December 2014
  • 2. Copyright of Shell International B.V. DEFINITIONS AND CAUTIONARY NOTE 2 Reserves: Our use of the term “reserves” in this presentation means SEC proved oil and gas reserves. Resources: Our use of the term “resources” in this presentation includes quantities of oil and gas not yet classified as SEC proved oil and gas reserves. Resources are consistent with the Society of Petroleum Engineers 2P and 2C definitions. Organic: Our use of the term Organic includes SEC proved oil and gas reserves excluding changes resulting from acquisitions, divestments and year-average pricing impact. Resources plays: our use of the term ‘resources plays’ refers to tight, shale and coal bed methane oil and gas acreage. The companies in which Royal Dutch Shell plc directly and indirectly owns investments are separate entities. In this presentation “Shell”, “Shell group” and “Royal Dutch Shell” are sometimes used for convenience where references are made to Royal Dutch Shell plc and its subsidiaries in general. Likewise, the words “we”, “us” and “our” are also used to refer to subsidiaries in general or to those who work for them. These expressions are also used where no useful purpose is served by identifying the particular company or companies. ‘‘Subsidiaries’’, “Shell subsidiaries” and “Shell companies” as used in this presentation refer to companies in which Royal Dutch Shell either directly or indirectly has control, by having either a majority of the voting rights or the right to exercise a controlling influence. The companies in which Shell has significant influence but not control are referred to as “associated companies” or “associates” and companies in which Shell has joint control are referred to as “jointly controlled entities”. In this presentation, associates and jointly controlled entities are also referred to as “equity-accounted investments”. The term “Shell interest” is used for convenience to indicate the direct and/or indirect ownership interest held by Shell in a venture, partnership or company, after exclusion of all third-party interest. This presentation contains forward-looking statements concerning the financial condition, results of operations and businesses of Royal Dutch Shell. All statements other than statements of historical fact are, or may be deemed to be, forward-looking statements. Forward-looking statements are statements of future expectations that are based on management’s current expectations and assumptions and involve known and unknown risks and uncertainties that could cause actual results, performance or events to differ materially from those expressed or implied in these statements. Forward-looking statements include, among other things, statements concerning the potential exposure of Royal Dutch Shell to market risks and statements expressing management’s expectations, beliefs, estimates, forecasts, projections and assumptions. These forward-looking statements are identified by their use of terms and phrases such as ‘‘anticipate’’, ‘‘believe’’, ‘‘could’’, ‘‘estimate’’, ‘‘expect’’, ‘‘intend’’, ‘‘may’’, ‘‘plan’’, ‘‘objectives’’, ‘‘outlook’’, ‘‘probably’’, ‘‘project’’, ‘‘will’’, ‘‘seek’’, ‘‘target’’, ‘‘risks’’, ‘‘goals’’, ‘‘should’’ and similar terms and phrases. There are a number of factors that could affect the future operations of Royal Dutch Shell and could cause those results to differ materially from those expressed in the forward-looking statements included in this presentation, including (without limitation): (a) price fluctuations in crude oil and natural gas; (b) changes in demand for Shell’s products; (c) currency fluctuations; (d) drilling and production results; (e) reserves estimates; (f) loss of market share and industry competition; (g) environmental and physical risks; (h) risks associated with the identification of suitable potential acquisition properties and targets, and successful negotiation and completion of such transactions; (i) the risk of doing business in developing countries and countries subject to international sanctions; (j) legislative, fiscal and regulatory developments including potential litigation and regulatory measures as a result of climate changes; (k) economic and financial market conditions in various countries and regions; (l) political risks, including the risks of expropriation and renegotiation of the terms of contracts with governmental entities, delays or advancements in the approval of projects and delays in the reimbursement for shared costs; and (m) changes in trading conditions. All forward-looking statements contained in this presentation are expressly qualified in their entirety by the cautionary statements contained or referred to in this section. Readers should not place undue reliance on forward-looking statements. Additional factors that may affect future results are contained in Royal Dutch Shell’s 20-F for the year ended 31 December, 2013 (available at www.shell.com/investor and www.sec.gov ). These factors also should be considered by the reader. Each forward-looking statement speaks only as of the date of this presentation, 27 November, 2014. Neither Royal Dutch Shell nor any of its subsidiaries undertake any obligation to publicly update or revise any forward-looking statement as a result of new information, future events or other information. In light of these risks, results could differ materially from those stated, implied or inferred from the forward-looking statements contained in this presentation. There can be no assurance that dividend payments will match or exceed those set out in this presentation in the future, or that they will be made at all. We use certain terms in this presentation, such as discovery potential, that the United States Securities and Exchange Commission (SEC) guidelines strictly prohibit us from including in filings with the SEC. U.S. Investors are urged to consider closely the disclosure in our Form 20-F, File No 1-32575, available on the SEC website www.sec.gov. You can also obtain this form from the SEC by calling 1-800-SEC-0330.
  • 3. Copyright of Shell International B.V. OVERVIEW Success in the future depends not on the success of future decisions but on the future success of decisions taken today Introduction Shell’s scenario methodology From storyline to quantification 3
  • 4. Copyright of Shell International B.V. WHY DO WE USE SCENARIOS? Relevant to our business Develop or test strategies and plans Search for resilience Identify threats & opportunities and develop options Make risky decisions more transparent Focus on the ‘near future’, i.e. strategy & policy agenda next 1-3 years NOT on scenario horizon Ask “what if” questions, not necessarily give answers Challenge assumptions and mental models Enrich debate and identify ‘certainties’ ? 4
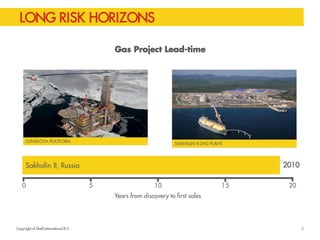
  • 5. Copyright of Shell International B.V. LONG RISK HORIZONS 0 5 10 15 20 Years from discovery to first sales Sakhalin II, Russia 2010 Gas Project Lead-time 5 SAKHALIN II LNG PLANT LUNSKOYA PLATFORM
  • 6. Copyright of Shell International B.V. OUR LEARNING TO DATE Scenarios can help generate vision and strategy Proper use requires ‘good’ scenarios and receptive organisation & culture All scenarios need to be ‘focused’, plausible, recognisable, challenging and consequential Must be underpinned by rigorous analysis and quantification Integrate into the strategy process for flexibility in the strategic plan Scenarios can be used for better project evaluation BUT Actual events often fall outside scenario range A good “forecast” now and then helps credibility Scenarios can be misused to justify bad judgement, strategy or timing DO NOT FORGET Communication, communication, communication … after 40 years we are still learning 6
  • 7. Copyright of Shell International B.V. SHELL’S SCENARIO METHODOLOGY
  • 8. Copyright of Shell International B.V. UNDERSTANDING THE INTERACTIONS Politics Environment Technology Society Economics 8
  • 9. Copyright of Shell International B.V. WHAT REALLY MATTERS? Outside the Box: Things that matter and that people in the business don’t know about Important/Impact Inside the Box: Things that matter and that people in the business know that matter Critical Issues 9
  • 10. Copyright of Shell International B.V. Surface implicit assumptions Drivers ELEMENTS OF SCENARIO BUILDING Dynamics Framework 1 2 3 4 Quantification  Pre-determined ? Uncertainties Frames of reference Scenarios relevant to decisions 10 Time Horizon Problematique Surface conflicts and dilemmas ? Dominant mental models
  • 11. Copyright of Shell International B.V. VARIETY OF METHODS Inductive Scenario 1 Scenario 2 Scenario 3 Official future Forecast Alternative scenario Incremental Normative Vision Scenario 1 Scenario 2 Scenario 3 Scenario 4 Deductive Uncertainty 1 Uncertainty 2 11
  • 12. Copyright of Shell International B.V. HOW FAR AHEAD DO WE SEE? Event/Problem focused Short term (2 years) Medium term (5-15 years) Long term (20 years) Very long term (50 years) Country/ business focused Business focused Issue focused (September 11th) Subprime crisis Deepwater Horizon (Your Company) (Mobility, Cities) (Energy systems) Global Scenarios Long Term Energy Scenarios Focussed Scenarios 12
  • 13. Copyright of Shell International B.V. FEATURES OF A GOOD SCENARIO Plausible Recognisable from signals in the present Internally consistent Challenging Consequential … stories describing paths to different futures Predictions Projections Preferences  X 13
  • 14. Copyright of Shell International B.V. SHELL’S WORLD ENERGY DEMAND MODEL TOTAL FINAL CONSUMPTION 100 100 YEARS COUNTRIES & REGIONS (INC. 82 COUNTRIES INDIVIDUALLY) 14 SECTORS 10 ENERGY CARRIERS 18 ENERGY SOURCES USA CONVERSION TECHNOLOGIES TOTAL PRIMARY ENERGY DEMAND ENERGY SUPPLY REST OF EUROPE WEST OTHER HEAVY INDUSTRY SOLID HYDROCARBON FUELS OIL CHINA REST OF EUROPE EAST OTHER AGRICULTURE & OTHER INDUSTRY LIQUID HYDROCARBON FUELS NATURAL GAS RUSSIA REST OF EU NEW 13 GASEOUS HYDROCARBON FUELS COAL SERVICES PASSENGER TRANSPORT – SHIP PASSENGER TRANSPORT – RAIL PASSENGER TRANSPORT – ROAD PASSENGER TRANSPORT – AIR FREIGHT TRANSPORT – SHIP FREIGHT TRANSPORT – RAIL FREIGHT TRANSPORT – ROAD FREIGHT TRANSPORT – AIR RESIDENTIAL – HEATING & COOKING RESIDENTIAL – LIGHTING & APPLIANCES NON ENERGY USE INDIA BALTIC STATES ELECTRICITY – COMMERCIAL NUCLEAR JAPAN REST OF CENTRAL ASIA ELECTRICITY – DISTRIBUTED SOLAR PV HYDRO-ELECTRICITY GERMANY REST OF EAST ASIA BIO-FUELS – 1ST GEN FRANCE REST OF SE ASIA BIO-FUELS – 2ND GEN UNITED KINGDOM REST OF MIDDLE EAST BIOMASS – TRADITIONAL CANADA REST OF SOUTH ASIA BIO-FUELS – MARINE REST OF NORTH AFRICA REST OF ARABIAN PENINSULA REST OF AFRICA OMAN REST OF SOUTHERN AFRICA REST OF NORTH AMERICA REST OF WEST AFRICA REST OF SOUTH AMERICA REST OF CENTRAL AMERICA & CARIBBEAN REST OF OCEANIA AZERBAIJAN PERU MOROCCO MOZAMBIQUE ANGOLA ECUADOR LUXEMBOURG YEMEN HYDROGEN HEAT – COMMERCIAL HEAT – DISTRIBUTED SOLAR THERMAL BIOMASS – COMMERCIAL BIOMASS – TRADITIONAL BIOMASS – COMMERCIAL WASTE GEOTHERMAL – HYDROTHERMAL GEOTHERMAL – ENGINEERED SOLAR – PHOTOVOLTAIC WIND TIDAL WAVE 14
  • 15. Copyright of Shell International B.V. SHELL’S OIL & GAS SUPPLY MODEL YET TO FINDS PRODUCTION DEVELOPED RESERVES UNDEVELOPED DISCOVERED VOLUMES 15
  • 16. Copyright of Shell International B.V. OIL 32% GAS 22% COAL 28% BIOMASS 10% NUCLEAR 5% RENEWABLES 3% FUELS 82% ELECTRICITY 18% RESIDENTIAL 24% INDUSTRY & SERVICES 50% TRANSPORT 26% Shell’s World Energy Model sees the global energy system as one integrated ‘balloon’, expanding and contracting with population and economic development. Developments in one part of the world or value chain will interact elsewhere, allowing competitive and policy forces to play out coherently throughout the system. TODAY’S ENERGY SYSTEM SETS THE CONTEXT FOR THE FUTURE 16
  • 17. Copyright of Shell International B.V. FROM STORYLINE TO QUANTIFICATION
  • 18. Copyright of Shell International B.V. SIX KEY DRIVERS OF THE ENERGY SYSTEM 18
  • 19. WE ARE ENTERING AN ERA OF VOLATILITY & TRANSITIONS Political & social instability Demographic transitions- urbanisation Emerging resources Shale gas & oil Challenged environmental boundaries Building a ‘mini-lateral’ world Intensified economic cycles 19
  • 20. MOUNTAINS A VIEW FROM THE TOP Concentration of power – elites drive policy Global economic growth moderates Nationalist world The Gas Backbone – the global shale revolution Nuclear renaissance Renewables sluggish ‘Clean’ energy: CCS takes off by 2030 1200 1000 800 600 400 200 0 EJ/yr 2000 2010 2020 2030 2040 2050 2060 World Total Primary Energy Oil Biofuels Natural Gas Biomass Gasified Coal Biomass/Waste Biomass Traditional Nuclear Hydro Geothermal Solar Wind 20 Social stability, the long view
  • 21. OCEANS A VIEW OF THE HORIZON World Total Primary Energy Rising aspirations drive people power Reform unleashes market forces and economic growth A fast adaptors, open borders world Energy supply struggles to keep pace with demand Unconventional gas proves disappointing outside of NA Rise of renewables A late ‘Green’ world Oil Biofuels Natural Gas Biomass Gasified Coal Biomass/Waste Biomass Traditional Nuclear Hydro Geothermal Solar Wind EJ/yr 1200 1000 800 600 400 200 0 2000 2010 2020 2030 2040 2050 2060 21 Churn, innovation, reform
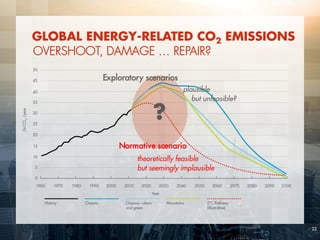
  • 22. 22 GLOBAL ENERGY-RELATED CO2 EMISSIONS ? Normative scenario theoretically feasible but seemingly implausible plausible but unfeasible? Exploratory scenarios OVERSHOOT, DAMAGE … REPAIR?
  • 23. 23 NATIONAL CONTRAST TOTAL PRIMARY ENERGY IN OCEANS USA China Oil Natural Gas Coal Nuclear Hydro-electricty Biofuels Biomass/Waste Biomass Traditional Geothermal Solar Wind Other Renewables 2000 2010 2020 2030 2040 2050 2060 0 20 40 60 80 100 120 140 160 180 200 EJ/Year (energy Source) 2000 2010 2020 2030 2040 2050 2060 0 20 40 60 80 100 120 140 160 180 200
  • 24. 24 SCENARIO CONTRAST WORLD PASSENGER TRANSPORT Mountains Oceans Combined with the impact of higher economic development, Oceans sprawling suburbs lead to higher travel needs than Mountains compact cities Electricity and Hydrogen Gaseous Hydrocarbon Fuels Liquid Hydrocarbon Fuels & Biofuels 2000 2010 2020 2030 2040 2050 2060 0 10,000 20,000 30,000 40,000 50,000 60,000 Billion vehicle km 2000 2010 2020 2030 2040 2050 2060 0 10,000 20,000 30,000 40,000 50,000 60,000
  • 25. 25 SCENARIO CONTRAST OPEC AND NON-OPEC PRODUCTION Mountains Oil, condensate & NGL production Oceans Oil, condensate & NGL production The effect of abundant gas and a slower growing global economy affect the call on OPEC in Mountains OPEC Non OPEC 0 10 20 30 40 50 60 2000 2010 2020 2030 2040 2050 2060 mboe / day 0 10 20 30 40 50 60 2000 2010 2020 2030 2040 2050 2060 mboe / day
  • 26. Copyright of Shell International B.V. Q & A
  • 27. Copyright of Shell International B.V. HOW DO SCENARIOS COMPARE WITH OTHERS’ OUTLOOKS?
  • 28. Copyright of Shell International B.V. Overall energy system balances on people’s needs, options, actions and reactions 0 200 400 600 800 1,000 1,200 2010 2015 2020 2025 2030 2035 2040 2045 2050 EJ / year Year Total Primary Energy - World - All Sources Mountains Oceans WEO14 CP WEO14 NP WEO14 450 EIA13 Ref EIA13 HighEG XOM 2014 BP 2014 FSB Energy External Scenario Comparison Tool v3.4
  • 29. Copyright of Shell International B.V. We envisage the possibility of a significant different pathway for oil use 0 50 100 150 200 250 300 2010 2015 2020 2025 2030 2035 2040 2045 2050 EJ / year Year Total Primary Energy - World - Oil & Biofuels Mountains Oceans WEO14 CP WEO14 NP WEO14 450 EIA13 Ref EIA13 HighEG XOM 2014 BP 2014 FSB Energy External Scenario Comparison Tool v3.4
  • 30. Copyright of Shell International B.V. Unconventional gas could make gas the dominant fuel in the 2030s … or perhaps not if fracking is opposed outside NA 0 50 100 150 200 250 2010 2015 2020 2025 2030 2035 2040 2045 2050 EJ / year Year Total Primary Energy - World - Gas Mountains Oceans WEO14 CP WEO14 NP WEO14 450 EIA13 Ref EIA13 HighEG XOM 2014 BP 2014 FSB Energy External Scenario Comparison Tool v3.4
  • 31. Copyright of Shell International B.V. Is coal still king in future …? 0 50 100 150 200 250 300 350 2010 2015 2020 2025 2030 2035 2040 2045 2050 EJ / year Year Total Primary Energy - World - Coal Mountains Oceans WEO14 CP WEO14 NP WEO14 450 EIA13 Ref EIA13 HighEG XOM 2014 BP 2014 FSB Energy External Scenario Comparison Tool v3.4
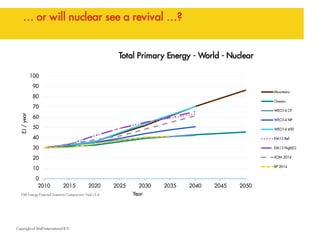
  • 32. Copyright of Shell International B.V. … or will nuclear see a revival …? 0 10 20 30 40 50 60 70 80 90 100 2010 2015 2020 2025 2030 2035 2040 2045 2050 EJ / year Year Total Primary Energy - World - Nuclear Mountains Oceans WEO14 CP WEO14 NP WEO14 450 EIA13 Ref EIA13 HighEG XOM 2014 BP 2014 FSB Energy External Scenario Comparison Tool v3.4
  • 33. Copyright of Shell International B.V. … or is the age of Renewables upon us? 0 50 100 150 200 250 300 2010 2015 2020 2025 2030 2035 2040 2045 2050 EJ / year Year Total Primary Energy - World - Renewables & Biomass Mountains Oceans WEO14 CP WEO14 NP WEO14 450 EIA13 Ref EIA13 HighEG XOM 2014 BP 2014 FSB Energy External Scenario Comparison Tool v3.4
  • 34. Copyright of Shell International B.V.