Location via proxy:   [ UP ]  
[Report a bug]   [Manage cookies]                
SlideShare a Scribd company logo
Earnings Conference Call
         Third Quarter Fiscal 2008
         August 1, 2008


Robert G. Bohn
Chairman and Chief Executive Officer

Charles L. Szews
President and Chief Operating Officer

David M. Sagehorn
Executive Vice President and Chief
Financial Officer

Patrick N. Davidson
Vice President of Investor Relations
Forward Looking Statements
    Our remarks that follow, including answers to your questions and these slides, include statements
    that we believe are “forward-looking statements” within the meaning of the Private Securities
    Litigation Reform Act of 1995. All statements other than statements of historical fact, including
    without limitation, statements regarding the Company’s future financial position, business strategy,
    targets, projected sales, costs, earnings, capital expenditures, debt levels and cash flows, and plans
    and objectives of management for future operations, are forward-looking statements. When used in
    this presentation, words such as “may,” “will,” “expect,” “intend,” “estimate,” “anticipate,” “believe,”
    “should,” “project” or “plan” or the negative thereof or variations thereon or similar terminology are
    generally intended to identify forward-looking statements. These forward-looking statements are
    not guarantees of future performance and are subject to risks, uncertainties, assumptions and other
    factors, some of which are beyond the Company’s control, which could cause actual results to differ
    materially from those expressed or implied by such forward-looking statements. These factors
    include the consequences of financial leverage associated with the JLG acquisition and the level of
    the Company’s associated borrowing costs; the cyclical nature of the Company’s access
    equipment, commercial and fire & emergency markets, especially during a recession, which many
    believe the U.S. has already entered; the Company’s ability to offset rising steel, fuel and other
    costs through other cost decreases or product selling price increases; the expected level and timing
    of U.S. Department of Defense procurement of products and services and funding thereof; risks
    related to reductions in government expenditures and the uncertainty of government contracts; risks
    associated with international operations and sales, including foreign currency fluctuations; risks
    related to the collectibility of access equipment receivables; the Company’s ability to turn around its
    Geesink business; and the potential for increased costs relating to compliance with changes in laws
    and regulations. Additional information concerning these and other factors and assumptions is
    contained in our filings with the SEC, including our Form 8-K filed August 1, 2008. Except as set
    forth in such Form 8-K, we disclaim any obligation to update such forward-looking statements.


2
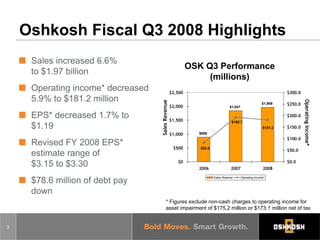
Oshkosh Fiscal Q3 2008 Highlights
     Sales increased 6.6%
                                                            OSK Q3 Performance
     to $1.97 billion
                                                                 (millions)
     Operating income* decreased                   $2,500                                                         $300.0
     5.9% to $181.2 million


                                                                                                                           Operating Income*
                                   Sales Revenue
                                                                                                                  $250.0
                                                                                                         $1,969
                                                   $2,000                        $1,847

     EPS* decreased 1.7% to                                                                                       $200.0
                                                   $1,500                          $192.7
     $1.19                                                                                                        $150.0
                                                                                                         $181.2
                                                   $1,000     $888
                                                                                                                  $100.0
     Revised FY 2008 EPS*                           $500       $82.6
                                                                                                                  $50.0
     estimate range of
                                                      $0                                                          $0.0
     $3.15 to $3.30                                           2006                2007                   2008

                                                                       Sales Revenue      Operating Income*
     $78.6 million of debt pay
     down
                                           * Figures exclude non-cash charges to operating income for
                                           asset impairment of $175.2 million or $173.1 million net of tax


3
Managing Proactively for
    Market Conditions
      Launched multiple cost reduction initiatives
       – Reducing operating expenses
       – Expanding global sourcing initiatives
      Aggressively raised pricing as previously announced
      Increasing focus on cash flow generation
       – Inventory reduction
      Continuing to invest in areas of growth


4
Access Equipment
                  Europe:
                   – Double-digit growth in Q3, even with
                     reduced outlook
                   – Mixed results expected in 2009
                  North America:
                   – IRC demand remained strong in Q3
                  Continuing to expand presence in
                  emerging markets
                  Adjusted production rates
                  New pricing effective October 1 to
                  address cost pressures

5
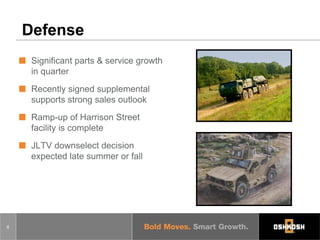
Defense
     Significant parts & service growth
     in quarter
     Recently signed supplemental
     supports strong sales outlook
     Ramp-up of Harrison Street
     facility is complete
     JLTV downselect decision
     expected late summer or fall


6
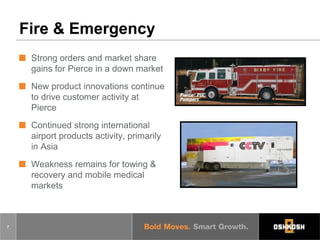
Fire & Emergency
     Strong orders and market share
     gains for Pierce in a down market
     New product innovations continue
     to drive customer activity at
     Pierce
     Continued strong international
     airport products activity, primarily
     in Asia
     Weakness remains for towing &
     recovery and mobile medical
     markets


7
Commercial
     Geesink Norba Group update:
      – Impairment charges of $175.2 million
        due to reduced outlook and higher
        operating costs as announced on
        June 26
      – New managing director reinvigorating
        team
      – Restructuring actions expected to yield
        improved performance
     U.S. concrete markets remain soft
     Domestic refuse collection product
     sales grew over prior year quarter in
     slightly down market


8
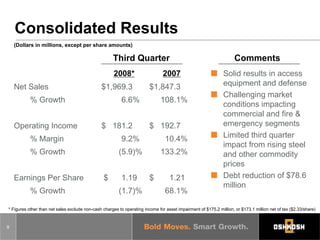
Consolidated Results
    (Dollars in millions, except per share amounts)

                                                     Third Quarter                                                  Comments
                                                      2008*                    2007                           Solid results in access
                                                                                                              equipment and defense
    Net Sales                                  $1,969.3                 $1,847.3
                                                                                                              Challenging market
           % Growth                                       6.6%                108.1%
                                                                                                              conditions impacting
                                                                                                              commercial and fire &
                                                                                                              emergency segments
    Operating Income                           $ 181.2                  $ 192.7
                                                                                                              Limited third quarter
           % Margin                                       9.2%                  10.4%
                                                                                                              impact from rising steel
           % Growth                                     (5.9)%                133.2%                          and other commodity
                                                                                                              prices
                                                                                                              Debt reduction of $78.6
    Earnings Per Share                          $         1.19          $         1.21
                                                                                                              million
           % Growth                                     (1.7)%                  68.1%

* Figures other than net sales exclude non-cash charges to operating income for asset impairment of $175.2 million, or $173.1 million net of tax ($2.33/share)


9
Access Equipment
     (Dollars in millions, except per share amounts)


                                                                        Comments
                                             Third Quarter
                                          2008           2007    Double-digit European
                                                                 sales growth vs. prior year
     Net Sales                         $920.2          $873.8
                                                                 Lower North American
         % Growth                            5.3%       NA
                                                                 performance driven by
                                                                 weak economy
     Operating Income                  $125.2          $ 98.3
                                                                 Improvement driven by:
         % Margin                          13.6%         11.3%    – Currency
                                                                  – Aftermarket parts & service
         % Growth                          27.3%        NA
                                                                  – Product mix
                                                                 Backlog down 51.7%
                                                                 vs. prior year


10
Defense
     (Dollars in millions, except per share amounts)


                                                                    Comments
                                             Third Quarter
                                         2008           2007     Strong performance
                                                                 from both parts &
     Net Sales                         $489.5          $376.3
                                                                 service and truck
        % Growth                           30.1%         29.1%
                                                                 deliveries
                                                                 Margin impacted by
     Operating Income                  $ 66.5          $ 65.3    product mix &
        % Margin                           13.6%         17.3%   development costs
        % Growth                            2.0%         33.1%   Backlog down 21.9%
                                                                 vs. prior year


11
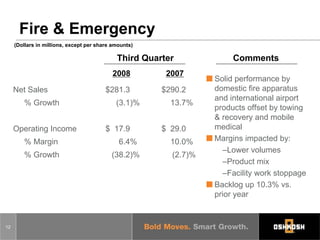
Fire & Emergency
     (Dollars in millions, except per share amounts)

                                             Third Quarter             Comments
                                           2008         2007
                                                                  Solid performance by
                                                                  domestic fire apparatus
     Net Sales                           $281.3        $290.2
                                                                  and international airport
        % Growth                             (3.1)%      13.7%
                                                                  products offset by towing
                                                                  & recovery and mobile
                                                                  medical
     Operating Income                    $ 17.9        $ 29.0
                                                                  Margins impacted by:
        % Margin                              6.4%       10.0%
                                                                    –Lower volumes
        % Growth                           (38.2)%       (2.7)%
                                                                    –Product mix
                                                                    –Facility work stoppage
                                                                  Backlog up 10.3% vs.
                                                                  prior year


12
Commercial
     (Dollars in millions, except per share amounts)

                                                                                                               Comments
                                                       Third Quarter
                                                                                                        Geesink inefficiencies
                                                   2008*                    2007
                                                                                                        and lower concrete
     Net Sales                                  $294.5                   $317.8
                                                                                                        mixer sales drove loss
        % Growth                                     (7.3)%                   (9.3)%
                                                                                                        Continued solid
                                                                                                        domestic refuse
     Operating Income                           $ (6.2)                  $ 17.8                         collection orders
        % Margin                                     (2.1)%                     5.6%                    Backlog up 11.6% vs.
                                                                                                        prior year
        % Growth                                (134.5)%                    (29.7)%


 * Figures other than net sales exclude non-cash charges to operating income for asset impairment of $175.2 million


13
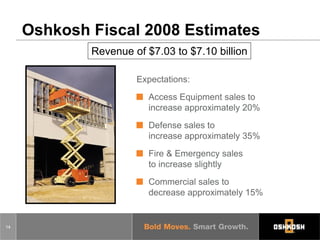
Oshkosh Fiscal 2008 Estimates
             Revenue of $7.03 to $7.10 billion

                      Expectations:
                         Access Equipment sales to
                         increase approximately 20%
                         Defense sales to
                         increase approximately 35%
                         Fire & Emergency sales
                         to increase slightly
                         Commercial sales to
                         decrease approximately 15%


14
Oshkosh Fiscal 2008 Estimates
                          Operating Income* of $560 to $575 million
                                                                          Expectations:
                                                                                Access Equipment margins to
                                                                                improve by 80 to 100 bps
                                                                                Defense margins to
                                                                                decline by 330 to 350 bps
                                                                                Fire & Emergency margins
                                                                                to decline by 150 to 170 bps
                                                                                Commercial operating loss*
                                                                                of 2.5% to 3.0% of sales
                                                                                Corporate expense to
                                                                                increase by approximately
                                                                                $20 million
 * Figures exclude non-cash charges to operating income for asset impairment of $175.2 million


15
Oshkosh Fiscal 2008 Estimates
                                                         Other Estimates
       Interest expense and other                                    Approximately $215 million (expense)
       Effective tax rate                                                                        34%*
       Equity in earnings                                                        $8.0 to $8.5 million (income)
       Average shares outstanding                                                         75 million


 * Figures exclude non-cash charges to operating income for asset impairment of $175.2 million


16
Oshkosh Fiscal 2008 Estimates

                                                                              FY08 EPS* estimate range
                                                                              of $3.15 to $3.30
                                                                              Q4 EPS estimate range
                                                                              of $0.50 to $0.65
                                                                              Capital spending expected to
                                                                              approximate $85 million
                                                                              Expect debt between $2.85 and
                                                                              $2.90 billion at fiscal year-end


     * Figures exclude non-cash charges for asset impairment of $2.31/share


17
Oshkosh Fiscal 2009 Comments
      Segment outlooks:
       – Defense
           Top line growth with modestly lower operating income margin
       – Fire & Emergency
           Steady performer with solid backlog
       – Commercial
           Recent restructuring actions expected to yield improved
           performance at Geesink
           Slightly improved outlook for concrete mixers and domestic
           refuse collection
       – Access Equipment
           Growth in select markets, but lower expected total revenue
      Driving cost reduction and resizing of operations
      Focus on cash flow

18
Appendix: Non-GAAP Financial Measures
                                                                                                                                      Fiscal 2008 Estim ates
     The tables below present reconciliations of the Company’s presented non-GAAP measures
                                                                                                                                      Low               High
     to the most directly comparable GAAP measures (in millions, except per share amounts):
                                                                                                                                      End               End


                                                             Three Months       Non-GAAP pre-tax incom e                          $         345    $            360
                                                                Ended           Intangible asset im pairm ent charges                      (175)               (175)
                                                             June 30, 2008      GAAP pre-tax incom e                              $         170    $            185

       Non-GAAP operating incom e                        $             181.2    Non-GAAP incom e tax expense                      $         118    $            122
       Intangible asset im pairm ent charges                          (175.2)   Incom e tax benefit associated w ith intangible
       GAAP operating incom e                            $               6.0     asset im pairm ent charges                                  (2)                  (2)
                                                                                GAAP incom e tax expense                          $         116    $            120
       Non-GAAP net incom e                              $              88.8
       Intangible asset im pairm ent charges                          (175.2)   Non-GAAP effective incom e tax rate                       34.0%                34.0%
       Incom e tax benefit assoicated w ith intangible                          GAAP effective incom e tax rate                           68.2%                64.9%
        asset im pairm ent charges                                       2.1
       GAAP net (loss) incom e                           $             (84.3)   Non-GAAP EPS                                      $        3.15    $           3.30
                                                                                Intangible asset im pairm ent charges per share           (2.31)               (2.31)
       Non-GAAP EPS                                      $              1.19    GAAP EPS                                          $        0.84    $           0.99
       Intangible asset im pairm ent charges per share                 (2.33)
       GAAP (loss) earnings per share                    $             (1.14)   Non-GAAP fiscal 2008 operating incom e            $         560    $            575
                                                                                Intangible asset im pairm ent charges                      (175)               (175)
       Non-GAAP com m ercial segm ent operating loss     $              (6.2)   GAAP fiscal 2008 operating incom e                $         385    $            400
       Intangible asset im pairm ent charges                          (175.2)
       GAAP com m ercial segm ent operating loss         $            (181.4)   Non-GAAP com m ercial segm ent
                                                                                 operating loss m argin                                   (3.0)%           (2.5)%
                                                                                Effect of intangible asset im pairm ent charges          (17.0)%          (16.0)%
                                                                                GAAP com m ercial segm ent
                                                                                 operating loss m argin                                  (20.0)%          (18.5)%


19

More Related Content

oshkosh Q308_Slides

  • 1. Earnings Conference Call Third Quarter Fiscal 2008 August 1, 2008 Robert G. Bohn Chairman and Chief Executive Officer Charles L. Szews President and Chief Operating Officer David M. Sagehorn Executive Vice President and Chief Financial Officer Patrick N. Davidson Vice President of Investor Relations
  • 2. Forward Looking Statements Our remarks that follow, including answers to your questions and these slides, include statements that we believe are “forward-looking statements” within the meaning of the Private Securities Litigation Reform Act of 1995. All statements other than statements of historical fact, including without limitation, statements regarding the Company’s future financial position, business strategy, targets, projected sales, costs, earnings, capital expenditures, debt levels and cash flows, and plans and objectives of management for future operations, are forward-looking statements. When used in this presentation, words such as “may,” “will,” “expect,” “intend,” “estimate,” “anticipate,” “believe,” “should,” “project” or “plan” or the negative thereof or variations thereon or similar terminology are generally intended to identify forward-looking statements. These forward-looking statements are not guarantees of future performance and are subject to risks, uncertainties, assumptions and other factors, some of which are beyond the Company’s control, which could cause actual results to differ materially from those expressed or implied by such forward-looking statements. These factors include the consequences of financial leverage associated with the JLG acquisition and the level of the Company’s associated borrowing costs; the cyclical nature of the Company’s access equipment, commercial and fire & emergency markets, especially during a recession, which many believe the U.S. has already entered; the Company’s ability to offset rising steel, fuel and other costs through other cost decreases or product selling price increases; the expected level and timing of U.S. Department of Defense procurement of products and services and funding thereof; risks related to reductions in government expenditures and the uncertainty of government contracts; risks associated with international operations and sales, including foreign currency fluctuations; risks related to the collectibility of access equipment receivables; the Company’s ability to turn around its Geesink business; and the potential for increased costs relating to compliance with changes in laws and regulations. Additional information concerning these and other factors and assumptions is contained in our filings with the SEC, including our Form 8-K filed August 1, 2008. Except as set forth in such Form 8-K, we disclaim any obligation to update such forward-looking statements. 2
  • 3. Oshkosh Fiscal Q3 2008 Highlights Sales increased 6.6% OSK Q3 Performance to $1.97 billion (millions) Operating income* decreased $2,500 $300.0 5.9% to $181.2 million Operating Income* Sales Revenue $250.0 $1,969 $2,000 $1,847 EPS* decreased 1.7% to $200.0 $1,500 $192.7 $1.19 $150.0 $181.2 $1,000 $888 $100.0 Revised FY 2008 EPS* $500 $82.6 $50.0 estimate range of $0 $0.0 $3.15 to $3.30 2006 2007 2008 Sales Revenue Operating Income* $78.6 million of debt pay down * Figures exclude non-cash charges to operating income for asset impairment of $175.2 million or $173.1 million net of tax 3
  • 4. Managing Proactively for Market Conditions Launched multiple cost reduction initiatives – Reducing operating expenses – Expanding global sourcing initiatives Aggressively raised pricing as previously announced Increasing focus on cash flow generation – Inventory reduction Continuing to invest in areas of growth 4
  • 5. Access Equipment Europe: – Double-digit growth in Q3, even with reduced outlook – Mixed results expected in 2009 North America: – IRC demand remained strong in Q3 Continuing to expand presence in emerging markets Adjusted production rates New pricing effective October 1 to address cost pressures 5
  • 6. Defense Significant parts & service growth in quarter Recently signed supplemental supports strong sales outlook Ramp-up of Harrison Street facility is complete JLTV downselect decision expected late summer or fall 6
  • 7. Fire & Emergency Strong orders and market share gains for Pierce in a down market New product innovations continue to drive customer activity at Pierce Continued strong international airport products activity, primarily in Asia Weakness remains for towing & recovery and mobile medical markets 7
  • 8. Commercial Geesink Norba Group update: – Impairment charges of $175.2 million due to reduced outlook and higher operating costs as announced on June 26 – New managing director reinvigorating team – Restructuring actions expected to yield improved performance U.S. concrete markets remain soft Domestic refuse collection product sales grew over prior year quarter in slightly down market 8
  • 9. Consolidated Results (Dollars in millions, except per share amounts) Third Quarter Comments 2008* 2007 Solid results in access equipment and defense Net Sales $1,969.3 $1,847.3 Challenging market % Growth 6.6% 108.1% conditions impacting commercial and fire & emergency segments Operating Income $ 181.2 $ 192.7 Limited third quarter % Margin 9.2% 10.4% impact from rising steel % Growth (5.9)% 133.2% and other commodity prices Debt reduction of $78.6 Earnings Per Share $ 1.19 $ 1.21 million % Growth (1.7)% 68.1% * Figures other than net sales exclude non-cash charges to operating income for asset impairment of $175.2 million, or $173.1 million net of tax ($2.33/share) 9
  • 10. Access Equipment (Dollars in millions, except per share amounts) Comments Third Quarter 2008 2007 Double-digit European sales growth vs. prior year Net Sales $920.2 $873.8 Lower North American % Growth 5.3% NA performance driven by weak economy Operating Income $125.2 $ 98.3 Improvement driven by: % Margin 13.6% 11.3% – Currency – Aftermarket parts & service % Growth 27.3% NA – Product mix Backlog down 51.7% vs. prior year 10
  • 11. Defense (Dollars in millions, except per share amounts) Comments Third Quarter 2008 2007 Strong performance from both parts & Net Sales $489.5 $376.3 service and truck % Growth 30.1% 29.1% deliveries Margin impacted by Operating Income $ 66.5 $ 65.3 product mix & % Margin 13.6% 17.3% development costs % Growth 2.0% 33.1% Backlog down 21.9% vs. prior year 11
  • 12. Fire & Emergency (Dollars in millions, except per share amounts) Third Quarter Comments 2008 2007 Solid performance by domestic fire apparatus Net Sales $281.3 $290.2 and international airport % Growth (3.1)% 13.7% products offset by towing & recovery and mobile medical Operating Income $ 17.9 $ 29.0 Margins impacted by: % Margin 6.4% 10.0% –Lower volumes % Growth (38.2)% (2.7)% –Product mix –Facility work stoppage Backlog up 10.3% vs. prior year 12
  • 13. Commercial (Dollars in millions, except per share amounts) Comments Third Quarter Geesink inefficiencies 2008* 2007 and lower concrete Net Sales $294.5 $317.8 mixer sales drove loss % Growth (7.3)% (9.3)% Continued solid domestic refuse Operating Income $ (6.2) $ 17.8 collection orders % Margin (2.1)% 5.6% Backlog up 11.6% vs. prior year % Growth (134.5)% (29.7)% * Figures other than net sales exclude non-cash charges to operating income for asset impairment of $175.2 million 13
  • 14. Oshkosh Fiscal 2008 Estimates Revenue of $7.03 to $7.10 billion Expectations: Access Equipment sales to increase approximately 20% Defense sales to increase approximately 35% Fire & Emergency sales to increase slightly Commercial sales to decrease approximately 15% 14
  • 15. Oshkosh Fiscal 2008 Estimates Operating Income* of $560 to $575 million Expectations: Access Equipment margins to improve by 80 to 100 bps Defense margins to decline by 330 to 350 bps Fire & Emergency margins to decline by 150 to 170 bps Commercial operating loss* of 2.5% to 3.0% of sales Corporate expense to increase by approximately $20 million * Figures exclude non-cash charges to operating income for asset impairment of $175.2 million 15
  • 16. Oshkosh Fiscal 2008 Estimates Other Estimates Interest expense and other Approximately $215 million (expense) Effective tax rate 34%* Equity in earnings $8.0 to $8.5 million (income) Average shares outstanding 75 million * Figures exclude non-cash charges to operating income for asset impairment of $175.2 million 16
  • 17. Oshkosh Fiscal 2008 Estimates FY08 EPS* estimate range of $3.15 to $3.30 Q4 EPS estimate range of $0.50 to $0.65 Capital spending expected to approximate $85 million Expect debt between $2.85 and $2.90 billion at fiscal year-end * Figures exclude non-cash charges for asset impairment of $2.31/share 17
  • 18. Oshkosh Fiscal 2009 Comments Segment outlooks: – Defense Top line growth with modestly lower operating income margin – Fire & Emergency Steady performer with solid backlog – Commercial Recent restructuring actions expected to yield improved performance at Geesink Slightly improved outlook for concrete mixers and domestic refuse collection – Access Equipment Growth in select markets, but lower expected total revenue Driving cost reduction and resizing of operations Focus on cash flow 18
  • 19. Appendix: Non-GAAP Financial Measures Fiscal 2008 Estim ates The tables below present reconciliations of the Company’s presented non-GAAP measures Low High to the most directly comparable GAAP measures (in millions, except per share amounts): End End Three Months Non-GAAP pre-tax incom e $ 345 $ 360 Ended Intangible asset im pairm ent charges (175) (175) June 30, 2008 GAAP pre-tax incom e $ 170 $ 185 Non-GAAP operating incom e $ 181.2 Non-GAAP incom e tax expense $ 118 $ 122 Intangible asset im pairm ent charges (175.2) Incom e tax benefit associated w ith intangible GAAP operating incom e $ 6.0 asset im pairm ent charges (2) (2) GAAP incom e tax expense $ 116 $ 120 Non-GAAP net incom e $ 88.8 Intangible asset im pairm ent charges (175.2) Non-GAAP effective incom e tax rate 34.0% 34.0% Incom e tax benefit assoicated w ith intangible GAAP effective incom e tax rate 68.2% 64.9% asset im pairm ent charges 2.1 GAAP net (loss) incom e $ (84.3) Non-GAAP EPS $ 3.15 $ 3.30 Intangible asset im pairm ent charges per share (2.31) (2.31) Non-GAAP EPS $ 1.19 GAAP EPS $ 0.84 $ 0.99 Intangible asset im pairm ent charges per share (2.33) GAAP (loss) earnings per share $ (1.14) Non-GAAP fiscal 2008 operating incom e $ 560 $ 575 Intangible asset im pairm ent charges (175) (175) Non-GAAP com m ercial segm ent operating loss $ (6.2) GAAP fiscal 2008 operating incom e $ 385 $ 400 Intangible asset im pairm ent charges (175.2) GAAP com m ercial segm ent operating loss $ (181.4) Non-GAAP com m ercial segm ent operating loss m argin (3.0)% (2.5)% Effect of intangible asset im pairm ent charges (17.0)% (16.0)% GAAP com m ercial segm ent operating loss m argin (20.0)% (18.5)% 19