


Parcel Delivery - Intel Segmentation and Last Mile Opt.pptx
- 1. Copyright © SAS Institute Inc. All rights reserved. Lojistikte SAS
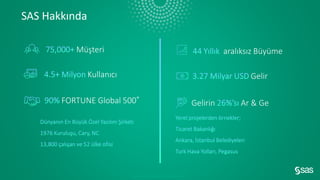
- 2. Copyright © SAS Institute Inc. All rights reserved. Müşteri Kullanıcı FORTUNE Global 500® aralıksız Büyüme Gelir Gelirin Ar & Ge SAS Hakkında
- 3. Copyright © SAS Institute Inc. All rights reserved. Computer Vision Forecasting and Optimization Machine Learning, Deep Learning Natural Language Processing Data Management Visualization Decision Management Deployment AI Türkçe Mevcut ORACLE, SAP Entegrasyonu Mevcut Robotik Proses Otomasyonu ve Karar Motorları ile Entegre SAS ML ve AI Yetkinlikleri AutoML dahil AutoForecasting ve hiyerarşik tahminleme dahil
- 4. Copyright © SAS Institute Inc. All rights reserved. COVID Döneminde Bir Örnek Uygulama Intelligent Segmentation and Last Mile Optimization
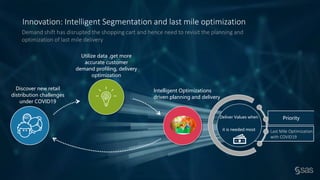
- 5. Copyright © SAS Institute Inc. All rights reserved. Innovation: Intelligent Segmentation and last mile optimization Demand shift has disrupted the shopping cart and hence need to revisit the planning and optimization of last mile delivery Priority Deliver Values when it is needed most Last Mile Optimization with COVID19 Utilize data ,get more accurate customer demand profiling, delivery optimization Discover new retail distribution challenges under COVID19 Intelligent Optimizations driven planning and delivery
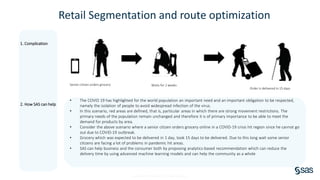
- 6. Copyright © SAS Institute Inc. All rights reserved. Retail Segmentation and route optimization Senior citizen orders grocery Waits for 2 weeks Order is delivered in 15 days 1. Complication 2. How SAS can help • The COVID 19 has highlighted for the world population an important need and an important obligation to be respected, namely the isolation of people to avoid widespread infection of the virus. • In this scenario, red areas are defined, that is, particular areas in which there are strong movement restrictions. The primary needs of the population remain unchanged and therefore it is of primary importance to be able to meet the demand for products by area. • Consider the above scenario where a senior citizen orders grocery online in a COVID-19 crisis hit region since he cannot go out due to COVID-19 outbreak. • Grocery which was expected to be delivered in 1 day, took 15 days to be delivered. Due to this long wait some senior citizens are facing a lot of problems in pandemic hit areas. • SAS can help business and the consumer both by proposing analytics-based recommendation which can reduce the delivery time by using advanced machine learning models and can help the community as a whole
- 7. Copyright © SAS Institute Inc. All rights reserved. Retail Segmentation and Route Optimization Segment the product order into various segments using priority rules and machine learning algorithm- based segmentation. Optimization algorithm can be used to optimize the product delivery and answer some of the possible solutions to deliver product: • What products should be delivered to customer address. • What all products can be delivered to a common pit stop where someone from customer’s family can picked up the order. • What is the most optimized route to be followed for a group of orders. Order would be bifurcated into red areas where there is a strong movement restriction and non red areas order in terms of priority. Products would be delivered into low and high priority products. For example, order received from senior citizen would have high priority. Products which require food with particular food intolerance/allergies like lactose, gluten etc would be given a higher priority. Applying machine learning algorithm-based segmentation we can segment the products into different product bundles, each having a specific priority over others. SAS Optimize engine would be used to further optimize the product bundle to be delivered and the route to be followed. The route would be optimized such that maximum population can be covered with the products. Challenge Approach Results Data • Location Data • Customer Data • Order Data • Store Data • Product Data • Inventory Data • Delivery availability data What are the products to be delivered in red areas? What are the product bundles as per different priority to be delivered? What is the best optimized route to be followed to deliver these products?
- 8. Copyright © SAS Institute Inc. All rights reserved. No Data type Data description 1 Location Data Information of street, city, province, postal code, etc. of the customer 2 Customer Data Customer name, age, family size, other person if available to pick up the grocery, food allergies, etc. 3 Order Data Name, description, quantity, etc. 4 Stores hierarchy and their attributes Id, name, description, address, coordinates, opening date, closing (or reconstruction) date, working hours, format, square, regulatory restrictions (e.g. no alcohol in store, no tobacco in store), etc. 5 Products hierarchy and their attributes Id, name, description, merchandise hierarchy, attributes 6 Planned assortment + assortment history Planned assortment for the period of analysis (including test sales dates) Level: SKU-store-day 7 Planogram history POGs data: store, SKU, number of facings, length of facings, etc Different Types Of Data Useful For Analysis
- 9. Copyright © SAS Institute Inc. All rights reserved. Modeling Approach and Benefits • Catering the need of people affected in COVID-19 especially senior citizens. • Optimizing the priority of order that needs to be delivered. • Optimizing and prioritizing between perishable and nonperishable goods. • Optimizing the delivery for retail store so that they can cater maximum population in optimized cost and time. • Using analytics-based decision making with increased efficiency. • Clean the data and prepare modeling dataset Data
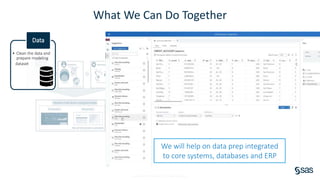
- 10. Copyright © SAS Institute Inc. All rights reserved. What We Can Do Together • Clean the data and prepare modeling dataset Data We will help on data prep integrated to core systems, databases and ERP
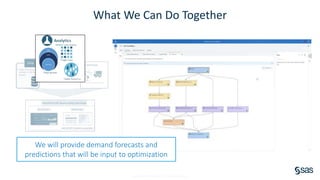
- 11. Copyright © SAS Institute Inc. All rights reserved. What We Can Do Together We will provide demand forecasts and predictions that will be input to optimization
- 12. Copyright © SAS Institute Inc. All rights reserved. What We Can Do Together Interactive analysis of Optimization results for multiple scenarios will be shared on Desktop and mobile
- 13. Copyright © SAS Institute Inc. All rights reserved. What We Can Do Together We will have all results, optimized routes, alternate scenarios, last mile delivery status and ETA’s in dashboards for management and for vendors, as well as clients
- 14. Copyright © SAS Institute Inc. All rights reserved. Bir Diğer Örnek Uygulama Price Optimization For Trucking
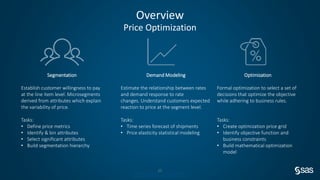
- 15. Company Confidential – For Internal Use Only Copyright © SAS Institute Inc. All rights reserved. Overview Price Optimization Segmentation Establish customer willingness to pay at the line item level. Microsegments derived from attributes which explain the variability of price. Tasks: • Define price metrics • Identify & bin attributes • Select significant attributes • Build segmentation hierarchy Demand Modeling Estimate the relationship between rates and demand response to rate changes. Understand customers expected reaction to price at the segment level. Tasks: • Time series forecast of shipments • Price elasticity statistical modeling Optimization Formal optimization to select a set of decisions that optimize the objective while adhering to business rules. Tasks: • Create optimization price grid • Identify objective function and business constraints • Build mathematical optimization model 15
- 16. Copyright © SAS Institute Inc. All rights reserved. SAS Price Optimization for Trucking Different User Roles Revenue Operator • Protect & Improve Profitability • Develop Segmentation Models • Create Peer Group Analysis with Floor & Ceiling Price Levels • Manage GRI & MPC Pricing Manager • Oversee Account Activity & Performance • Create and Monitor Performance Alerts • View Peer Group Analysis and Select Target Price Account Manager • Sales volume oriented • Monitor Performance Alerts • Customer Service • Marketing, campaigns
- 17. Copyright © SAS Institute Inc. All rights reserved. Copyright © SAS Institute Inc. All rights reserved. Demonstration • Existing Customer Quote (example) View most frequent Customer Behavior by Core Service Select customer Segmentation Criteria View Floor-Target-Ceiling prices within Peer Group
- 18. Copyright © SAS Institute Inc. All rights reserved. Select Core Service – based on Transaction Count by Core Service frequency 18
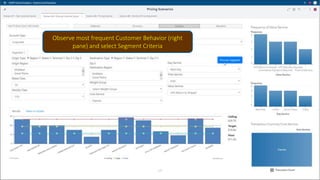
- 19. Copyright © SAS Institute Inc. All rights reserved. Observe most frequent Customer Behavior (right pane) and select Segment Criteria 19
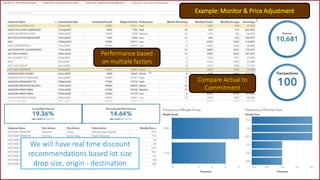
- 20. Copyright © SAS Institute Inc. All rights reserved. Example: Monitor & Price Adjustment Compare Actual to Commitment Performance based on multiple factors We will have real time discount recommendations based lot size drop size, origin - destination
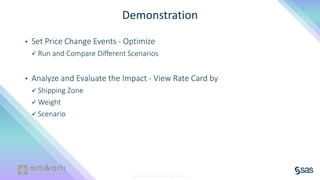
- 21. Copyright © SAS Institute Inc. All rights reserved. Copyright © SAS Institute Inc. All rights reserved. Demonstration • Set Price Change Events - Optimize Run and Compare Different Scenarios • Analyze and Evaluate the Impact - View Rate Card by Shipping Zone Weight Scenario
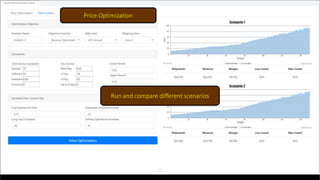
- 22. Copyright © SAS Institute Inc. All rights reserved. Price Optimization Run and compare different scenarios 22
- 23. Copyright © SAS Institute Inc. All rights reserved. Price Optimization View Rate Card by Shipping Zone and/or Weight and/or Scenario 23
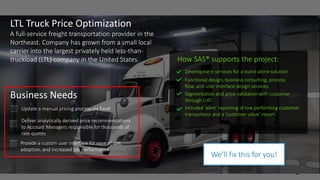
- 24. Copyright © SAS Institute Inc. All rights reserved. A full-service freight transportation provider in the Northeast. Company has grown from a small local carrier into the largest privately held less-than- truckload (LTL) company in the United States. LTL Truck Price Optimization Business Needs Update a manual pricing process via Excel Deliver analytically derived price recommendations to Account Managers responsible for thousands of rate quotes Provide a custom user interface for ease of use, adoption, and increased job performance How SAS® supports the project: Development services for a stand-alone solution. Functional design, business consulting, process flow, and user interface design services. Segmentation and price validation with customer through UAT. Included ‘alert’ reporting of low performing customer transactions and a ‘customer value’ report. We’ll fix this for you!
- 25. Copyright © SAS Institute Inc. All rights reserved. SAS Referansları
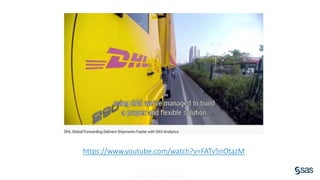
- 26. Copyright © SAS Institute Inc. All rights reserved. https://www.youtube.com/watch?v=FATv5nOtazM
- 27. Copyright © SAS Institute Inc. All rights reserved. https://www.sas.com/en_us/insights/articles/analytics/ups-loves-logistics.html
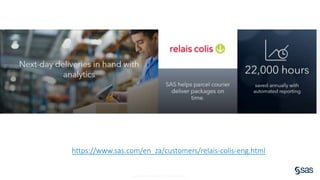
- 28. Copyright © SAS Institute Inc. All rights reserved. https://www.sas.com/en_za/customers/relais-colis-eng.html
- 29. Copyright © SAS Institute Inc. All rights reserved. 3 Hızlı Kazanım Önerisi
- 30. Copyright © SAS Institute Inc. All rights reserved. Kargo Analitik Akademisi Veri analitiği yazılım ve çözümlerine ilişkin eğitimler ve PoC çalışmaları SAS Master Data Management ve Data Quality Çözümleri Veri kalitesi çözümleri ve Veri kataloglama yaklaşımlarımızı sunacağız SAS Unified Insights Teklifi Veri analitiği platfromu çözümleri Şirketinize en uygun paket
- 31. sas.com Copyright © SAS Institute Inc. All rights reserved. Teşekkürler Altan.atabarut@sas.com
Editor's Notes
- SAS is the largest private software company Solely works on data analytics, machine learning and AI Invests a big portion of the revenues to R&D and has roughly 3000 PhD’s on board.
- We talked about the need to take a holistic approach to AI. This is one of the reasons why SAS has been so successful, we don’t just offer visualization, we don’t just offer machine learning, but we help organizations achieve their business goals through practical applications of AI and analytics in concert. Starting the journey with the right data management and visualization capabilities. No matter what your data type from images, to text, to more structured data, a successful implementation will require data capabilities for the next phase. The Discovery phase of AI is where you can apply a broad range of advanced AI techniques to gain insight, for example: Machine Learning and deep learning enables us to find complex patterns in data that are not evident to us. One of SAS customers; Rogers Communication used machine learning and reduced customer complaints by 53% Computer Vision is the ability to recognize objects, and SAS is helping customers in manufacturing, in security with Computer Vision. WildTrack is a SAS partner who is using Computer Vision to identify animals in the wild using nothing but the tracks they make, so just by analyzing the image of the paw, we are able to determine what the species is, and a whole host of other information using computer vision. Natural Language is really the future of how we will communicate with AI. In fact, already today you can speak to Visual Analytics app on your smartphone, and you can ask for reports in a way that is natural and does not require specialized skill. And even in very well understood analytics techniques such as forecasting and optimization, we are using machine learning to get better results and save our clients money and resources. Finally, to gain the real business value, you would deploy the models to production in a way that accounts for your business processes and constraints SAS offers the Analytics and AI lifecycle with the right tools that help you from data to discovery to deployment all on the unifying SAS Platform.
- LTL Carriers are mostly at the Segmentation stage. Customers blindly trust PROs for Demand Modeling and Optimization but it is a black box model that is forced. Based on the force-fit they create a vision to senior management that past decisions have left a lot of money on the table. This is based on a price elasticity model with few data points and a huge margin of error. (reference: Bob Obee)
- Per Bob Obee – this is unique to UPS – not typical in LTL, who are not this advanced with how they manage rates. However, related to pricing, LTL can be more complex than parcel package or truckload. SAS has a FLEXIBLE approach that can adapt to the customer’s style and culture. Revenue and Pricing Manager are incented by Profitability vs. Account Manager incented by sales volume.
- Account Manager
- Revenue Operator user
- Rich to add Value Impact. Increase pricing by ½ % has a huge impact on the bottom line – Top Line impact vs. Cost Cutting.
- Rich to add Value Impact. Increase pricing by ½ % has a huge impact on the bottom line – Top Line impact vs. Cost Cutting.
- Rich to add Value Impact. Increase pricing by ½ % has a huge impact on the bottom line – Top Line impact vs. Cost Cutting.
- Rich to add Value Impact. Increase pricing by ½ % has a huge impact on the bottom line – Top Line impact vs. Cost Cutting.
- Revenue Operator user