Introduction to .NET Performance Measurement
•
2 likes•6,619 views

A two hour talk on performance measurement tools for .NET applications, including performance counters, Visual Studio profiler, and ETW with PerfView.
Report
Share


Introduction to .NET Performance Measurement
- 1. © Copyright SELA software & Education Labs Ltd. 14-18 Baruch Hirsch St.Bnei Brak 51202 Israel www.sela.co.il
- 2. • Execution time – CPU time, wall-clock time, kernel time vs. user time • I/O requests – Number of disk operations, number of bytes transferred across the wire, number of files accessed • Database access – Sessions opened, transactions committed, grouping of execution time by SQL statement • OS and hardware – System calls, page faults, cache misses, TLB misses
- 3. • A set of numeric data exposed by Windows or by individual applications that can be sampled programmatically – Organized hierarchically into Categories, Instances, and Counters • Accessed using System.Diagnostics: – PerformanceCounter, PerformanceCounterCategory – Can expose your own counters as well • Read with the built-in Performance Monitor MMC snap-in (perfmon.exe)
- 5. • Supports managed and unmanaged code – Part of Visual Studio 2010/2012 Premium/Ultimate – Can be run stand-alone from the command-line • Operation modes: Sampling •CPU-bound apps, very low overhead •Full program stacks (including all system DLLs) •Tier interactions Instrumentation •I/O-bound apps, CPU-bound apps, higher overhead •More detailed timing data, limited stacks (just my code) Allocations •Details on who allocated and what •Managed code only Concurrency
- 6. • Periodically interrupt the application – Timer (default = 10,000,000 clock cycles) – Page faults – System calls – CPU performance counters (cache misses, branch mispredictions, etc.) • Walk the application’s stack – Record the frames, no symbol resolution yet – Very fast, small intrusion, little effect on profiled app
- 7. • Exclusive samples – Function was on the top of the stack – Function is doing a lot of individual work • Inclusive samples – Function was on the stack (but not the top) – Function causes a lot of work to be done Bar Foo Main Top +1 Inc +1 Exc +1 Inc +1 Inc
- 9. • Samples ≠ Time – Blocked functions don’t get samples – There may be statistical errors (an “evasive” function that never shows up during a sample) • Very long runs are not necessary – Long runs = more noise = less clarity • Make sure you have debugging symbols – Use the Microsoft symbol server, http://msdl.microsoft.com/download/symbols
- 10. • The profiler instruments the binary before it’s launched – Emits markers that record function execution times and counts – In other profilers, can work at the line-level as well – but very expensive void foo() { FUNC_ENTER(foo); // do some work CALL_ENTER(ExtCall); // call another function ExtCall(); CALL_EXIT(ExtCall); // do some more work FUNC_EXIT(foo); }
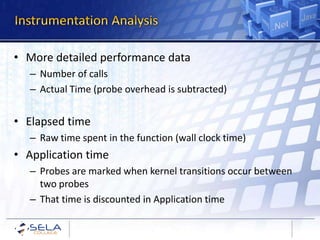
- 11. • More detailed performance data – Number of calls – Actual Time (probe overhead is subtracted) • Elapsed time – Raw time spent in the function (wall clock time) • Application time – Probes are marked when kernel transitions occur between two probes – That time is discounted in Application time
- 12. • Memory allocations incur a significant cost – The allocations are cheap, but the GC isn’t! – You won’t always see the cost at the source, because the allocating function runs quickly • Profiling an application for excessive allocations may be more important than CPU time – Another aspect is diagnosing memory leaks or sources of excess memory consumption
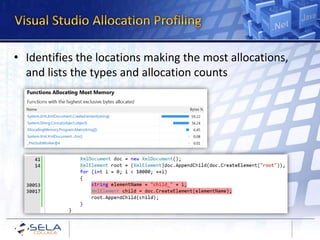
- 13. • Identifies the locations making the most allocations, and lists the types and allocation counts
- 14. • Analyze the application’s concurrency characteristics – CPU utilization – are all CPU cores active? – Thread migration between cores – Thread blocking patterns – why are threads blocked/unblocked, preempted, executing? – Resource contention – which threads are competing for the same resources? • In-depth analysis is very difficult – lots of information in a very short time
- 15. • Common Patterns for Poorly-Behaved Multithreaded Applications http://msdn.microsoft.com/en-us/library/ee329530.aspx
- 16. • To get a quick result, an idea of where to focus • To analyze sources of cache misses, page faults, and other environmental factors • To profile a running process (e.g. Web server) that can’t be restarted easily Sampling • To get more accurate results, function call counts • To get wall-clock time information including block and wait timesInstrumentation • To get a general idea of CPU utilization and thread migration • To understand why threads are blocked and unblockedConcurrency
- 17. • xperf.exe: Command-line tool for ETW capturing and processing • xperfview.exe: Visual trace analysis tool • xbootmgr.exe: On/off transition state capture tool • PerfView.exe: ETW capture tool for managed apps • Works on Windows Vista SP1 and above
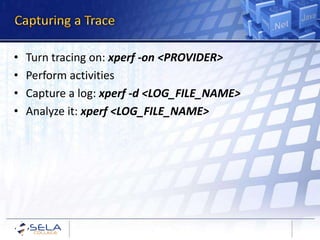
- 18. • Turn tracing on: xperf -on <PROVIDER> • Perform activities • Capture a log: xperf -d <LOG_FILE_NAME> • Analyze it: xperf <LOG_FILE_NAME>
- 19. Performance Counters Visual Studio Profiler Event Tracing for Windows