Petrobras at Glance
•
1 like•1,094 views

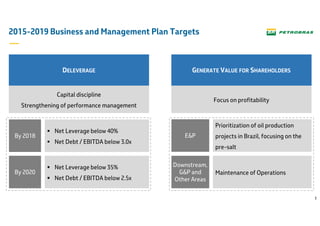
- Petrobras provides an update and adjustments to its 2015-2019 Business and Management Plan. - Key targets include reducing net debt, lowering net leverage below 40% by 2018 and 35% by 2020, prioritizing oil production in Brazil with a focus on pre-salt layers, and generating value for shareholders through capital discipline. - Investments are reduced by 37% compared to the previous plan, with most funds going to exploration and production, particularly in pre-salt areas of Brazil. Production is expected to increase through new offshore systems coming online over the next few years.
Report
Share


Petrobras at Glance
- 2. DISCLAIMER FORWARD-LOOKING STATEMENTS: DISCLAIMER The presentation may contain forward-looking statements about future events within the meaning of Section 27A of the Securities Act of 1933, as amended, and Section 21E of the Securities Exchange Act of 1934, as amended, that are not based on historical facts and are not assurances of future results. Such forward-looking statements merely reflect the Company’s current views and estimates of future economic circumstances, industry conditions, company performance and financial results. Such terms as "anticipate", "believe", "expect", "forecast", "intend", "plan", "project", "seek", "should", along with similar or analogous expressions, are used to identify such forward-looking statements. Readers are cautioned that these statements are only projections and may differ materially from actual future results or events. Readers are referred to the documents filed by the Company with the SEC, specifically the Company’s most recent Annual Report on Form 20-F, which identify important risk factors that could cause actual results to differ from those contained in the forward-looking statements, including, among other things, risks relating to general economic and business conditions, including crude oil and other commodity prices, refining margins and prevailing exchange rates, uncertainties inherent in making estimates of our oil and gas reserves including recently discovered oil and gas reserves, international and Brazilian political, economic and social developments, receipt of governmental approvals and licenses and our ability to obtain financing. We undertake no obligation to publicly update or revise any forward-looking statements, whether as a result of new information or future events or for any other reason. Figures for 2014 on are estimates or targets. All forward-looking statements are expressly qualified in their entirety by this cautionary statement, and you should not place reliance on any forward-looking statement contained in this presentation. NON-SEC COMPLIANT OIL AND GAS RESERVES: CAUTIONARY STATEMENT FOR US INVESTORS We present certain data in this presentation, such as oil and gas resources, that we are not permitted to present in documents filed with the United States Securities and Exchange Commission (SEC) under new Subpart 1200 to Regulation S-K because such terms do not qualify as proved, probable or possible reserves under Rule 4-10(a) of Regulation S-X.
- 3. 3 2015-2019 Business and Management Plan Targets DELEVERAGE GENERATE VALUE FOR SHAREHOLDERS Focus on profitability Capital discipline Strengthening of performance management Net Leverage below 40% Net Debt / EBITDA below 3.0x By 2018 By 2020 Net Leverage below 35% Net Debt / EBITDA below 2.5x Prioritization of oil production projects in Brazil, focusing on the pre-salt E&P Downstream, G&P and Other Areas Maintenance of Operations
- 4. 4 Financial Planning Assumptions Import parity Oil Product Prices in Brazil Preço do Brent US$ 54/bbl in 2015 US$ 55/bbl in 2016 Under revision for 2017 on Brent Prices (Average) Nominal Exchange Rate (Average) R$/US$ 2015 3.28 2016 3.80 2017-2020 Under Revision No equity issuance
- 5. 5 Divestments and Restructurings US$ 42.6 billion as follows: Businesses restructurings Demobilization of assets Additional divestments Divestments revised to US$ 15.1 billion2015-2016 2017-2018
- 6. 6 Manageable Operating Costs Total costs and expenses, excluding costs related to basic materials 2015-2019 BMP US$ 142 Billion 12.4 (9%) 14.0 (10%) 45.8 (32%) 69.8 (49%) Other Areas E&P G&P Downstream Efficiency in the management of contracted services Rationalization of structures and reorganization of businesses Optimization of personnel costs Reduction in the costs of inputs acquisition Reduction in the transportation costs Measures for productivity gains
- 7. 7 Investments Reduction of 37% relative to 2014-2018 BMP * Considers only financiability portfolio (implementation + under bidding process) ** Includes Petrobras investments abroad *** Includes Distribution 6.3 (5%) 12.8 (10%) 2.6 (2%) 108.6 (83%) Exploration and Production** Gas & Power Downstream*** Other Areas 2015-2019 BMP US$ 130.3 Billion 3,2 (2%) 158,1 (76%) 9,1 (4%) 36,4 (18%) 2014-2018 BMP* US$ 206.8 Billion Redução de 37% 3,2 (2%) 158,1 (76%) 9,1 (4%) 36,4 (18%) 37% Reduction
- 8. 8 Investments By Segment 89.4 (82%) 3.0 (3%) 11.3 (10%) 4.9 (5%) Operational Support Investments Abroad Exploration Production Development E&P US$ 108.6 Billion 1.3 (10%) 1.4 (11%) 8.8 (69%) 1.3 (10%) Others Abreu e Lima Refinery Distribution (BR Distribuidora) Maintenance and Infrastructure Downstream US$ 12.8 Billion (1%) 5.0 (80%) 0.3 (5%)0.9 (14%) LNG Pipelines Gas Chemical Units Electricity G&P US$ 6.3 Billion Note: Downstream total amount includes investments in Comperj to receive and treat natural gas, maintenance of equipment, among others.
- 9. 9 Bunsiness and Management Plan 2015-2019 Adjustments 27 28 19 25 20162015 -10.7% -29.6% UpdateBMP 2015-2019 27 30 21 29 20162015 -22.2% -3.3% CAPEX (US$ Billion) Manageable Operating Costs (US$ Billion)
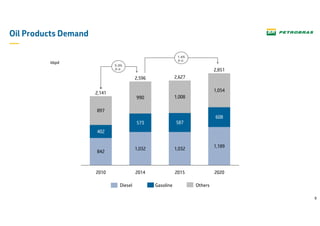
- 10. 10 Oil Products Demand 842 402 573 587 608 897 990 2,596 1,032 2010 2,141 2020 2,851 1,189 1,054 2015 2,627 1,032 1,008 2014 kbpd Gasoline 5.0% p.y. 1.6% p.y. Diesel Others
- 11. 11 Downstream Balance: Oil and Oil Products (kbpd) 170 152 415 330 -178 166 344 447 291 -281 -245 1H15 -125 53 1H14 -526 1H15 621 1H14 862 1H15 496 1H14 336 Oil Products Oil Exports Imports Balance Balance Evolution (kbpd) -27 -225 -390 -222 -633 -417 2Q151Q154Q143Q142Q141Q14
- 12. 12 Financial Ratios - Indebtedness 1) As of the 2Q15, the adjusted EBITDA used to calculate the ratio is the sum of the last 12 months 2) Net Debt / (Net Debt + Shareholders Equity)
- 13. 13 Deleverage Projection Including productivity gains and divestments/restructurings in 2017 and 2018 Net Debt / EBITDANet Leverage 5.0 0.0 1.0 2.0 3.0 4.0
- 14. 14 2015 Cash Flow US$ Billion 11 13 26 3 13 2 Rollovers 2 Divestments 3 2015 Final Cash Flow 20 Funding Needs 12 Investments -28 -12 -16 Interests, Amortizations and Others -22 -10 -12 Operating Cash Flow 26 2015 Initial Cash Position * * * * * * Realized in 1H15 0.2* *
- 15. 15 Moody’s Petrobras Brazil Aaa Aa1 Aa2 Aa3 A1 A2 A3 Baa1 Baa2 Baa3 Ba1 Ba2 Ba3 B1 B2 B3 C Aaa Aa1 Aa2 Aa3 A1 A2 A3 Baa1 Baa2 Baa3 Ba1 Ba2 Ba3 B1 B2 B3 C O - + S&P Petrobras Brazil AAA AA+ AA AA- A+ A A- BBB+ BBB BBB- BB+ BB BB- B+ B B- C AAA AA+ AA AA- A+ A A- BBB+ BBB BBB- BB+ BB BB- B+ B B- C Fitch Petrobras Brazil AAA AA+ AA AA- A+ A A- BBB+ BBB BBB- BB+ BB BB- B+ B B- C AAA AA+ AA AA- A+ A A- BBB+ BBB BBB- BB+ BB BB- B+ B B- C - - - Positive outlook Stable outlook Negative outlook O Petrobras Global Rating Petrobras Intrinsic Risk Investment Grade Non Investment Grade Rating Agencies Scale – Petrobras and Brazil Current Rating O -
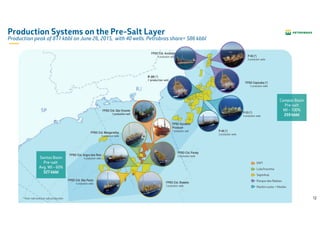
- 17. 17 Production Systems on the Pre-Salt Layer Production peak of 811 kbbl on June 26, 2015, with 40 wells. Petrobras share= 586 kbbl FPSO Cid. Angra dos Reis 5 production wells FPSO Cid. Paraty 5 production wells FPSO Cid. São Paulo 4 production wells FPSO Cid. Mangaratiba 3 production wells FPSO Cid. Ilhabela 3 production wells FPSO Dynamic Producer 1 production well P-58 (*) 5 production wells FPSO Capixaba (*) 2 production wells FPSO Cid. Anchieta 4 production wells P-48 (*) 2 production wells P-53 (*) 4 production wells EWT Lula/Iracema Sapinhoá Parque das Baleias Marlim Leste + Marlim Santos Basin Pre-salt Avg. WI – 60% 327 kbbl Campos Basin Pre-salt WI – 100% 259 kbbl * Post-salt and pre-salt production FPSO Cid. São Vicente 1 production well P-20 (*) 1 production well
- 18. 18 ATAPU LIBRA BUZIOS LULA / IRACEMA SURURU JÚPITER SÉPIA SUL DE SURURU OESTE DE ATAPU SUL DE LULA CARCARÁ CARAMBA LAPASAPINHOÁ NORTE DE BERBIGÃO ITAPÚ SUL DE SAPINHOÁ SAGITÁRIO BERBIGÃO SUL DE BERBIGÃO IRACEMA NORTE DE SURURU Pre-Salt Performance Fast production growth, low lifting cost and continuous reduction of well-construction time Average Reduction 17% p.a. days 2008 2009 2010 2011 2012 2013 2014 2015 PRODUCTION SHARING TRANSFER OF RIGHTS CONCESSION Daily Production Record 811 th. bpd on Jun. 26th AverageMonthlyProduction (kbpd) SANTOS BASIN PRE-SALT POLE *Lula/Iracema field
- 19. 19* Top 5 fields in average productivity per well. Sources: Norwegian Petroleum Directorate and Bureau of Ocean Energy Management Pre-salt Productivity Average productivity above 30 kbpd Apr/15, Source: NPDMay/15May/15 Apr/15, Source: BOEM
- 20. 20 Adjustments on Offshore Projects Schedule = 2015-2019 BMP Variations on production systems first-oil years in comparison with 2014-18 BMP 1 year delay Rev. of Marlim Lula Sul Atapu Sul Berbigão Sépia Búzios 1 2 years delay Lula Norte Búzios 4 3 years delay Lula Oeste Búzios 2 After 2020 ES Águas Profundas SE Águas Profundas 1 Parque das Baleias Sul Maromba 1 Carcará Júpiter Espadarte 3 SE Águas Profundas 2 Rev. of Marlim 2 Itapu No alteration Iracema Norte Lapa Lula Alto Lula Central Tartaruga Verde e Mestiça Lula Ext. Sul / Sul de Lula Búzios 3 Iara NE / Atapu Norte Búzios 5 Libra Post-salt Pre-salt
- 21. 21 New Offshore Production Systems in Brazil Average capacity of oil processing is150 kbpd and production peak in 2 years 2.0 2.1 2.2 2.8 2.0 2.1 1,4 2014 2015 2016 2017 2018 2019 2020 millionbpd PAPA TERRA (Mar/15) IRACEMA NORTE (3Q) LULA ALTO (1H) LULA CENTRAL (1H) LAPA (2H) TLD de LIBRA (2H) LULA SUL Replicant FPSO BÚZIOS 1 FPSO ToR BÚZIOS 3 FPSO ToR TARTARUGA VERDE E MESTIÇA LULA EXT. SUL Replicant FPSO LULA NORTE Replicant FPSO ATAPU NORTE/ PILOTO SURURU Replicant FPSO ATAPU SUL Replicant FPSO BÚZIOS 2 FPSO ToR BÚZIOS 4 FPSO ToR SÉPIA REVITALIZAÇÃO DE MARLIM 1 BÚZIOS 5 BERBIGÃO / SURURU Replicant FPSO PRE –SALT (CONCESSION) TRANSFER OF RIGHTS POST -SALT PRODUCTION SHARING To be contracted LIBRA PILOT LULA OESTE + New Systems Current Systems Production + Ramp-up + Complementary
- 22. 22 Vitória ES RJ Campos Basin Parque das Baleias Cangoá Peroá Canapu Golfinho Camarupim Carapó RoncadorAlbacora Marlim Barracuda Garoupa Carapicu Xerelete Papa-Terra Maromba Carataí Pampo Controlled production reduction on Campos Basin Reduction of 9.9% on the production in five years - 2.1% CAGR 100 km 86% 75% Campos Basin Share on Petrobras production in Brazil 84% 83% 82% 79%
- 23. 23 Oil, NGL and Natural Gas Production in Brazil and Abroad Comparison with 2014-2018 BMP Million boed
- 24. 24 Petrobras Offshore Rig Fleet (domestic) As of July 2015 6 6 5 5 5 3 2 2 11 11 13 10 8 6 4 4 19 22 21 28 21 19 16 11 3 5 13 19 40 40 39 30 0 10 20 30 40 50 60 70 80 2008 2009 2010 2011 2012 2013 2014 2015 (until July) Jackup Floating (up to 999 m) Foating (from 1,000 to 1,999 m) Floating (2,000 m or more)