Policy Compass t-Gov 2014 Presentation
•
0 likes•361 views

The Policy Compass project aims to develop online tools to improve policy analysis and evaluation. It will integrate tools for (1) constructing metrics like prosperity indices using open data, (2) building causal models of policies using fuzzy cognitive maps, and (3) facilitating online debates and mapping arguments. The platform will simplify using and visualizing open data, help analyze policies, and raise public discourse on measuring economic and social progress. It seeks to make policymaking more evidence-based, transparent and accountable.
Report
Share


Policy Compass t-Gov 2014 Presentation
- 1. EVIDENCE-BASED, TRANSPARENT AND ACCOUNTABLE POLICYANALYSIS AND EVALUATION: THE POLICY COMPASS APPROACH Ourania Markaki, Panagiotis Kokkinakos, Sotiris Koussouris, Habin Lee, Obaid Abdul Fatah, Martin Löhe, Yuri Glikman 9 July 2014 t-Gov Workshop 2014 – Brunel University, West London
- 2. Project Overview Policy Compass http://policycompass.eu/ •STREP Project, co-funded by the European Union under the “ICT for Governance and Policy Making” theme (ICT- 2013.5.4, Grant Agreement No: 612133) •Project start: 1 October 2013 •Duration: 36 months •Project Coordinator: Fraunhofer FOKUS (Germany) •Consortium: 7 organizations from 5 different countries 9 July 2014 t-Gov Workshop 2014 – Brunel University, West London 2
- 3. Policy Compass Consortium 9 July 2014 t-Gov Workshop 2014 – Brunel University, West London 3
- 4. The Problem • Wealth of information readily available on the internet • Lack of consensus about a suitable metric for measuring progress • Gross Domestic Product (GDP) • Human Development Index (HDI) • Genuine Progress Index (GPI) • Difficulty of tracking political events to their practical effects The Opportunity 9 July 2014 t-Gov Workshop 2014 – Brunel University, West London 4 Context easy to-use tools for both the lay public and professional policy makers to improve the quality and transparency of the policy analysis and monitoring phases of the policy life-cycle. open public data social media fuzzy cognitive maps e-participation platforms & argumentation technology
- 5. The Policy Compass Promise: Concept and Main Functionalities • A research prototype of an easy-to-use, highly visual and intuitive tool for: • Constructing prosperity and other policy metrics with an easy-to-use visual language for defining variables and functions over open data sources. • Constructing graphs and charts visualizing metrics for selected geographical regions and time periods. • Annotating graphs and charts with political or policy events • Constructing causal models with an easy-to-use visual tool for Fuzzy Cognitive Maps (FCM). • Sharing and debating prosperity graphs and FCM across popular social media platforms. • Summarizing and visualizing the debates in argument maps and conducting structured surveys about policy issues • Aggregating opinions on policy issues, to formulate a common position using delegated voting via the Adhocracy platform. 9 July 2014 t-Gov Workshop 2014 – Brunel University, West London 5
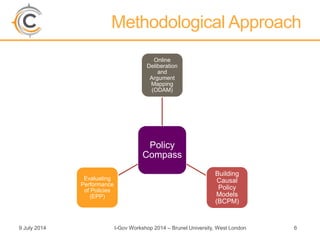
- 6. 9 July 2014 t-Gov Workshop 2014 – Brunel University, West London 6 Methodological Approach Policy Compass Online Deliberation and Argument Mapping (ODAM) Building Causal Policy Models (BCPM) Evaluating Performance of Policies (EPP)
- 7. 9 July 2014 t-Gov Workshop 2014 – Brunel University, West London 7 Evaluating Performance of Policies (EPP) EPP1. Data Discovery and Processing • Search for Open Data Sources • Importing Data Series to Policy Compass • Search Policy Compass Platform for existing metrics EPP2. Metrics Definition • Selection of Predefined Metrics • Construction of Composite Metrics EPP3. Metrics Calculation and Visualisatio n • Application of metrics on Open Data sets • Visualisation of Metrics over Time EPP4. Improving Understand ing of Trend Lines • Comparison of Metrics Trend Lines • Search into Events registry to identify time points where graphs show abnormalities • Annotating Graphs points through linking with Events EPP5. Seeking further explanation of Policy Impacts • Seeking for existing Policy Models explaining interrelations and causal effects • Identifying factors contributing to certain policy output/impact and their weighting EPP5. Sharing Knowledge and Results • Pushing Visualisation snapshots and metrics to the Policy Compass deliberation tools • Sharing Visualisations and Composite Metrics to Web2.0 channels to BCMP to ODAM
- 8. 9 July 2014 t-Gov Workshop 2014 – Brunel University, West London 8 Building Causal Policy Models (BCPM) BCPM1. Discovering Open Data related to Policies • Search for relevant available (open) data on the World Wide Web. • Construct a library of data to be used for link data with impacts. BCPM2. Creating/Refi ning Causal Networks • Create a new Policy Model or Edit an existing One • Create concepts by relating data with their impacts • Create Causal Networks by defining directional links BCPM3. Turning Causal Networks to Fuzzy Cognitive Maps • Setting fuzzy values on the Causal Model • Turning the policy model into a Fuzzy Cognitive Map BCPM4. Simulating FCMs and Visualising Impacts • Select Simulation Variables for the FCM • Perform Simulations • Visualise Simulated Results for better understanding of Impacts BCPM5. Sharing Knowledge and Results • Pushing Simulations snapshots to the Policy Compass deliberation tools • Sharing Fuzzy Congintive Maps to Web2.0 channels to ODAM
- 9. 9 July 2014 t-Gov Workshop 2014 – Brunel University, West London 9 Online Deliberation and Argument Mapping (ODAM) ODAM1. Initiate/Participat e in Deliberations • Create a new deliberation topic or participate in an existing topic ODAM2. Transforming Structured Discussions into Argument Maps • Identifying statements and opinions voiced • Transforming statements and opinions into arguments • Deriving the discussion argument map ODAM3. Navigating Argument Maps • Navigate through the argument maps to better understand the relations and the debates amongst different positions.
- 10. • The Policy Compass will be realized as an online Web platform integrating the tools developed in the project. • The platform will provide an open API for integrating its datastore and services into external platforms, and widgets for integrating its user interfaces into selected eParticipation platforms and social networks. 9 July 2014 t-Gov Workshop 2014 – Brunel University, West London 10 Technical Approach
- 11. Added Value of the Approach (1/2) • Simplify the way to utilize, interact, mash-up, visualize and interpret the increasing amount of international open economic data and wealth indicators. • Improve the analysis and evaluation of policies • Broaden the use of open data by citizens to support and improve policy making. • Raise and objectify the European public discourse on how • to measure growth in the economy and society • to develop holistic prosperity and progress indices • Facilitate more objective, evidence-based and transparent policy deliberations. 9 July 2014 t-Gov Workshop 2014 – Brunel University, West London 11
- 12. Added Value of the Approach (2/2) 9 July 2014 t-Gov Workshop 2014 – Brunel University, West London 12 • Visualize the effects of their politics • Communicate policy outcomes to citizens clearer • Stimulate public debate • Build confidence in progress towards societal goals • Create their own prosperity /community development indices • Monitor and control the indicator modeling process • Leverage open statistical data • Monitor and critically discuss the quality of public policies • Explore the effects and costs of policies • Engage in the development of prosperity indices • Participate in on-line debates • Improve the objectivity and evidential basis of their arguments • Learn about the social and economic consequences of policies Decision Makers Civil Society Citizens and especially the Younger Generation