Predict Your Profits: Optimizing Ad Campaigns with Data-Driven Insights
- 1. CONFIDENTIAL: The information in this document belongs to Boston Institute of Analytics LLC. Any unauthorized sharing of this material is prohibited and subject to legal action under breach of IP and confidentiality clauses.
- 2. CONFIDENTIAL: The information in this document belongs to Boston Institute of Analytics LLC. Any unauthorized sharing of this material is prohibited and subject to legal action under breach of IP and confidentiality clauses. Prediction Product AD Campaign Performance Presented by :Gravan Dmello
- 3. CONFIDENTIAL: The information in this document belongs to Boston Institute of Analytics LLC. Any unauthorized sharing of this material is prohibited and subject to legal action under breach of IP and confidentiality clauses. Introduction • An advertising campaign is a set of advertisements that work together to promote a product or service. An ad campaign is designed around a specific and unique theme to create brand awareness about the company’s product or service. • An advertising campaign can be a series of different individual ads or the same ad across mediums used to create awareness and interest in a product or service. • This is achieved through different forms of media, including radio, television, print advertising, direct mail, or the internet. • The intended objective of this project is to develop a robust supervised machine learning model designed to accurately forecasts key performance indicators (KPIs) for future product ad campaign. By achieving this goal, we aim to provide them with valuable insights that can inform strategic decision-making, optimize resource allocation, and enhance overall marketing effectiveness.
- 4. CONFIDENTIAL: The information in this document belongs to Boston Institute of Analytics LLC. Any unauthorized sharing of this material is prohibited and subject to legal action under breach of IP and confidentiality clauses. Dataset Information Here are the key details about the dataset used in this project: Our has 731 entries and 11 columns. The columns include There are three columns with float data types and eight with integer data types. The dataset has 5 categorical variables namely limit_infor, campaign_type, campaign_level, product_level, resource_amount whose values have been represented by single digit numbers. Here, the target variable is "orders" limit_infor limits or restrictions associated with the marketing campaign or product.(0,1) campaign_type type of marketing campaign, such as email, social media, print advertising,etc (0,1,2,3,4,5,6) campaign_level level or scale of the marketing campaign, for example, national, regional, or local.(0,1) product_level level or category of the product being marketed, such as high-end, mid-range, or budget.(1,2,3) resource_amount resources (e.g., budget, personnel, or materials) allocated for the marketing campaign.(1,2,3,4,5,6,7,8,9) email_rate email delivery rate or open rate. price selling price of the product. discount_rate discounts or promotional offers associated with the product. hour_resources the number of labor hours or human resources dedicated to the marketing campaign or product sales efforts. campaign_fee fees or costs associated with running the marketing campaign. orders number of orders or sales generated for the product during the marketing campaign.
- 5. CONFIDENTIAL: The information in this document belongs to Boston Institute of Analytics LLC. Any unauthorized sharing of this material is prohibited and subject to legal action under breach of IP and confidentiality clauses. Exploratory Data Analysis (EDA) • EDA is used to provides a provides a better understanding of data set variables and the relationships between them. • The dataset had no duplicates and 2 missing values in "price" which was 0.27% of total data. Hence, the rows with missing values were dropped. • While observing the relationship of numeric values with "orders", the campaign_fee had one outlier which was removed for a cleaner data.
- 6. CONFIDENTIAL: The information in this document belongs to Boston Institute of Analytics LLC. Any unauthorized sharing of this material is prohibited and subject to legal action under breach of IP and confidentiality clauses. Exploratory Data Analysis (EDA) • Correlation coefficient revealed that 'discount_rate' (0.232), email_rate' (0.627), 'hour_resouces' (0.663), and 'campaign_fee’ (0.762) have positive correlations with 'orders'. 'price' (-0.102) has a weak negative correlation with 'orders'. • To ensure consistent scales for numerical features, MinMax Scaler was employed during preprocessing.
- 7. CONFIDENTIAL: The information in this document belongs to Boston Institute of Analytics LLC. Any unauthorized sharing of this material is prohibited and subject to legal action under breach of IP and confidentiality clauses. Visualizations • The independent variables "campaign_fee", "hour_resources" and "email_rate" have linear relationship with target variable "orders" .
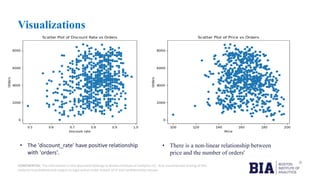
- 8. CONFIDENTIAL: The information in this document belongs to Boston Institute of Analytics LLC. Any unauthorized sharing of this material is prohibited and subject to legal action under breach of IP and confidentiality clauses. Visualizations • There is a non-linear relationship between price and the number of orders' • The 'discount_rate' have positive relationship with 'orders'.
- 9. CONFIDENTIAL: The information in this document belongs to Boston Institute of Analytics LLC. Any unauthorized sharing of this material is prohibited and subject to legal action under breach of IP and confidentiality clauses. • In this step, we divided the dataset into two parts: X and y. X contains all the independent variables, which are the features used to make predictions. Meanwhile, y represents the dependent variable or target variable, which is the outcome we want to predict. • The dataset was split into training and testing sets. • An 80:20 ratio was used, with 80% of the data allocated to training and 20% to testing, and the test size set to 0.2. • A random state of 42 was specified to ensure the reproducibility of results across different runs Splitting the data into X and y Train-Test Split
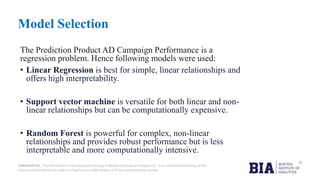
- 10. CONFIDENTIAL: The information in this document belongs to Boston Institute of Analytics LLC. Any unauthorized sharing of this material is prohibited and subject to legal action under breach of IP and confidentiality clauses. Model Selection The Prediction Product AD Campaign Performance is a regression problem. Hence following models were used: • Linear Regression is best for simple, linear relationships and offers high interpretability. • Support vector machine is versatile for both linear and non- linear relationships but can be computationally expensive. • Random Forest is powerful for complex, non-linear relationships and provides robust performance but is less interpretable and more computationally intensive.
- 11. CONFIDENTIAL: The information in this document belongs to Boston Institute of Analytics LLC. Any unauthorized sharing of this material is prohibited and subject to legal action under breach of IP and confidentiality clauses. Predictions: Linear Regression Support Vector Machine RMSE on Train Score: 0.04030 RMSE on Train Score: 0.04123 RMSE on Test Score: 0.04055 RMSE on Test Score: 0.04047 Difference between RMSE on train and test set 0.00025 Difference between RMSE on train and test set 0.00076 Observation: Linear regression have shown slightly better results than SVM
- 12. CONFIDENTIAL: The information in this document belongs to Boston Institute of Analytics LLC. Any unauthorized sharing of this material is prohibited and subject to legal action under breach of IP and confidentiality clauses. Predictions: Random Forest Regression Before Tuning After Tuning RMSE on Train Score: 0.0211 RMSE on Train Score: 0.0312 RMSE on Test Score: 0.0445 RMSE on Test Score: 0.0455 Difference between RMSE on train and test set 0.0233 Difference between RMSE on train and test set 0.0233 Observation: There is no significant improvement in RMSE values after hypertuning the values
- 13. CONFIDENTIAL: The information in this document belongs to Boston Institute of Analytics LLC. Any unauthorized sharing of this material is prohibited and subject to legal action under breach of IP and confidentiality clauses. Feature Importance (Random Forest Regression) • 'campaign_fee' has the highest importance , 'hour_resources' have moderate importance and price have minimal importance compared to other two. • The remaining features (email_rate, discount_rate, campaign_type, resource_amount, product_level, campaign_level, limit_infor) have negligible importance in the model.
- 14. CONFIDENTIAL: The information in this document belongs to Boston Institute of Analytics LLC. Any unauthorized sharing of this material is prohibited and subject to legal action under breach of IP and confidentiality clauses. The Best Performing ML Model
- 15. CONFIDENTIAL: The information in this document belongs to Boston Institute of Analytics LLC. Any unauthorized sharing of this material is prohibited and subject to legal action under breach of IP and confidentiality clauses. Conclusions • The analysis and predictions provide valuable insights that can significantly enhance the ad campaign performance for the company. • Campaign Fee and Hour Resources: Increasing campaign fees and allocating more resources positively influence the number of orders, suggesting that investments in these areas are likely to yield higher returns. • Pricing Strategy: Higher prices tend to reduce the number of orders. Therefore, maintaining competitive and minimal prices can attract more customers and boost sales. • Discount Rates: While higher discount rates can slightly increase the number of orders, their impact is minimal. This indicates that focusing primarily on pricing and resource allocation may be more effective than relying heavily on discounts. • Model Performance: Linear regression outperforms SVM and random forest regression due to the linear relationship between features and the target variable. This finding underscores the importance of using a simpler, well-suited model to avoid overfitting and ensure accurate predictions. By leveraging these insights, the company can strategically allocate resources, optimize pricing, and fine-tune their ad campaigns to maximize effectiveness and improve the overall return on investment (ROI).


