Location via proxy:   [ UP ]  
[Report a bug]   [Manage cookies]                
SlideShare a Scribd company logo
Predictions for Digital 2012
Propel Executive Breakfast
   Predictions for 2012

    Guy Phillipson, CEO
Internet Advertising Bureau


 www.iabuk.net          12th January 2011
MARKET BACKGROUND
& TRENDS
From last to first in 10 years
                                                                                               2011 - £4.6bn*
                                                                                                 27% share


2001- £166m
 1% share


   H1 H2 H1 H2 H1 H2 H1 H2 H1 H2 H1 H2 H1 H2 H1 H2 H1 H2 H1 H2 H1 H2
  2001 2001 2002 2002 2003 2003 2004 2004 2005 2005 2006 2006 2007 2007 2008 2008 2009 2009 2010 2010 2011 2011


                 *based on H1 IAB/PwC ad spend figures and IAB H2 forecast
Increase in users in 2011


38.4m             40m
                         Source: UKOM June 2010 and Dec 2011
Predictions for Digital 2012
“My Entertainment Anywhere”
             Time Spent Online


                                         40%
      60%


My Entertainment Anywhere (Social, video & games)
All Other Online Activity (Search, news, shopping, email etc)

                                                                Source: UKOM June 2011
H1 2011 vs. H1 2010


               Source: PwC / Internet Advertising Bureau / WARC
Online showing strongest growth
Year on year growth for H1 2011


                                           Source: PwC / Internet Advertising Bureau,
                 The Advertising Association / WARC: WARC estimate for directories.
Online’s market share for H1 2011 27%
 % share of revenues for January to
              June 2011


                Source: PwC / Internet Advertising Bureau / The Advertising Association / WARC
PRESS CUTTINGS
Share of spend by Consumer Goods
                advertisers is now 2nd place


Source: PwC / Internet Advertising Bureau: IAB estimates for industry sector shares are based on categorised net revenue from media owners provided
by PwC. Data excludes unclassified, multi-advertiser, recruitment and misc figures and covers 58% of online display revenues in H1 2011.
Video grows 100% year on year


                                                                                              Source: PwC / Internet Advertising Bureau
NB: Video includes pre/mid/post-roll, social video and other video. Social Video and other video included for the first time in H1 2011
Social media display up dramatically
           year on year


                    60%+
Source: IAB / PwC mobile display ad spend survey 2010
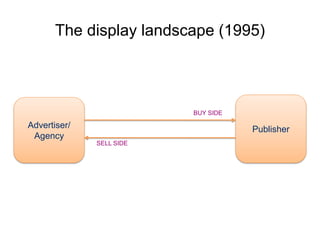
The display landscape (1995)


                          BUY SIDE

Advertiser/                          Publisher
 Agency
              SELL SIDE
The display landscape today!

                               Content Verification


                    ATDs                Ad Exchange
                                                        Yield
                                                      Optimiser
Advertiser/                                             / Sell    Publisher
 Agency                                                  Side
                                                      Platforms
                                                       (SSPs)
                    DSP
                                         Ad Network

Creative            Data
Optimiser         optimisers

         Data        Data            Data
      exchanges    suppliers      aggregators
Expert Witnesses

• Nick Roveta         Go Viral/AOL

• Tom Ollerton        We are Social

• Carl Uminiski           Somo

• Louisa Wong         Amnet Group
Questions?
2012 Video Predictions
     Nick Roveta
What goviral do
  Your videos               Our audience                Guaranteed
                                                        engagement


Branded Video content     +37,000 publishing partners   Cost per view (CPV)
Video metrics won’t be standardized
           Because the major players don’t need to speak the same language


      View


Engagement


 Interaction


Performance
Ad Selector will replace pre-roll in 2013
           (so start testing now)
Video and Social will begin to Augment
30% of Video Ads will be in Social Games
                                                     420
                                              Million Monthly Active
                                               Facebook Users are
                                                   Social Gaming
                                                                          75%
                                                                       Of Facebook Audience

                                                   210                   play Social Games


                                               Minutes are spent
                                              Social Gaming each
                                                     month                $3bn
                                                                          Industry in 2012


            Sources : Morgan Stanley, emarketer, Facebook, Flurry
Mobile video ads will still disappoint…


       #1                                                                            47%
Mobile App Category
                                                                                   Of all Mobile App
by downloads is Social
                                                                                 Consumption is Social
      Gaming
                                                                                        Gaming


                 (Except in mobile gaming)
                         Sources : Morgan Stanley, emarketer, Facebook, Flurry
Pre Roll will continue to dominate
                    (Video budgets in 2012)


    90%
In Stream and Video banners
                                                   10%
                                                   Other


                                              Source: AccuStream Research, Q4 2011
Video Ad Networks will be essential


But MUST evolve model to survive
                           Source: AccuStream Research, Q4 2011
Expect some network consolidation


  Small tech/talent acquisitions


       But no big buy outs
                             Source: AccuStream Research, Q4 2011
Thanks
5 Predictions for mobile in 2012


Presented by:                    Presented on:

Carl Uminski                     12th January


                                                                32
                          Somo Ltd - Copyright & Confidential
1. Serious retail adoption


24%
2. Rapid adoption of tablets


                                     £


     ~5M = 46% iOS Mobile Browsing
3. Augmentation of print media
4. Synchronous use of TV
5. Mobile Ad spend will explode (..again)


Ad spend       1%


                            time spent on
                            mobile
                    10%
Thank you

@uminski   @somoagency
39
Predictions for Digital 2012
Source: According to Econsultancy's 2011
     Online Advertisers Survey Report
41
It is early days, but real time-bidding (RTB) is going to be as big an
 initiative in Europe as it is in the US, where we are seeing triple-digit
 increases in our ROI,” predicts Daphne Sacco, Director of Internet
 Marketing at eBay International.


BSkyB has also been an early adopter of RTB in display advertising. In July
2010, it accounted for around 2% of Sky’s display adspend. By January
2011, this had grown to 18%. Matthew Turner, Head of Online Sales and
marketing at Sky, hopes this will reach 50% by 2013.


                                 Source: Marketing Week article – “Why RTB is a game-
                                 changer for digital ads”, September 2011
Predictions for Digital 2012
2. Re-engineering Business Models
Predictions for Digital 2012
46
Predictions for Digital 2012

More Related Content

Predictions for Digital 2012

  • 3. Propel Executive Breakfast Predictions for 2012 Guy Phillipson, CEO Internet Advertising Bureau www.iabuk.net 12th January 2011
  • 5. From last to first in 10 years 2011 - £4.6bn* 27% share 2001- £166m 1% share H1 H2 H1 H2 H1 H2 H1 H2 H1 H2 H1 H2 H1 H2 H1 H2 H1 H2 H1 H2 H1 H2 2001 2001 2002 2002 2003 2003 2004 2004 2005 2005 2006 2006 2007 2007 2008 2008 2009 2009 2010 2010 2011 2011 *based on H1 IAB/PwC ad spend figures and IAB H2 forecast
  • 6. Increase in users in 2011 38.4m 40m Source: UKOM June 2010 and Dec 2011
  • 8. “My Entertainment Anywhere” Time Spent Online 40% 60% My Entertainment Anywhere (Social, video & games) All Other Online Activity (Search, news, shopping, email etc) Source: UKOM June 2011
  • 9. H1 2011 vs. H1 2010 Source: PwC / Internet Advertising Bureau / WARC
  • 10. Online showing strongest growth Year on year growth for H1 2011 Source: PwC / Internet Advertising Bureau, The Advertising Association / WARC: WARC estimate for directories.
  • 11. Online’s market share for H1 2011 27% % share of revenues for January to June 2011 Source: PwC / Internet Advertising Bureau / The Advertising Association / WARC
  • 13. Share of spend by Consumer Goods advertisers is now 2nd place Source: PwC / Internet Advertising Bureau: IAB estimates for industry sector shares are based on categorised net revenue from media owners provided by PwC. Data excludes unclassified, multi-advertiser, recruitment and misc figures and covers 58% of online display revenues in H1 2011.
  • 14. Video grows 100% year on year Source: PwC / Internet Advertising Bureau NB: Video includes pre/mid/post-roll, social video and other video. Social Video and other video included for the first time in H1 2011
  • 15. Social media display up dramatically year on year 60%+
  • 16. Source: IAB / PwC mobile display ad spend survey 2010
  • 17. The display landscape (1995) BUY SIDE Advertiser/ Publisher Agency SELL SIDE
  • 18. The display landscape today! Content Verification ATDs Ad Exchange Yield Optimiser Advertiser/ / Sell Publisher Agency Side Platforms (SSPs) DSP Ad Network Creative Data Optimiser optimisers Data Data Data exchanges suppliers aggregators
  • 19. Expert Witnesses • Nick Roveta Go Viral/AOL • Tom Ollerton We are Social • Carl Uminiski Somo • Louisa Wong Amnet Group
  • 21. 2012 Video Predictions Nick Roveta
  • 22. What goviral do Your videos Our audience Guaranteed engagement Branded Video content +37,000 publishing partners Cost per view (CPV)
  • 23. Video metrics won’t be standardized Because the major players don’t need to speak the same language View Engagement Interaction Performance
  • 24. Ad Selector will replace pre-roll in 2013 (so start testing now)
  • 25. Video and Social will begin to Augment
  • 26. 30% of Video Ads will be in Social Games 420 Million Monthly Active Facebook Users are Social Gaming 75% Of Facebook Audience 210 play Social Games Minutes are spent Social Gaming each month $3bn Industry in 2012 Sources : Morgan Stanley, emarketer, Facebook, Flurry
  • 27. Mobile video ads will still disappoint… #1 47% Mobile App Category Of all Mobile App by downloads is Social Consumption is Social Gaming Gaming (Except in mobile gaming) Sources : Morgan Stanley, emarketer, Facebook, Flurry
  • 28. Pre Roll will continue to dominate (Video budgets in 2012) 90% In Stream and Video banners 10% Other Source: AccuStream Research, Q4 2011
  • 29. Video Ad Networks will be essential But MUST evolve model to survive Source: AccuStream Research, Q4 2011
  • 30. Expect some network consolidation Small tech/talent acquisitions But no big buy outs Source: AccuStream Research, Q4 2011
  • 32. 5 Predictions for mobile in 2012 Presented by: Presented on: Carl Uminski 12th January 32 Somo Ltd - Copyright & Confidential
  • 33. 1. Serious retail adoption 24%
  • 34. 2. Rapid adoption of tablets £ ~5M = 46% iOS Mobile Browsing
  • 35. 3. Augmentation of print media
  • 37. 5. Mobile Ad spend will explode (..again) Ad spend 1% time spent on mobile 10%
  • 38. Thank you @uminski @somoagency
  • 39. 39
  • 41. Source: According to Econsultancy's 2011 Online Advertisers Survey Report 41
  • 42. It is early days, but real time-bidding (RTB) is going to be as big an initiative in Europe as it is in the US, where we are seeing triple-digit increases in our ROI,” predicts Daphne Sacco, Director of Internet Marketing at eBay International. BSkyB has also been an early adopter of RTB in display advertising. In July 2010, it accounted for around 2% of Sky’s display adspend. By January 2011, this had grown to 18%. Matthew Turner, Head of Online Sales and marketing at Sky, hopes this will reach 50% by 2013. Source: Marketing Week article – “Why RTB is a game- changer for digital ads”, September 2011
  • 46. 46