Predictive Maintenance - Predict the Unpredictable
- 1. September 15 Predict the (un)Predictable Maintenance AI Guide to One of the Most Critical Industry 4.0 Activities
- 2. About me • Software Architect & SPM @ o 16+ years professional experience • Microsoft Azure MVP • External Expert Horizon 2020 • External Expert Eurostars, InnoFund DK • Business Interests o IoT, Computer Intelligence o Web Development, SOA, Integration o Security & Performance Optimization • Contact o ivelin.andreev@icb.bg o www.linkedin.com/in/ivelin o www.slideshare.net/ivoandreev
- 3. Thanks to our Sponsors: Innovation Partner With the Support of: Trusted PartnerDigital Transformation Partner
- 4. Agenda Predictive Maintenance • The PdM domain problem • The science behind • Practical approach • Demo Questions… • Ask any time • Or wait until the speaker has forgotten what it is about
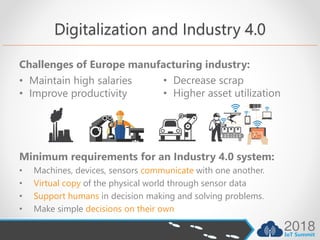
- 5. Digitalization and Industry 4.0 Challenges of Europe manufacturing industry: Minimum requirements for an Industry 4.0 system: • Machines, devices, sensors communicate with one another. • Virtual copy of the physical world through sensor data • Support humans in decision making and solving problems. • Make simple decisions on their own • Maintain high salaries • Improve productivity • Decrease scrap • Higher asset utilization
- 6. Typical goal statements of PdM 4.0: • Maximize utilization, minimize costly downtime • Replace close to failure components only • Enable just in time estimating order dates • Discover patterns for problems • KPI of asset condition • Reduce risk Maintenance Maturity Levels 1. Visual Inspections 2. Instrument Inspections 3. Real-time Condition 4. PdM 4.0
- 7. Where is Europe in PdM 4? 1. Visual Inspection 2. Instrument Inspection 3. Condition Monitoring 4. PdM 4.0 Process - Periodic Inspection - Checklist - Paper recording - Periodic Inspection - Instruments - Digital recording* - Continuous inspection - Sensors* - Digital recording - Continuous inspection - Sensors and other data* - Digital recording Content - Paper based condition - Multiple inspection points - Digital condition data* - Single inspection point - Digital condition data - Multiple inspection points* - Digital condition data - Multiple inspection points - Digital environment data* - Maintenance history* Measure - Visual norm verification - Paper based trend analysis - Prediction by expert - Automatic norm verification - Digital trend analysis* - Prediction by expert - Automatic norm verification - Digital trend analysis - Automatic norm verification - Digital trend analysis - Prediction by stat. software* IT - MS Excel - Embedded instrument software* - Condition monitoring SW - Condition DB* - Condition monitoring SW - Big data platform - Wifi network Organization - Experienced craftsmen - Trained inspectors - Reliability engineers - Reliability engineers - Data scientists* • PdM maturity: Lvl1 & Lvl2 (67%); Lvl 4 (11%), 42% in rail sector • PdM 4 adoption: Belgium 23%, Netherlands 6 %, Germany 2 % * Main improvement areas from the previous level
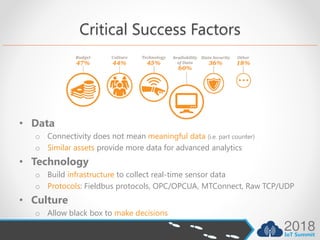
- 8. Critical Success Factors • Data o Connectivity does not mean meaningful data (i.e. part counter) o Similar assets provide more data for advanced analytics • Technology o Build infrastructure to collect real-time sensor data o Protocols: Fieldbus protocols, OPC/OPCUA, MTConnect, Raw TCP/UDP • Culture o Allow black box to make decisions
- 9. Key Requirements for PdM • Predictive problem nature • Procedures in case of failure • Domain experts for guidance • Business readiness to modify processes Limitations • No “One model fits all” • Hence no recurrent IPR IPR is in the approach, tools and experience
- 10. Before we go Technical 1. Know the process 2. Ask some questions o What question shall the model answer? o How long in advance the model shall warn? o Can the system prescribe actions for fix? o What is more expensive (false warning vs. missed event)? o What are the performance goals? (High precision/High sensitivity/Balanced)? Asset value ranking Asset selection for PdM Modeling for reliability PdM algorithm design Realtime performance monitoring Failure prediction Preventive task prescription
- 11. Start PdM with Data • Instrument read-outs (68%) • Digital forms (45%) • Sensor readings (41%) • External systems (38%) NB: Data Quality
- 12. PdM Types of Data • Telemetry data o Key assumption: Machine condition degrades over time o Time varying features that capture patterns for wear and aging o Deploy IoT infrastructure for sensor data collection o Sources – controller, external sensors • Static data o Metadata (manufacturer, model, software, operator) o Environment and location • Failure history o Sufficient examples for normal operation and failures • Maintenance history o Component replacement and reparation records
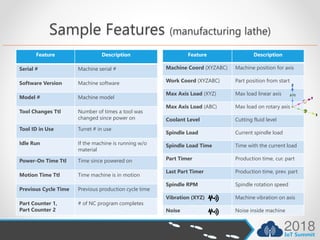
- 13. Sample Features (manufacturing lathe) Feature Description Serial # Machine serial # Software Version Machine software Model # Machine model Tool Changes Ttl Number of times a tool was changed since power on Tool ID in Use Turret # in use Idle Run If the machine is running w/o material Power-On Time Ttl Time since powered on Motion Time Ttl Time machine is in motion Previous Cycle Time Previous production cycle time Part Counter 1, Part Counter 2 # of NC program completes Feature Description Machine Coord (XYZABC) Machine position for axis Work Coord (XYZABC) Part position from start Max Axis Load (XYZ) Max load linear axis Max Axis Load (ABC) Max load on rotary axis Coolant Level Cutting fluid level Spindle Load Current spindle load Spindle Load Time Time with the current load Part Timer Production time, cur. part Last Part Timer Production time, prev. part Spindle RPM Spindle rotation speed Vibration (XYZ) Machine vibration on axis Noise Noise inside machine
- 14. Feature Engineering Increase predictive power by creating features on raw data • Lag features – “look back” before the date o 1d ago, 2d ago,… Nd ago • Rolling aggregates – smoothening over time window o • Dates o Year/Month/Day/Hour • Categorical features o identify discrete features (mode, instrument) Check Azure team data science process https://docs.microsoft.com/en-gb/azure/machine-learning/team-data-science-process/create-features
- 15. Analysing Data • Identify predictive features • Useful but non-informative features o Tool Number – Value does not identify tool, but the position in the turret (i.e. 1) o Part Counter – For 4-spindle machine parts depend on loaded material (1, 2, 3, 4) • Related features o Part Timer–Spindle Load – A timer runs, only while spindle is loaded on a part • Quality/Scrap features o (Part, XYZ movement, Spindle load) - each part is with unique design o ML could be used to identify deviation from normal production o Note: An operator could perform manual operations (i.e. speed up) • Know your machine o 100% speed (Full-time), 150% speed (30min), 200% speed (3min)
- 16. Feature Selection • Why? o Limit the amount of HW sensors o Limit computational power (CPU, Memory) o Limit noise, reduce overfitting, improve accuracy • Methods of feature selection o Filter - Independent from the ML algorithm, low computational cost • o Embedded – Built-in search for predictive features in ML algorithm • o Wrapper – Measure feature usefulness while ML training •
- 17. PdM ML Strategies • Regression models • Classification models • Anomaly detection
- 18. Regression Models • Question: How many days/hours/cycles before failure? • Basic Assumptions o Enough labeled training data, smooth degrading process o Only one failure-path (machine/machine type) per model • Main Characteristics o Not realistic to model specific hour of failure (and not necessary) o Expected high Root Mean Square Error (RMSE) o Cannot predict RUL without any records for failure (in contrast to classification) • Approach: Label RUL/TTF as a continuous number
- 19. Deep Learning • Question: How many days/hours/cycles before failure? • Basic Assumptions o Same as regression • Main Characteristics o LSTM are good when context is needed to provide output o Suitable for: Speech to text recognition, OCR o LSTM maintain gradient (vanishing gradient problem) over longer sequences o Could not provide understanding for feature relations o Difficult to train (memory, CPU, coding, knowledge) • Technology & Tools o Keras + Tensorflow, Python, Docker o Azure Model Management Service
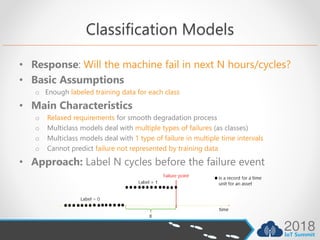
- 20. Classification Models • Response: Will the machine fail in next N hours/cycles? • Basic Assumptions o Enough labeled training data for each class • Main Characteristics o Relaxed requirements for smooth degradation process o Multiclass models deal with multiple types of failures (as classes) o Multiclass models deal with 1 type of failure in multiple time intervals o Cannot predict failure not represented by training data • Approach: Label N cycles before the failure event
- 21. Anomaly Detection • Response: Is the behavior in normal range? • Basic Assumptions o Historical data for normal behavior as a majority in the training dataset o Acceptable very few or none labeled failures o Acceptable high diversity of failures • Main Characteristics o Capable to flag abnormal behavior even w/o encountering in the past o Anomalies are not always failures o No timespan estimate to failure o Anomaly detection quality determined by domain expert or flagged data
- 22. False AlarmsFalse Alarms have serious impact • Degraded confidence in the system • Loss of revenue • Loss of brand image
- 23. Imbalanced Data makes PdM Different • Imbalanced: more examples of one class than others (0.001%) • Errors are not the same o Prediction of minority class (failures) is more important o Asymmetric cost (false negative can cost more than false positive) • Compromised performance of standard ML algorithms o For 1% minority class, Accuracy of 99% does not mean useful model o Area under ROC curve (AUC) • Precision = TP / (TP + FP) • Recall(Sensitivity) = TP / (TP + FN) • Cost-Balanced (F1) o PR-curve is better for imbalanced data • Oversampling o SMOTE – allows better learning o Generate examples that combine features of the target with features of neighbors
- 24. Azure ML StudioAzure ML Workbench
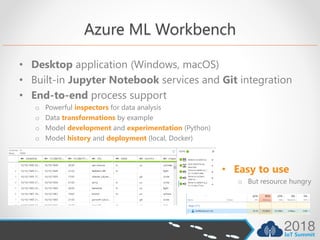
- 25. Azure ML Workbench • Desktop application (Windows, macOS) • Built-in Jupyter Notebook services and Git integration • End-to-end process support o Powerful inspectors for data analysis o Data transformations by example o Model development and experimentation (Python) o Model history and deployment (local, Docker) • Easy to use o But resource hungry
- 26. Takeaways • Azure AI Guide to PdM o https://docs.microsoft.com/en-us/azure/machine-learning/team-data-science- process/cortana-analytics-playbook-predictive-maintenance • Team Data Science Process o https://azure.microsoft.com/en-gb/documentation/learning-paths/data-science-process/ • Azure AI Gallery PdM Samples o https://gallery.azure.ai/browse?s=predictive maintenance • Deep Learning for PdM o https://github.com/Azure/MachineLearningSamples-DeepLearningforPredictiveMaintenance/ o https://towardsdatascience.com/recurrent-neural-networks-and-lstm-4b601dd822a5 o https://medium.com/mlreview/understanding-lstm-and-its-diagrams-37e2f46f1714 • PdM Market Analysis o Predictive Maintenance 4.0 (2017) (PwC & Maininnovation)
- 27. Thanks to our Sponsors: Innovation Partner With the Support of: Trusted PartnerDigital Transformation Partner
- 28. Upcoming Events SQLSaturday #763 (Sofia), October 13 http://www.sqlsaturday.com/763/ JS Talks (Sofia), November 17 http://jstalks.net/ Global O365 Developer Bootcamp, October 27 http://aka.ms/O365DevBootcamp


