Location via proxy:   [ UP ]  
[Report a bug]   [Manage cookies]                
SlideShare a Scribd company logo
Pre-Proposal Presentation
World Health Organization, global burden of neurological disorders estimates and projections, 2014
Pre-Proposal Presentation
Social deficits
Communication deficits
Repetitive behaviors
•
•
•
Pre-Proposal Presentation
phenotype
behavior
imaging
genetic
Pre-Proposal Presentation
• Aim 1: To summarize specific behavioral
phenotypes as brain maps and gene sets
• Aim 2: To validate brain maps and behavior-gene
sets using external data from individuals with
Autism Spectrum Disorder
• Aim 3: To generate a complex network of genes
and behaviors across multiple neuropsychiatric
disorders, and functionally annotate this result
Aim 1
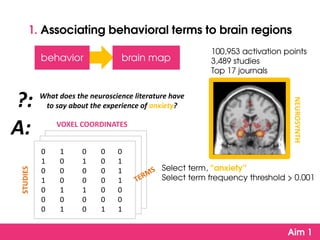
To summarize specific behavioral phenotypes as
brain maps and gene sets
What does the neuroscience literature have
to say about the experience of anxiety??:
A:
1 0 1 0 0 0
2 1 0 1 0 1
3 0 0 0 0 1
4 1 0 0 0 1
5 0 1 1 0 0
6 0 0 0 0 0
7 0 1 0 1 1
STUDIES
VOXEL COORDINATES
NEUROSYNTH
What does the neuroscience literature have
to say about the experience of anxiety??:
NEUROSYNTH
A:
Pre-Proposal Presentation
ALLENBRAINATLAS
ALLENBRAINATLAS
Sample 1
Sample 2.
.
Sample N
genes 1.. 60K
0.25 .012 1.20 … … …
1.50 0.80 3.40 … … …
0.80 0.90 1.00 … … …
0.40 .075 0.20 … … …
1.40 0.32 4.50 … … …
0.89 0.21 2.40 … … …
0.70 0.10 1.20 … … …
•
•
Bigger change = more “important”
•
•
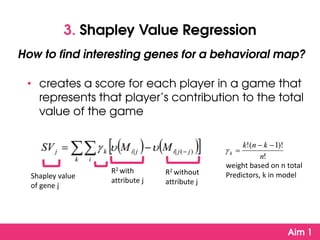
R2
% variance accounted for by model
quality of model predictors
•
R2 with
attribute j
R2 without
attribute j
Shapley value
of gene j
weight based on n total
Predictors, k in model
•
marginal contribution to the R2 from adding the
attribute to the model last
0 0 0
0 1 0
1 0 1
0 0 0
1 0 0
0 0 0
0 0 1
•
•
0.25 0.12 1.20
1.50 0.80 3.40
0.80 0.90 1.00
0.40 0.75 0.20
1.40 0.32 4.50
0.89 0.21 2.40
0.70 0.10 1.20
1 0 1
0 0 0
0 0 0
0 1 0
0 0 0
1 0 1
0 0 0
Aim 2
To validate brain maps and behavior-gene sets
using external data from individuals with Autism
Spectrum Disorder
•
–
Subramanian, et. al, Gene set enrichment analysis: A knowledge-based approach for interpreting genome-wide expression profiles.
PNAS 2005 102 (43) 15545-15550; published ahead of print September 30, 2005,doi:10.1073/pnas.0506580102
Pre-Proposal Presentation
Aim 3
To generate a complex network of genes and
behaviors across multiple neuropsychiatric
disorders, and functionally annotate this result
Pre-Proposal Presentation
 
 
 
•
•
•
•
•
Pre-Proposal Presentation

More Related Content

Pre-Proposal Presentation

  • 5. World Health Organization, global burden of neurological disorders estimates and projections, 2014
  • 17. • Aim 1: To summarize specific behavioral phenotypes as brain maps and gene sets • Aim 2: To validate brain maps and behavior-gene sets using external data from individuals with Autism Spectrum Disorder • Aim 3: To generate a complex network of genes and behaviors across multiple neuropsychiatric disorders, and functionally annotate this result
  • 18. Aim 1 To summarize specific behavioral phenotypes as brain maps and gene sets
  • 19. What does the neuroscience literature have to say about the experience of anxiety??: A: 1 0 1 0 0 0 2 1 0 1 0 1 3 0 0 0 0 1 4 1 0 0 0 1 5 0 1 1 0 0 6 0 0 0 0 0 7 0 1 0 1 1 STUDIES VOXEL COORDINATES NEUROSYNTH
  • 20. What does the neuroscience literature have to say about the experience of anxiety??: NEUROSYNTH A:
  • 24. Sample 1 Sample 2. . Sample N genes 1.. 60K 0.25 .012 1.20 … … … 1.50 0.80 3.40 … … … 0.80 0.90 1.00 … … … 0.40 .075 0.20 … … … 1.40 0.32 4.50 … … … 0.89 0.21 2.40 … … … 0.70 0.10 1.20 … … …
  • 25. • • Bigger change = more “important”
  • 26. • • R2 % variance accounted for by model quality of model predictors
  • 27. • R2 with attribute j R2 without attribute j Shapley value of gene j weight based on n total Predictors, k in model
  • 28. • marginal contribution to the R2 from adding the attribute to the model last
  • 29. 0 0 0 0 1 0 1 0 1 0 0 0 1 0 0 0 0 0 0 0 1 • • 0.25 0.12 1.20 1.50 0.80 3.40 0.80 0.90 1.00 0.40 0.75 0.20 1.40 0.32 4.50 0.89 0.21 2.40 0.70 0.10 1.20 1 0 1 0 0 0 0 0 0 0 1 0 0 0 0 1 0 1 0 0 0
  • 30. Aim 2 To validate brain maps and behavior-gene sets using external data from individuals with Autism Spectrum Disorder
  • 32. Subramanian, et. al, Gene set enrichment analysis: A knowledge-based approach for interpreting genome-wide expression profiles. PNAS 2005 102 (43) 15545-15550; published ahead of print September 30, 2005,doi:10.1073/pnas.0506580102
  • 39. Aim 3 To generate a complex network of genes and behaviors across multiple neuropsychiatric disorders, and functionally annotate this result