Location via proxy:   [ UP ]  
[Report a bug]   [Manage cookies]                
SlideShare a Scribd company logo
Presentación Carbon Masters- Foro Energético
Agenda 
Introduction 
•The Energy Trilemma 
•Scotland & Ecuador 
•Scotland’s journey towards a low carbon economy 
•The Building blocks 
- Policy Framework 
-Energy Innovation 
-Funding 
•Lessons for Ecuador
My Journey 
 1975 Liverpool University BSc Chemistry (Hons) 
 1975 to 2000 Procter & Gamble UK, Turkey & Germany 
 2000 to 2002 PricewaterhouseCoopers (UK) 
 2002 to 2008 IBM (Consulting, Software) 
 (2006 Al Gore, Stern Review, 2007 IPCC 4AR) 
 2008 to 2009 Edinburgh University. MSc Carbon Management 
 2009 - set up Carbon Masters Ltd 
 Carbon Masters helps organisations to cut their carbon 
emissions and build a profitable future based on innovative 
clean energy solutions.
Oficina Principal - Edimburgo, RU 
Carbon Masters 
Edinburgh Centre for Carbon Innovation 
The University of Edinburgh 
Edinburgh 
EH9 3JL 
Oficina en Asia - Bangalore, India 
Carbon Masters 
S-717, South Block, Manipal Centre 
Dickenson Road, Off M G Road, 
Bangalore – 560032 
Oficina América del Sur- Quito, Ecuador 
Carbon Masters 
Av. Humboldt N31-136 
y José Gómez 
Quito, Ecuador
The Global Energy Trilemma
 TheThe world of carbon 
6 
GHG emissions continue to rise globally
The cost of energy will only rise going forward 
Energy Costs 
UK Electricity Market Reform Consultation, Dec 2010 
Peak Oil 
http://www.peakoil.net/GiantOilFields.html 
+ 
Middle Class Consumers 
Source: World Bank 2009 
+ 
Decarbonisation 1 
UK proposed carbon floor price 
+ 
Decarbonisation 2 
Image: Paul Martin Eldridge / 
FreeDigitalPhotos.net 
Urbanisation 
UN World Population Prospects, 2008 
=
Scotland vs Ecuador 
Land Area: 78,777km2 283,560 Km2 
Population 5.2 million 15.7 million 
GDP $ 202 billion $91.0 billion 
Total exports (excl Oil 
and gas) $119bn $11.6bn 
Oil and Gas (% ) $ 47bn (28%) $14 bn (54%)
The Economic Benefits 
Scotland's low carbon market worth around £8.5 billion in 
2007-08 and forecast to rise to around £12 billion by 2015-16; 
Jobs in the low carbon sector in Scotland could grow by 4% 
a year to 2020, rising from 70,000 to 130,000, over 5% of the 
Scottish workforce; 
Scotland is already an exporter of low carbon technologies, 
with £845m worth of low carbon technologies exported in 
2009/10 mainly to China, Spain, Malaysia, India and Romania; 
Scotland can be the green energy capital of Europe, and 
offshore wind alone could bring an estimated £30 billion of 
inward investment, and up to 20,000 jobs; 
Sales of offshore electricity could value £14 billion by 2050, 
the equivalent of £2,700 for each person in Scotland;
Presentación Carbon Masters- Foro Energético
Climate Change (Scotland) Act 2009 
•Act passed unanimously by 
Scottish Parliament with 
strong support from 
business and civic society. 
•Act sets world-leading 
target for Greenhouse Gas 
reductions compared with 
1990: 
•42% by 2020 
•80% by 2050
Multiple national energy targets 
 Reduce final energy demand by 12% by 2020 
 100% of electricity demand from renewables by 2020 
 11% heat demand from renewables by 2020 
 30% total energy demand from renewables by 2020 
 500MW of community and locally owned renewables 
 No new thermal power stations without CCS fitted
Typical Developed Economy 2050 Fossil Fuel Based 
Carbon Emissions 
Reduce Demand via 
Demand management 
Energy efficiency 
Change consumer behaviour 
Decarbonize the electricity 
sector 
Decarbonize cars and vans 
Develop clean fossil fuels 
(carbon capture and storage)
Scotland's Total Emissions by Sector 
2011 
(51.28 MtCO2e)
Scotland’s Emissions Reduction 
Waste and 
Resource 
Efficiency 
At least 70% of all 
waste recycled by 
2025 
Transport 
Almost complete 
decarbonisation of road 
transport by 2050 
Homes and Communities 
Policies 
A step-change in provision of 
energy efficient homes to 2030 
Business, Industry and the 
Public Sector 
Significant progress in 
transforming energy use in 
industry, business and the public 
sectors by 2027 
Rural Land Use 
Enhanced natural carbon 
capture by 2027 
Energy 
A largely decarbonised 
electricity generation sector 
by 2030 
A largely decarbonised heat 
sector by 2050 with 
significant process by 2030
Emissions Reduction Policies and Proposals 
Energy 
30% of overall energy 
demand met by renewables 
by 2020 
Equivalent of at least 100% of 
gross electricity 
consumption met by 
renewables by 2020 
11% of heat demand met by 
renewables by 2020 
Reduce energy demand by 
12% by 2020 
At least 500 MW of local and 
community owned 
renewable energy by 2020 
Demonstrate carbon capture 
and storage
Emissions Reduction Policies and Proposals 
Homes and Communities Energy Efficiency 
•Smart Meters for gas and 
electricity in every home (UK) 
•Domestic Building Energy 
Standards 
•Green Deal (UK) 
•Energy Company 
Obligation (UK) 
•Green Homes Cashback 
Scheme 
•National Retrofit 
Programme 
Heating 
•Warm Homes Fund 
(renewable heating) 
•Renewable Heat Incentive 
(UK) 
•District Heating Loan Fund 
-38%* 
Home Energy 
Efficiency Programmes 
for Scotland (HEEPS) 
* Projected change from 1990 baseline
Emissions Reduction Policies and Proposals 
EU Emissions Trading 
System (large, intensive 
industries and aviation) 
Energy Efficiency 
•CRC Energy Efficiency 
Scheme (UK) 
•Smart Metering 
•Building Energy Standards 
•Non-domestic Green Deal (UK) 
•Green Investment Bank Loans 
•EU Products Policy 
(performance standards) 
•Public sector energy efficiency 
Heat 
•Renewable Heat Incentive (UK) 
•District Heating Loan Scheme 
Business, Industry and the 
Public Sector 
- 45%* 
* Projected change from 1990 baseline
Emissions Reduction Policies and Proposals 
Transport Decarbonising Vehicles 
•Emissions standards (EU) 
•Biofuels (UK Transport Fuel 
Obligation) 
•Public sector electric 
vehicles 
•Electric vehicle 
infrastructure 
•Green Bus Fund 
•EU ETS – aviation 
Sustainable Communities 
•Education – travel planning 
Business Efficiencies 
•Fuel efficient driving 
•Travel planning 
•Freight efficiencies 
- 7%* 
* Projected change from 1990 baseline
Emissions Reduction Policies and Proposals 
Waste and Resource 
Efficiency • 60% of household waste, 
recycled and/or prepared 
for re-use by 2020 
• Recycle 70% of all 
waste (including 
commercial and 
industrial waste) by 
2025 
• Maximum of 5% of all 
waste sent to landfill 
by 2025 
• Enhanced capture 
of landfill gas 
- 86%* 
* Projected change from 1990 baseline
Emissions Reduction Policies and Proposals 
Rural Land Use • Increase afforestation 
rate to 10kh per year 
• 90% uptake of 
fertiliser efficiency 
measures 
• Restoration of 
degraded peatland 
• Wood First – Timber 
Construction 
Programme 
- 
58%* 
* Projected change from 1990 baseline
Presentación Carbon Masters- Foro Energético
Electricity Generation by fuel 
Figure 4.1: Electricity generated in Scotland (GWh), 2000 to 2012 
60,000 
50,000 
40,000 
30,000 
20,000 
10,000 
0 
Electricity generated, GWh 
Other Thermal 
Other renewables 
Hydro natural flow 
Hydro pumped storage 
Oil 
Gas 
Coal * 
Nuclear 
*Coal includes a small amount of non-renewable waste. 
Source: DECC, Energy Trends, December 2013 
https://www.gov.uk/government/organisations/department-of-energy-climate-change/
Figure 4.4: Installed capacity of renewable electricity (MW), Scotland, 2000 - Q3 2013 
Installed capacity of renewables in Scotland 
Source: DECC, Energy Trends, December 2013 
https://www.gov.uk/government/organisations/department-of-energy-climate-change/ 
series/energy-trends
onwards wind has generated a more electricity than hydro. 
Figure 4.6: Electricity generated from renewables, Scotland, 2000-2012 
Electricity delivered in Scotland by renewables 
Source: DECC, Energy Trends, December 2013 
https://www.gov.uk/government/organisations/department-of-energy-climate-change/ 
series/energy-trends
household from 2005 to 2012. Key drivers of this trend include increased 
prices and improved energy efficiency of appliances. 
Domestic/Commercial Electricity Consumption 
Figure 5.3: Domestic electricity consumption per household (kWh), Scotland, 2005-2012 
Source: DECC, Sub-National Energy Consumption Statistics, December 2013 
https://www.gov.uk/government/collections/sub-national-electricity-consumption-data 
39 
…has fallen 
Source: DECC, Sub-National Energy Consumption Statistics, December 2013 
https://www.gov.uk/government/organisations/department-of-energy-climate-change/ 
series/sub-national-gas-consumption-data 
Figure 5.6 shows that domestic gas consumption per consumer decreased in Scotland by 26% between 2005 and 2012. Rising gas and improved energy efficiency in homes and boilers were contributing factors 
to this trend. 
Figure 5.6: Domestic gas consumption per consumer (kWh), Scotland, 2005-2012 
Domestic 
Commercial
Energy Targets – Summary of Progress 
ENERGY 
DEMAND 
HEAT 
TRANSPORT 
ELECTRICITY
Presentación Carbon Masters- Foro Energético
Off Shore wind farms- Scotland has 25% of Europe’s 
wind resource 
Bi Fab- Scottish company based in FIFE
On shore wind farms- Whitelee Wind Farm nr Glasgow 
The largest on-shore wind farm in 
the United Kingdom( 2nd in Europe) 
- 15 miles from Glasgow 
- 215 Siemens and Alstom wind 
turbines 
-Total capacity of 539 megawatts 
(MW) 
-Operational since 2009 extended 
in 2013 
-Provides electricity for 300,000 
homes
Wave& Tidal Technology- generating electricity from 
wave and tidal flows 
Scotland has an estimated 10% of 
Europe’s 
Wave and energy resource 
UK wave and tidal resurce 
Can potentially provide up to 20% 
of the UK’s electricity demand 
= 30 to 50 GW installed capacity 
Wave power is more predictable 
than wind power and increases in 
the winter where in the UK electricity 
demand peaks 
AIM 
Zero carbon emissions at less than 
5p/Kwh
Saltires Duck 1974- University of Edinburgh 
Pelamis Wave Power 
Company based in Edinburgh 
developed a device based on duck 
design 
Now Operating in Orkney
Test tank makes waves in 
marine energy 
A world-class testing facility 
for marine energy devices 
at the University of Edinburgh 
-The circular pool, 25 metres across 
and two metres deep 
-Recreates waves and currents from 
coastlines around the UK, Europe and 
beyond. 
The FloWave Ocean Energy 
Research Facility is managed 
by University subsidiary 
company FloWave TT Ltd. 
It can simulate scale 
version equivalents of waves 
up 
to 28 metres high and currents of 
up to 14 knots, 
using 2.4 million litres of water.
Waste to energy Solutions 
Biogas is 
purified & 
bottled for 
electricity & 
heat
Presentación Carbon Masters- Foro Energético
Funding Sources for the transition to a low carbon 
economy 
 1 Green Investment Bank (UK) 
 Head Quarters in Edinburgh Scotland The first bank of its type in the world. 
 Created by the UK Government, our sole Shareholder, and capitalized with 
an initial £3.8bn of public funds. 
 They use this finance to back green projects on commercial terms and 
mobilise other private sector investments into the Scottish green economy 
 
 2. Green Deal ( Domestic and non Domestic ) 
 Loans to invest in energy efficiency measures paid for by the saving in the 
energy consumed. 
 3. Public Sector Energy efficiency Fund 
 Public sector organisations can access capital to invest in energy efficiency 
measures where repayments come from the savings in energy expenditure. 
Invest to save.
Funding Sources for the transition to a low carbon 
economy 
 4.Scottish Green Bus Fund( $ 7million per year) 
 Bus companies ( private and public) can apply for Grants to invest in 
Low Carbon Buses ( Electric , hybrid , hydrogen ) 
 5. Climate challenge fund ( $ 15 million per year) 
Grants of up to $ 225,000 available to support COMMUNITY led 
projects to 
Reduce carbon emissions 
Make community improvements. 
Help communities adapt to the impacts of climate 
change 
To date $ 100 million has been awarded to 697 communities across 
Scotland
Lessons for Ecuador 
 Small countries can still play a big role in the transition to a 
low carbon economy( even those very dependent today on 
Fossil fuels ) 
 The innovation that this can bring can create new low 
carbon products and services providing new business 
opportunities, more jobs and increased energy security 
 The road to a post oil low carbon future is a challenging one 
but Scotland has shown that it can be done.

More Related Content

Presentación Carbon Masters- Foro Energético

  • 2. Agenda Introduction •The Energy Trilemma •Scotland & Ecuador •Scotland’s journey towards a low carbon economy •The Building blocks - Policy Framework -Energy Innovation -Funding •Lessons for Ecuador
  • 3. My Journey  1975 Liverpool University BSc Chemistry (Hons)  1975 to 2000 Procter & Gamble UK, Turkey & Germany  2000 to 2002 PricewaterhouseCoopers (UK)  2002 to 2008 IBM (Consulting, Software)  (2006 Al Gore, Stern Review, 2007 IPCC 4AR)  2008 to 2009 Edinburgh University. MSc Carbon Management  2009 - set up Carbon Masters Ltd  Carbon Masters helps organisations to cut their carbon emissions and build a profitable future based on innovative clean energy solutions.
  • 4. Oficina Principal - Edimburgo, RU Carbon Masters Edinburgh Centre for Carbon Innovation The University of Edinburgh Edinburgh EH9 3JL Oficina en Asia - Bangalore, India Carbon Masters S-717, South Block, Manipal Centre Dickenson Road, Off M G Road, Bangalore – 560032 Oficina América del Sur- Quito, Ecuador Carbon Masters Av. Humboldt N31-136 y José Gómez Quito, Ecuador
  • 5. The Global Energy Trilemma
  • 6.  TheThe world of carbon 6 GHG emissions continue to rise globally
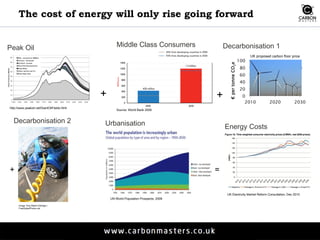
  • 7. The cost of energy will only rise going forward Energy Costs UK Electricity Market Reform Consultation, Dec 2010 Peak Oil http://www.peakoil.net/GiantOilFields.html + Middle Class Consumers Source: World Bank 2009 + Decarbonisation 1 UK proposed carbon floor price + Decarbonisation 2 Image: Paul Martin Eldridge / FreeDigitalPhotos.net Urbanisation UN World Population Prospects, 2008 =
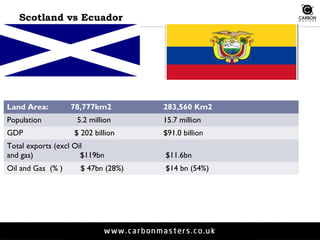
  • 8. Scotland vs Ecuador Land Area: 78,777km2 283,560 Km2 Population 5.2 million 15.7 million GDP $ 202 billion $91.0 billion Total exports (excl Oil and gas) $119bn $11.6bn Oil and Gas (% ) $ 47bn (28%) $14 bn (54%)
  • 9. The Economic Benefits Scotland's low carbon market worth around £8.5 billion in 2007-08 and forecast to rise to around £12 billion by 2015-16; Jobs in the low carbon sector in Scotland could grow by 4% a year to 2020, rising from 70,000 to 130,000, over 5% of the Scottish workforce; Scotland is already an exporter of low carbon technologies, with £845m worth of low carbon technologies exported in 2009/10 mainly to China, Spain, Malaysia, India and Romania; Scotland can be the green energy capital of Europe, and offshore wind alone could bring an estimated £30 billion of inward investment, and up to 20,000 jobs; Sales of offshore electricity could value £14 billion by 2050, the equivalent of £2,700 for each person in Scotland;
  • 11. Climate Change (Scotland) Act 2009 •Act passed unanimously by Scottish Parliament with strong support from business and civic society. •Act sets world-leading target for Greenhouse Gas reductions compared with 1990: •42% by 2020 •80% by 2050
  • 12. Multiple national energy targets  Reduce final energy demand by 12% by 2020  100% of electricity demand from renewables by 2020  11% heat demand from renewables by 2020  30% total energy demand from renewables by 2020  500MW of community and locally owned renewables  No new thermal power stations without CCS fitted
  • 13. Typical Developed Economy 2050 Fossil Fuel Based Carbon Emissions Reduce Demand via Demand management Energy efficiency Change consumer behaviour Decarbonize the electricity sector Decarbonize cars and vans Develop clean fossil fuels (carbon capture and storage)
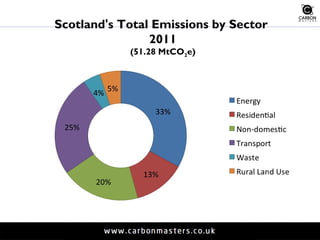
  • 14. Scotland's Total Emissions by Sector 2011 (51.28 MtCO2e)
  • 15. Scotland’s Emissions Reduction Waste and Resource Efficiency At least 70% of all waste recycled by 2025 Transport Almost complete decarbonisation of road transport by 2050 Homes and Communities Policies A step-change in provision of energy efficient homes to 2030 Business, Industry and the Public Sector Significant progress in transforming energy use in industry, business and the public sectors by 2027 Rural Land Use Enhanced natural carbon capture by 2027 Energy A largely decarbonised electricity generation sector by 2030 A largely decarbonised heat sector by 2050 with significant process by 2030
  • 16. Emissions Reduction Policies and Proposals Energy 30% of overall energy demand met by renewables by 2020 Equivalent of at least 100% of gross electricity consumption met by renewables by 2020 11% of heat demand met by renewables by 2020 Reduce energy demand by 12% by 2020 At least 500 MW of local and community owned renewable energy by 2020 Demonstrate carbon capture and storage
  • 17. Emissions Reduction Policies and Proposals Homes and Communities Energy Efficiency •Smart Meters for gas and electricity in every home (UK) •Domestic Building Energy Standards •Green Deal (UK) •Energy Company Obligation (UK) •Green Homes Cashback Scheme •National Retrofit Programme Heating •Warm Homes Fund (renewable heating) •Renewable Heat Incentive (UK) •District Heating Loan Fund -38%* Home Energy Efficiency Programmes for Scotland (HEEPS) * Projected change from 1990 baseline
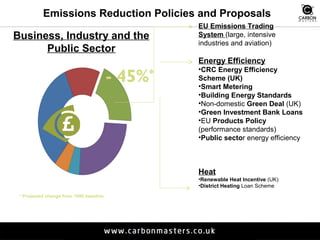
  • 18. Emissions Reduction Policies and Proposals EU Emissions Trading System (large, intensive industries and aviation) Energy Efficiency •CRC Energy Efficiency Scheme (UK) •Smart Metering •Building Energy Standards •Non-domestic Green Deal (UK) •Green Investment Bank Loans •EU Products Policy (performance standards) •Public sector energy efficiency Heat •Renewable Heat Incentive (UK) •District Heating Loan Scheme Business, Industry and the Public Sector - 45%* * Projected change from 1990 baseline
  • 19. Emissions Reduction Policies and Proposals Transport Decarbonising Vehicles •Emissions standards (EU) •Biofuels (UK Transport Fuel Obligation) •Public sector electric vehicles •Electric vehicle infrastructure •Green Bus Fund •EU ETS – aviation Sustainable Communities •Education – travel planning Business Efficiencies •Fuel efficient driving •Travel planning •Freight efficiencies - 7%* * Projected change from 1990 baseline
  • 20. Emissions Reduction Policies and Proposals Waste and Resource Efficiency • 60% of household waste, recycled and/or prepared for re-use by 2020 • Recycle 70% of all waste (including commercial and industrial waste) by 2025 • Maximum of 5% of all waste sent to landfill by 2025 • Enhanced capture of landfill gas - 86%* * Projected change from 1990 baseline
  • 21. Emissions Reduction Policies and Proposals Rural Land Use • Increase afforestation rate to 10kh per year • 90% uptake of fertiliser efficiency measures • Restoration of degraded peatland • Wood First – Timber Construction Programme - 58%* * Projected change from 1990 baseline
  • 23. Electricity Generation by fuel Figure 4.1: Electricity generated in Scotland (GWh), 2000 to 2012 60,000 50,000 40,000 30,000 20,000 10,000 0 Electricity generated, GWh Other Thermal Other renewables Hydro natural flow Hydro pumped storage Oil Gas Coal * Nuclear *Coal includes a small amount of non-renewable waste. Source: DECC, Energy Trends, December 2013 https://www.gov.uk/government/organisations/department-of-energy-climate-change/
  • 24. Figure 4.4: Installed capacity of renewable electricity (MW), Scotland, 2000 - Q3 2013 Installed capacity of renewables in Scotland Source: DECC, Energy Trends, December 2013 https://www.gov.uk/government/organisations/department-of-energy-climate-change/ series/energy-trends
  • 25. onwards wind has generated a more electricity than hydro. Figure 4.6: Electricity generated from renewables, Scotland, 2000-2012 Electricity delivered in Scotland by renewables Source: DECC, Energy Trends, December 2013 https://www.gov.uk/government/organisations/department-of-energy-climate-change/ series/energy-trends
  • 26. household from 2005 to 2012. Key drivers of this trend include increased prices and improved energy efficiency of appliances. Domestic/Commercial Electricity Consumption Figure 5.3: Domestic electricity consumption per household (kWh), Scotland, 2005-2012 Source: DECC, Sub-National Energy Consumption Statistics, December 2013 https://www.gov.uk/government/collections/sub-national-electricity-consumption-data 39 …has fallen Source: DECC, Sub-National Energy Consumption Statistics, December 2013 https://www.gov.uk/government/organisations/department-of-energy-climate-change/ series/sub-national-gas-consumption-data Figure 5.6 shows that domestic gas consumption per consumer decreased in Scotland by 26% between 2005 and 2012. Rising gas and improved energy efficiency in homes and boilers were contributing factors to this trend. Figure 5.6: Domestic gas consumption per consumer (kWh), Scotland, 2005-2012 Domestic Commercial
  • 27. Energy Targets – Summary of Progress ENERGY DEMAND HEAT TRANSPORT ELECTRICITY
  • 29. Off Shore wind farms- Scotland has 25% of Europe’s wind resource Bi Fab- Scottish company based in FIFE
  • 30. On shore wind farms- Whitelee Wind Farm nr Glasgow The largest on-shore wind farm in the United Kingdom( 2nd in Europe) - 15 miles from Glasgow - 215 Siemens and Alstom wind turbines -Total capacity of 539 megawatts (MW) -Operational since 2009 extended in 2013 -Provides electricity for 300,000 homes
  • 31. Wave& Tidal Technology- generating electricity from wave and tidal flows Scotland has an estimated 10% of Europe’s Wave and energy resource UK wave and tidal resurce Can potentially provide up to 20% of the UK’s electricity demand = 30 to 50 GW installed capacity Wave power is more predictable than wind power and increases in the winter where in the UK electricity demand peaks AIM Zero carbon emissions at less than 5p/Kwh
  • 32. Saltires Duck 1974- University of Edinburgh Pelamis Wave Power Company based in Edinburgh developed a device based on duck design Now Operating in Orkney
  • 33. Test tank makes waves in marine energy A world-class testing facility for marine energy devices at the University of Edinburgh -The circular pool, 25 metres across and two metres deep -Recreates waves and currents from coastlines around the UK, Europe and beyond. The FloWave Ocean Energy Research Facility is managed by University subsidiary company FloWave TT Ltd. It can simulate scale version equivalents of waves up to 28 metres high and currents of up to 14 knots, using 2.4 million litres of water.
  • 34. Waste to energy Solutions Biogas is purified & bottled for electricity & heat
  • 36. Funding Sources for the transition to a low carbon economy  1 Green Investment Bank (UK)  Head Quarters in Edinburgh Scotland The first bank of its type in the world.  Created by the UK Government, our sole Shareholder, and capitalized with an initial £3.8bn of public funds.  They use this finance to back green projects on commercial terms and mobilise other private sector investments into the Scottish green economy   2. Green Deal ( Domestic and non Domestic )  Loans to invest in energy efficiency measures paid for by the saving in the energy consumed.  3. Public Sector Energy efficiency Fund  Public sector organisations can access capital to invest in energy efficiency measures where repayments come from the savings in energy expenditure. Invest to save.
  • 37. Funding Sources for the transition to a low carbon economy  4.Scottish Green Bus Fund( $ 7million per year)  Bus companies ( private and public) can apply for Grants to invest in Low Carbon Buses ( Electric , hybrid , hydrogen )  5. Climate challenge fund ( $ 15 million per year) Grants of up to $ 225,000 available to support COMMUNITY led projects to Reduce carbon emissions Make community improvements. Help communities adapt to the impacts of climate change To date $ 100 million has been awarded to 697 communities across Scotland
  • 38. Lessons for Ecuador  Small countries can still play a big role in the transition to a low carbon economy( even those very dependent today on Fossil fuels )  The innovation that this can bring can create new low carbon products and services providing new business opportunities, more jobs and increased energy security  The road to a post oil low carbon future is a challenging one but Scotland has shown that it can be done.

Editor's Notes

  1. .