Presentation 3Q13
•
0 likes•363 views

CCR reported its 3Q13 earnings results. Consolidated traffic increased 7.4% compared to 3Q12. Adjusted EBITDA on the same basis increased 18.1% to R$922 million, with margins of 68.1%. Interim dividends of R$0.68 per share were approved. Subsequent events included the transfer of 10% of STP shares to Raízen and winning the concession for the Salvador metro system. The presentation discussed financial highlights, traffic trends, costs, debt levels and investments for the quarter.
Report
Share


Presentation 3Q13
- 2. Disclaimer This presentation may contain certain forward-looking projections and trends that neither represent realized financial results nor historical information. These forward-looking projections and trends are subject to risk and uncertainty, and future results may differ materially from the projections. Many of these risks and uncertainties are related to factors that are beyond CCR’s ability to control or to estimate, such as market conditions, currency swings, the behavior of other market participants, the actions of regulatory agencies, the ability of the company to continue to obtain financing, changes in the political and social context in which CCR operates or economic trends or conditions, including changes in the rate of inflation and changes in consumer confidence on a global, national or regional scale. Readers are advised not to fully trust these projections and trends. CCR is not obliged to publish any revision of these projections and trends that should reflect new events or circumstances after the realization of this presentation. 2
- 4. 3Q13 Highlights TRAFFIC: Consolidated traffic increased by 7.4% compared to 3Q12 and 5.2% compared to 9M12. TOLLS COLLECTED BY ELECTRONIC MEANS: The number of STP users expanded 13.9% compared to September 2012, reaching 4,106 thousand active tags. ADJUSTED EBITDA: Adjusted EBITDA on the same basis1 increased by 18.1%, reaching 68.1% margin in 3Q13 and 13.7% in 9M13, with margin of 65.8%. DIVIDENDS: Approval of interim dividends of R$ 0.68 per share to be paid from October 31, 2013. 1 Adjusted EBITDA excludes Curaçao International Airport. 4
- 5. Subsequent Event STP: • On October 3, 2013, was financially concluded the Share Purchase Agreement and Other Covenants and the effective transfer of 10% of STP’s capital stock to Raízen. CCR now holds 34.23723% of STP’s capital stock. SALVADOR AND LAURO DE FREITAS METRO SYSTEM: • On October 15, 2013, CCR entered into a Concession Agreement of the Salvador and Lauro de Freitas Metro System. 5
- 6. Financial Highlights Strong EBITDA Margin expansion of mature portfolio and Net Income expansion of 27.4% ... Financial Indicators (R$ MM) 3Q12 Adjusted EBIT Mg. 3 9M13 Chg % 1,377.1 10.9% 3,408.7 3,830.1 12.4% 723.0 21.7% 1,694.2 1,917.6 13.2% 47.8% 2 9M12 594.0 EBIT Chg % 1,241.9 Net Revenues 1 3Q13 52.5% +4.7 p.p. 49.7% 50.1% +0.4 p.p. 594.0 720.2 21.2% 1,694.2 1,915.1 13.0% EBIT Mg. on the same basis 3 47.8% 53.2% +5.4 p.p. 49.7% 50.4% +0.7 p.p. Adjusted EBITDA 4 Adjusted EBITDA Mg. 780.5 928.5 19.0% 2,199.0 2,509.0 14.1% 62.8% 67.4% +4.6 p.p. 64.5% 65.5% +1.0 p.p. 780.5 922.0 18.1% 2,199.0 2,500.7 13.7% 62.8% 68.1% +5.3 p.p. 64.5% 65.8% +1.3 p.p. 316.8 403.5 27.4% 829.7 1,044.6 25.9% EBIT on the same basis Adjusted EBITDA on the same basis 3 Adjusted EBITDA Mg. on the same basis Net Income 3 1 Net Operational Revenues excludes Construction Revenues. ² The adjusted EBIT margin was calculated by dividing the EBIT by net revenues, excluding construction revenues, because this is an IFRS requirement, whose counterpart in the same amount impacts total costs. ³ Adjustment excluding Curaçao International Airport. 4 Calculated without non cash expenses: depreciation and amortization, maintenance provision and settlement of prepaid expenses. ... result of the solid operating performance of the portfolio. 6
- 7. Traffic – Quarter Change (Proforma) Consolidated – Equivalent Vehicle 275,606 248,936 256,560 3Q11 3Q12 224,970 178,663 156,084 3Q08 3Q09 3Q10 3Q13 Revenue and traffic 3Q13 X 3Q12 (%) 13.1 10.2 10.1 9.2 7.7 7.0 NovaDutra 5.8 1.8 RodoNorte Ponte Traffic * 9.9 10.6 4.0 2.4 AutoBAn 7.4 7.4 5.6 5.0 8.7 8.7 Information including Renovias which is contemplated in the proforma method. ViaLagos ViaOeste Toll Revenues Renovias2 RodoAnel SPVias 7
- 8. Revenue Analysis (Proforma) Gross Revenue Breakdown Gross Operating Revenues Renovias 2.1% Controlar ViaLagos Ponte 1.5% 1.3% 2.3% Barcas Others 2.4% 0.2% ViaQuatro 3.0% RodoAnel AutoBan 3.1% 28.6% STP 3.5% Airports 4.8% 7% 9% 13% 17% 93% 91% 87% 83% 3Q10 3Q11 3Q12 3Q13 SPVias 7.9% NovaDutra 17.0% RodoNorte 9.1% ViaOeste 13.2% Toll Payment Means 39% 34% 32% 30% 61% 66% 68% 70% 3Q10 3Q11 3Q12 Others 3Q13 Electronic * Including the proportional results of jointly-owned subsidiaries. Cash 8
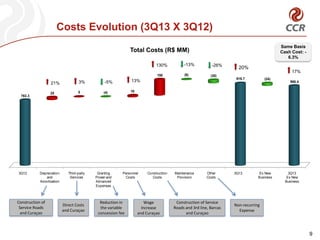
- 9. Costs Evolution (3Q13 X 3Q12) Same Basis Cash Cost: 6.3% Total Costs (R$ MM) 130% 150 21% 3Q12 -5% 5 (4) (30) 20% 17% 919.7 (24) 16 Depreciation and Amortization Construction of Service Roads and Curaçao (6) -26% 13% 25 763.3 3% -13% Third-party Services Direct Costs and Curaçao Granting Power and Advanced Expenses Personnel Costs Reduction in the variable concession fee Construction Costs Wage Increase and Curaçao Maintenance Provision Other Costs Construction of Service Roads and 3rd line, Barcas and Curaçao 3Q13 Ex New Business 895.4 3Q13 Ex New Business Non-recurring Expense 9
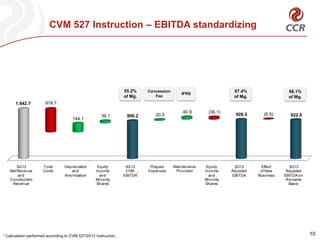
- 10. CVM 527 Instruction – EBITDA standardizing 55.2% of Mg. 1,642.7 1 67.4% of Mg. IFRS 68.1% of Mg. 919.7 144.1 3Q13 Net Revenue and Construction Revenue Concession Fee Total Costs Depreciation and Amortization 39.1 906.2 Equity Income and Minority Shares 3Q13 CVM 1 EBITDA Calculation performed according to CVM 527/2012 Instruction. 20.5 Prepaid Expenses 40.9 Maintenance Provision (39.1) Equity Income and Minority Shares 928.5 3Q13 Adjusted EBITDA (6.5) Effect of New Business 922.0 3Q13 Adjusted EBITDA on the same Basis 10
- 11. Financial Results Highlight Change in financial results reflects the increase in the average SELIC rate ... Net Financial Result (R$ MM) - Exchange Rate Variation on Loans, Financing and Debentures - Present Value Adjustment of Maintenance Prov ision - Interest on Loans, Financing and Debentures - Inv estment Income and Other Income - Others¹ Var % 9M12 9M13 (162.1) 9.1% (492.8) (452.2) -8.2% (22.8) 50.0% (14.3) (16.7) 16.8% (4.1) -26.8% (21.2) (16.9) -20.3% (1.8) -150.0% (10.1) (17.9) 77.2% (11.5) (10.7) -7.0% (38.5) (32.7) -15.1% (151.4) (160.5) 6.0% (481.7) (429.7) -10.8% 42.0 44.7 6.4% 111.6 92.6 -17.0% (10.5) - Monetary Variation (15.2) (5.6) - Income from Hedge Operation 3Q13 (148.6) Net Financial Result 3Q12 3.6 Var % (6.9) -34.3% (38.6) (30.9) -19.9% ¹ Comssions, fees, taxes, fines and interest on taxes i ... on the other hand was benefited by higher interest capitalization for the period. 11
- 12. Debt in September 30, 2013 Gross debt by indexer USD TJLP IPCA 2.8% 2.5% IGP-M 0.4% 3.7% • Total Gross Debt: R$ 7.4 Bi • Net Debt / EBITDA: 1.9x... CDI 90.6% Amortization Schedule (R$ ‘000) 3,190 1,643 1,245 712 107 434 2013 3,129 135 1,366 630 1,185 450 2014 2015 CDI USD 2016 Others From 2017 12
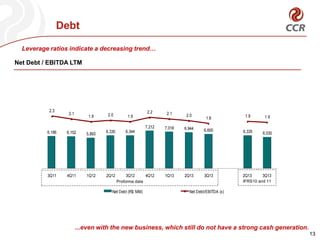
- 13. Debt Leverage ratios indicate a decreasing trend… Net Debt / EBITDA LTM 12.000 2.3 10.000 3,0 2.1 1.9 2.0 2.2 1.9 7,212 8.000 6,186 6,152 6.000 5,893 6,330 6,344 2.1 7,018 2.0 6,944 1.8 1.9 6,600 6,335 1.9 2,5 2,0 1,5 6,030 1,0 0,5 4.000 0,0 -0,5 2.000 -1,0 0 -1,5 3Q11 4Q11 1Q12 2Q12 3Q12 4Q12 Proforma data Net Debt (R$ MM) 1Q13 2Q13 3Q13 2Q13 3Q13 IFRS10 and 11 Net Debt/EBITDA (x) ...even with the new business, which still do not have a strong cash generation. 13
- 14. 3Q13 Realized Investments and Maintenance Performed maintenance Performed investments R$ MM Improvements Equipments and Others Total Maintenance Cost 3Q13 AutoBAn NovaDutra ViaOeste RodoNorte (100%) Ponte ViaLagos SPVias RodoAnel (100%) SAMM Curaçao Barcas Other1 Consolidated 9M13 3Q13 9M13 3Q13 9M13 3Q13 9M13 107.7 36.2 12.3 13.4 1.9 9.8 42.8 8.4 2.2 2.7 12.5 -4.6 245.3 195.2 88.2 25.7 33.4 9.1 16.1 88.8 17.4 10.2 3.5 21.1 -9.2 499.5 7.5 6.3 3.5 2.6 1.6 1.1 5.0 1.3 14.9 0.0 4.2 33.9 81.9 13.7 14.8 6.3 3.8 5.3 2.3 12.4 2.6 21.8 0.0 8.8 50.8 142.6 115.2 42.5 15.8 16.0 3.5 10.9 47.8 9.7 17.1 2.7 16.7 29.3 327.2 208.9 103.0 32.0 37.2 14.4 18.4 101.1 20.0 32.0 3.5 29.8 41.6 641.9 7.9 17.1 5.9 7.3 0.9 0.1 6.3 0.0 0.0 0.0 0.0 0.0 45.5 21.3 51.2 10.1 21.6 1.6 0.2 16.8 0.0 0.0 0.0 0.0 0.0 122.8 1 - Includes CCR, MTH, CPC, CPCSP and Eliminations. 14
- 15. Dividends (Cash) Commitment to pay at least 50% of net income as dividends to shareholders The Company’s Executive Board approved interim dividend payments of R$0.68 per share. 7,0% 7,0% 127% 127% 92% 92% 6,0% 6,0% 130% 130% 90% 90% 90% 90% 85% 85% 85% 85% 80% 80% 65% 61% 58% 61% 65% 58% 5,0% 5,0% 16% 16% 4,0% 4,0% 5,0% 5.0% 4,6% 4,7% 4.6% 4.7% 4,8% 4.8% 4,2% 4.2% 30% 30% 3,9% 3.9% 3,8% 3,9% 3.8% 3.9% 3,7% -20% 3.7% -20% 1,177 3,0% 3,0% . 2,0% 2,2% 2,0% 2.2%1 1 2 2 3 Div. Yield Div. Yield 6 5 5 6 714 4 4 6% 61% 58% 263 580 92% 547 500 85% 127% 672 2% 2% 1 5% 1 Considers 2006 5% 3 the average share price in the year 2008 Div. Yield 4 5 30% 2013 Dividends 4% 4% 2007 Net Income 2 Complementary 80% 4% 2005 Interim 5% 4% 2004 0.68 90% 85% 4% 2003 130% 65% 5% 183 7 709 16% 3% -70% -70% 0.06 3 7% 5% Payout 899 8 Payout 9 10 8 9 10 7 2013 Cash dividends paid per share 2009 2010 1 2011 2012 Payout 6 7 8 -20% -70% 9 15
- 16. Track Record CCR Track Record: diversification and new bids Milestone ViaQuatro (2006) Concession Awarded AutoBAn + ViaOeste Concession Extension (2006) RodoNorte (2005) Acquisition ViaOeste (October 2004) Concession Extension Follow-on (April 2004) STP (2003) IPO (2002) USA (2007) Via Lagos Concession Extension (2011) RenoVias (2008) RodoAnel (2008) SP VIAS (2010) Controlar (2009) Follow-on (2009) • Airports: Quito, San José and Curaçao •Barcas • Transolímpica (2012) • VLT • Increase in Curaçao stake • Salvador Subway System (2013) 16
- 17. Thank you 17