Location via proxy:   [ UP ]  
[Report a bug]   [Manage cookies]                
SlideShare a Scribd company logo
Earnings Results
4Q12 and the year of 2012
Disclaimer


This presentation may contain certain forward-looking projections and trends that neither
represent realized financial results nor historical information.

These forward-looking projections and trends are subject to risk and uncertainty, and
future results may differ materially from the projections. Many of these risks and
uncertainties are related to factors that are beyond CCR’s ability to control or to estimate,
such as market conditions, currency swings, the behavior of other market participants, the
actions of regulatory agencies, the ability of the company to continue to obtain financing,
changes in the political and social context in which CCR operates or economic trends or
conditions, including changes in the rate of inflation and changes in consumer confidence
on a global, national or regional scale.

Readers are advised not to fully trust these projections and trends. CCR is not obliged to
publish any revision of these projections and trends that should reflect new events or
circumstances after the realization of this presentation.


                                                                                                2
Agenda


   Highlights


   Results Analysis


   Perspectives


                      3
4Q12 Highlights


                      NET REVENUE:
                      Growth of 15.2% compared to 4Q11.


                       EBITDA:
                       Expansion of 12.0% of Adjusted EBITDA1, reaching R$ 881.8 million.


                       NET INCOME:
                       Amounted to R$ 347.5 million (+17,9%), due to higher cash generation and lower financial
                       expenses.


                       TOLLS COLLECTED BY ELECTRONIC MEANS:
                       The toll charges collected by this means accounted for 66.7% of the total toll revenue and the
                       number of STP users expanded 16.2% compared to December 2011, reaching 3,770
                       thousand active tags.


1 Calculation   including the non-cash expenses: depreciation and amortization, provision for maintenance and allocation of anticipated concession grant expenses.   4
Subsequent Event


 On February 19, 2013 the company reported to its shareholders and the market in general
  that on that date, together with its partners in the Quiport concessionaire: AECON, Airport
  Development Corporation (ADC) and HAS Development Corporation (HAS-DC), it had
  inaugurated the new International Airport of Quito, Ecuador.


 CCR’s Management proposed a supplemental dividends distribution to its shareholders
  referring to the fiscal year of 2012, in the amount of R$ 0.0570773 per share, totaling R$
  100,775 thousand, amount to be submitted for approval at the General Shareholders
  Meeting (GSM) scheduled for April 18, 2013. Considering the intermediate dividends paid
  on October 31, 2012, in the amount of R$ 953,417 thousand, representing R$ 0.54 per
  share, will result in a payout for the fiscal year of 2012 of 89.54%.


                                                                                                5
Earnings Highlights
Net Income expansion of 17.9% despite the temporary contraction of Adjusted EBITDA Mg...


   Financial Indicators (R$ MM)                                       4Q11           4Q12           Chg %             2011           2012          Chg %
   Net Revenues 1                                                   1,225.4        1,411.9           15.2%        4,577.6         5,196.7          13.5%
   EBIT                                                              659.6          679.7             3.0%        2,277.0        2,497.4             9.7%
                           2
   Adjusted EBIT Mg.                                                 53.8%          48.1%         -5.7 p.p.         49.7%          48.1%         -1.6 p.p.
                                  3
   EBIT on the same basis                                            659.6          688.1             4.3%        2,277.0        2,514.9           10.4%
                                          3
   EBITD Mg. on the same basis                                       53.8%          50.9%         -2.9 p.p.         49.7%          49.5%         -0.2 p.p.
   Adjusted EBITDA 4                                                 787.5          881.8            12.0%        2,933.8        3,271.8           11.5%
   Adjusted EBITDA Mg.                                               64.3%          62.5%         -1.8 p.p.         64.1%          63.0%         -1.1 p.p.
                                                  3
   Adjusted EBITDA on the same basis                                 787.5          879.8            11.7%        2,933.8        3,267.4           11.4%
                                                        3
   Adjusted EBITDA Mg. on the same basis                             64.3%          65.1%        +0.8 p.p.          64.1%          64.3%        +0.2 p.p.
   Net Income                                                        294.7          347.5            17.9%          899.4        1,177.3           30.9%
   1 Net Operational Revenues excludes Construction Revenues.
   ² The adjusted EBIT margin was calculated by dividing the EBIT by net revenues, excluding construction revenues, because this is an IFRS requirement,
   whose counterpart in the same amount impacts total costs.
   ³ Adjustment excluding additional business in 2012: the international airports of Quito, San José and Curaçao, Transolímpica and Barcas, which still have
   not yet reached maturity.
   4 Adjusted EBITDA was calculated by the sum of net revenues and construction revenues, cost of provided services, administrative expenses, depreciation

   and amortization, maintenance provision and settlement of prepaid expenses.


                                                                            ...due to new business addition in the initial phase .
                                                                                                                                                               6
CVM 527 Instruction – EBITDA standardizing


         1,667              987                                               Concession
                                                                                                     IFRS
                                                                                 Fee

                                                                                                     32                882                2                880
                                              150               830                21


        4Q12             Total          Depreciation          4Q12            Prepaid        Maintenance           4Q12             Effect of           4Q12
    Net Revenue          Costs             and                CVM            Expenses         Provision           Adjusted            New             Adjusted
         and                            Amortization         EBITDA1                                              EBITDA            Business 2       EBITDA on
    Construction                                                                                                                                      the same
     Revenue                                                                                                                                            Basis 2


1 Calculation performed according to CVM 527/2012 Instruction.
² Adjustment excluding business added in 2012: International Airports of Quito, San José and Curaçao, Transolímpica and Barcas, which have not reached maturity yet.   7
Traffic – Quarter Change
Consolidated – Equivalent Vehicle


                                                                                              247,459              255,153
                                                                            237,103

                                                      186,186
                                  155,765
           145,207


               4Q07               4Q08                4Q09                   4Q10              4Q11                    4Q12
Revenue and traffic 4Q12 X 4Q11 (%)

                                         14.3                                                                                       14.6
                                                                12.6 13.3
                                   9.8                                                                                        9.8
         8.1                                          8.8                                           8.3          8.1
                            6.6
   4.1                                                                                 4.8
                                                                                              3.8
                      0.9                       2.1
                                                                                 0.9                       0.9


   AutoBAn        NovaDutra       RodoNorte     Ponte           ViaLagos       ViaOeste      Renovias     RodoAnel            SPVias

                                                      Traffic               Toll Revenues                                                  8
Revenue Analysis
Gross Operating Revenues                                Revenue Breakdown
                      Aeroportos ViaLagos
        Renovias                            Controlar              7%          8%            13%
           2.2%
                         1.7%      1.5%                    7%
                                              1.2%
       Barcas                           Others
        2.3%                              0.1%
 Ponte
  2.6%
 ViaQuatro
    2.8%                             AutoBAn
 RodoAnel                             29,0%                93%     93%         92%           87%
   3.2%      SPVias
              8.2%
    STP
    3.5%     RodoNorte
                                    NovaDutra
               9.0%
                                      18.9%
                       ViaOeste                           4Q09    4Q10         4Q11          4Q12
                        13.8%

                                                                     Toll   Others
Revenue Indexer                                         Payment
                              IGPM
                               3%

                                                           42%     40%         35%           33%


                                                           58%     60%         65%           67%

                             IPCA
                              97%
                                                          4Q09    4Q10         4Q11          4Q12
                                                                                                    9
                                                                  Electronic          Cash
Costs Evolution (4Q12 X 4Q11)

                                                                               Total Costs (R$ MM)


                                                                                                                                  27%              39%
                                                                                                                 n.m.
                                                                                                 76%                               25              987               (108)
                                                                                                                  34                                                            23%
                                                                                                110
                                                                                32%
                                               18%              2%                                                                                                              879
                              37%                                               37
                                               28               2
                              40
             711


          4Q11         Depreciation       Third-party      Granting        Personnel       Construction     Maintenance         Other            4Q12              Ex New      4Q12
                                                                                                                                                                         1
                          and              Services       Power and         Costs            Costs           Provision          Costs                             Business    Ex New
                                                                                                                                                                                    1
                       Amortization                       Advanced                                                                                                           Business
                                                          Expenses

                                      Maintenance           New Business,              New Business
                                      Projects and            Bargaining                   and
          Construction of              Consulting           Agreement and                                         Review of
                                                                                       Construction                                          New Business
           Service Roads                Services                SPVias                                         Maintenance Cicle
                                                                                         Works


1 – Effects of the consolidation of results of the new business added in 2012: International Airports of Quito, San José and Curaçao, Transolímpica and Barcas.
                                                                                                                                                                                        10
Revenue and EBITDA evolution (R$ MM)
         Net Revenue Ex Construction Revenue

                                                                                 126                1,412                 60                                      +10,3% of 4Q12 Adjusted
                                                                                                                                             1,351
                                                                                                                                                                  Net Revenue vs 4Q11
                                                             60
                                        1,225


                                     4Q11                Effect               4Q11                4Q12                Effect              4Q12
                                      Net                of New              Portfolio             Net                of New            Adjusted
         EBITDA                     Revenue             Business             Addition            Revenue             Business          Net Revenue


                                                                                                Adjusted                           Adjusted EBITDA Mg.
                                                                                               EBITDA Mg.                           On the same basis
                                   EBITDA Mg.                                    (92)            62.5%                                    65.1%
                                                            186
                                     64.3%
                                                                                                                                                                  +12,2% of 4Q12 Adjusted
                                                                                                     882                   2                  880                     EBITDA on the same
                                                                                                                                                                             basis vs 4Q11
                                        787


                                     4Q11                 Net                 Costs               4Q12                Effect               4Q12
                                    Adjusted            Revenue                                  Adjusted             of New              Adjusted
                                    EBITDA                                                       EBITDA              Business           EBITDA on
                                                                                                                                                    1
                                                                                                                                      the Same Basis
                                                                                                                                                                                        11
1 – Effects of the consolidation of results of the new business added in 2012: International Airports of Quito, San José and Curaçao, Transolímpica and Barcas.
Financial Results Highlight

   Better financial results reflects the drop in Selic rate and...


Net Financial Result (R$ MM)                                       4Q11      4Q12     Chg %      2011      2012    Chg %

Net Financial Result                                              (237.0)   (145.6)   -38.5%   (922.7)   (671.1)   -27.3%
- Income from Hedge Operation                                        5.7       2.4    -58.3%    (17.7)    20.2       n.m.
- Monetary Variation                                                (9.4)     (6.6)   -30.4%    (43.4)    (27.8)   -36.0%
- Exchange Rate Variation                                          (10.9)     (3.4)   -68.4%    (34.3)    (41.3)   20.5%
- Present Value Adjustment of Maintenance Provision                (15.7)     (8.3)   -47.1%    (70.6)    (48.7)   -31.1%
- Interest on Loans, Financing and Debentures                     (218.0)   (129.4)   -40.6%   (870.0)   (592.6)   -31.9%
- Interest and Investment Income                                   37.4      25.2     -32.7%   195.4     124.4     -36.4%
- Others¹                                                          (26.2)    (25.5)    -2.7%    (82.1)   (105.3)   28.2%
¹ Comissions, fees, taxes, fines and interest on taxes


                                    ...an active management of liabilities with attractive refinancing for the company.
                                                                                                                            12
Debt in December 31, 2012
Gross debt by indexer
                                                                               IPCA       IGP-M
                                                                  TJLP         3.2%
                                                                  3.5%                     1.0%
   • Total Gross Debt: R$ 8.2 B
                                                                        USD
   • Net Debt / EBITDA: 2,2X                                           12.3%

   • Increase in USD from 7.4% in 4Q11
   to 12.3% in 4Q12 mainly due to
                                                                                       CDI
   consolidation of new business                                                      80.0%


Amortization Schedule (R$ ‘000)

                2,528

                                                       1,958
                 279           1,426       1,339
                                                        90

                                            85                   559
                 2.047            80                                              386
                                                       1.809
                               1.054       1.187                95
                                                                450               382
                                                                                   -

               2013         2014          2015        2016     2017        2018 a 2026
                                                                                                  13
                                       CDI     USD   Others
Debt

  Increase of leverage indexes…

Net Debt / EBITDA LTM

              2.5
                        2.3                  2.3
                                    2.2                                                                 2.2
                                                          2.1
                                                                                  2.0          1.9
                                                                      1.9

                                                                                                        7,212
                                            6,186         6,152                  6,330         6,344
             5,633                 5,630                              5,8932.5
                     5,565
                                                                                         2.3               2.3
                                                                                                  2.2
                                                                                                                 2.1
                                                                1.9                                                    1.9

                                                    1.6
                                      1.5   1.5


             4Q10    1Q11          2Q11     3Q11          4Q11        1Q12       2Q12          3Q12     4Q12

                              Net Debt (R$ MM)                           Net Debt/EBITDA (x)

                                                  ...due to new business that still don’t have a strong cash flow.
                                                                                                                             14
2012 Realized Investments and Maintenance


                                                                      Performed investments                                     Performed maintenance

                                     Improvements                   Equipments and Others                      Total              Maintenance Cost
      2012 (R$ MM)
                                      4Q12               2012              4Q12                2012         4Q12        2012          4Q12        2012
AutoBAn                                67.4             124.1                 8.7              47.5           76.2     171.6           9.3        83.8
NovaDutra                              92.4             167.6                 5.0              17.6           97.4     185.2          24.6       120.0
ViaOeste                                5.8              25.9                 5.2              25.2           10.9      51.1           2.7        12.3
RodoNorte (100%)                       11.5              22.9                 2.1               6.1           13.6      29.0           4.9        24.0
Ponte                                   3.9               4.5                 0.8               3.2            4.7       7.7           0.5         1.5
ViaLagos                                0.7               1.7                 0.8               1.2            1.5       2.9           2.6         3.6
SPVias                                 14.5              53.8                10.3              18.9           24.8      72.7           6.5        16.2
ViaQuatro (58%)                         0.8               5.5                 0.6               4.2            1.4       9.7           0.0         0.0
Renovias (40%)                          5.0              13.6                 0.0               1.4            5.0      15.0           1.5         8.3
RodoAnel (100%)                        11.1              40.2                 1.4               5.2           12.5      45.4           0.0         0.0
Controlar (45%)                         0.0               0.0                 0.6               0.8            0.6       0.8           0.0         0.0
SAMM                                    6.5              46.0                 4.9              33.9           11.4      79.9           0.0         0.0
Transolímpica1 (33.33%)               -15.5              13.1                 0.2               0.2          -15.4      13.3           0.0         0.0
Airports 2                             27.6               61.7                1.9                2.8         29.5       64.4           0.0           0.0
Barcas                                  0.6                3.4                1.2                1.3          1.8        4.7           0.0           0.0
      3
Other                                   7.3               64.1               20.6              46.4           27.9      110.5           0.0         0.0
Consolidated                         239.6              648.2               64.2             215.8          303.8      863.9          52.5       269.7
1 - Net subvention amounts received from the Granting Authority in the amount of R$ 16.7 million in 4Q12.
2 - Includes Quito, San José and Curaçao.
3 - Includes CCR, CCR España, CCR México, CPCSP, STP and Eliminations.


                                                                                                                                                           15
2013 Estimated Investments and Maintenance


                                                                                  Estimated
                                               Estimated Investments
                                                                                 Maintenance
                                     Construction   Equipaments                  Maintenance
      2013 (E)* - R$ MM                                                 Total
                                        Costs        and Others                     Costs
 AutoBAn                                250.2           27.2            277.3         9.8
 NovaDutra                              235.8           25.3            261.2        60.7
 ViaOeste                                94.8           15.0            109.8        22.7
 RodoNorte (100%)                        86.1           10.8             96.9        29.5
 Ponte                                   13.0           9.4              22.4         3.7
 ViaLagos                                87.0           4.7              91.7         4.2
 SPVias                                 153.5           17.6            171.1        46.2
 ViaQuatro (58%)                        106.3           8.6             114.9         0.0
 Renovias (40%)                          9.2            5.8              15.0         6.3
 RodoAnel (100%)                         39.8           4.8              44.7         0.0
 Controlar (45%)                         0.3            2.7              2.9          0.0
 Samm                                    20.3           42.1             62.4         0.0
 Transolímpica (33,33%)                  60.0           0.0              60.0         0.0
 Aeroportos 1                            52.0           2.4              54.4         0.0
 Barcas                                  17.3           12.9             30.2         0.0
 Outras 2                                0.0            44.2             44.2         0.0
 Consolidated                          1,225.8         233.4           1,459.1      183.2
 * Estimated Values.
 1 - Includes Quito, San José and Curaçao.
 2 - Includes CCR, CPC and STP.


                                                                                               16
Dividends (Cash)

Commitment to pay at least 50% of net income as dividends to shareholders
                     7,0%
                      7,0%                                                                           127%
                                                                                                       127%                          130%
                                                                                                                                        130%

                                                                             92%
                                                                               92% 85% 85%                           90%
                     6,0%
                      6,0%                                                           85% 85%                           90%90%
                                                                                                                            90%
                                                          61%  65%                                                                   80%
                                                                                                                                       80%
                                            58%            61%  65%
                                             58%
                     5,0%
                      5,0%
                                                                                    5,0%
                                                                                      5.0%
                                16%                       4,8%
                                                           4.8%                              4,6% 4,7%                               30%
                                 16%                                                           4.6% 4.7%                               30%
                     4,0%
                      4,0%                     4,2%
                                                4.2%
                                                                   3,8%                                          3,9%
                                                                     3.8% 3,9%
                                                                            3.9%                                    3.9% 3,7%
                                                                                                                            3.7%-20%
                     3,0%                                                                                                          -20%
                      3,0%                                                                                                  1,177


                     2,0%       2,2%                                         Div. Yield               Payout         -70%
                      2,0%       2.2%                                          Div. Yield               Payout127%
                                                                                                           899          -70%
                                                                                                                                               130%
                              7% 11            2
                                                    2
                                                           3
                                                               3
                                                                     4
                                                                         4
                                                                             5
                                                                               5
                                                                                      6
                                                                                        6
                                                                                            7
                                                                                              7
                                                                                                  8
                                                                                                    8
                                                                                                         9
                                                                                                           9
                                                                                                               10
                                                                                                                  10
                                                                                        714
                                                                                        92%   709
                                                                                               85% 67285%               90%
                              6%                                               580
                                                                     547     65%                                                               80%
                                                        58% 500    61%

                                                                                                     5%
                              5%                                   5%
                                                    263                                                          5%         5%
                                      16%
                                     183                                                                                                       30%
                                                          4%
                              4%                                              4%       4%                                              4%

                                                                                                                                               -20%
                              3%2003          2004         2005    2006      2007   2008      2009        2010       2011     2012

                                          2%                       1
                                                        Net Income                  Div. Yield                       Payout
                              2%                                                                                                               -70%   17
1 Considers   the average share price in the1year         2          3         4       5             6           7          8          9
2013 Rules for IFRS 10 and IFRS 11

  In case the IFRS 10 and IFRS 11 rules had been adopted for the preparation of these financial
  statements, the following are the amounts estimated:


                                                          Selected 2012 data with        Selected 2012 data estimated using the
       2012 - (R$ '000)                                  proportional consolidation        criteria of consolidation by Equity
                                                              (current criteria)                         Income

       Total assets                                                14,305,826                          12,502,803
       Total liabilities                                           10,943,494                          9,140,474
       Adjusted EBITDA                                              3,271,783                          3,117,428

       IFRS 10 - Consolidated Financial Statements: New definition and additional control guidelines.

       IFRS 11 - Jointly Controlled: jointly controlled companies shall be classified as joint ventures and will be
       registered using the equity accounting method.


      Which companies will be consolidated by the equity accounted method as from 2013:
      Renovias, STP, Airports, ViaQuatro, Controlar and Transolímpica.


                                                             Net income for the period and net equity would not have been affected.
                                                                                                                                  18
1 International   Airports of Quito, San José and Curaçao.
Track Record

CCR Track Record: diversification and new bids


              Milestone           Concession Awarded                 Acquisition           Concession Extension


                                                                                                                 IPO
                                                                                                    STP
                                                                                                                (2002)
                               AutoBAn +                                         Follow-on         (2003)
                                                                 ViaOeste       (April 2004)
                                ViaOeste        RodoNorte      (October 2004)
                              Concession          (2005)
              ViaQuatro
                            Extension (2006)
                (2006)

     USA
    (2007)                                                                 Via Lagos
                                                                          Concession
   RenoVias                                                             Extension (2011)
    (2008)
              RodoAnel                                                                                  2012:
               (2008)                                SP VIAS                                   • Airports: Quito, San
                          Controlar                   (2010)
                           (2009)
                                                                                                 José and Curaçao
                                                                                                     • Barcas
                                         Follow-on
                                           (2009)                                                • Transolímpica


                                                                                                                         19
Thank you


            20

More Related Content

Presentation 4Q12

  • 1. Earnings Results 4Q12 and the year of 2012
  • 2. Disclaimer This presentation may contain certain forward-looking projections and trends that neither represent realized financial results nor historical information. These forward-looking projections and trends are subject to risk and uncertainty, and future results may differ materially from the projections. Many of these risks and uncertainties are related to factors that are beyond CCR’s ability to control or to estimate, such as market conditions, currency swings, the behavior of other market participants, the actions of regulatory agencies, the ability of the company to continue to obtain financing, changes in the political and social context in which CCR operates or economic trends or conditions, including changes in the rate of inflation and changes in consumer confidence on a global, national or regional scale. Readers are advised not to fully trust these projections and trends. CCR is not obliged to publish any revision of these projections and trends that should reflect new events or circumstances after the realization of this presentation. 2
  • 3. Agenda Highlights Results Analysis Perspectives 3
  • 4. 4Q12 Highlights NET REVENUE: Growth of 15.2% compared to 4Q11. EBITDA: Expansion of 12.0% of Adjusted EBITDA1, reaching R$ 881.8 million. NET INCOME: Amounted to R$ 347.5 million (+17,9%), due to higher cash generation and lower financial expenses. TOLLS COLLECTED BY ELECTRONIC MEANS: The toll charges collected by this means accounted for 66.7% of the total toll revenue and the number of STP users expanded 16.2% compared to December 2011, reaching 3,770 thousand active tags. 1 Calculation including the non-cash expenses: depreciation and amortization, provision for maintenance and allocation of anticipated concession grant expenses. 4
  • 5. Subsequent Event  On February 19, 2013 the company reported to its shareholders and the market in general that on that date, together with its partners in the Quiport concessionaire: AECON, Airport Development Corporation (ADC) and HAS Development Corporation (HAS-DC), it had inaugurated the new International Airport of Quito, Ecuador.  CCR’s Management proposed a supplemental dividends distribution to its shareholders referring to the fiscal year of 2012, in the amount of R$ 0.0570773 per share, totaling R$ 100,775 thousand, amount to be submitted for approval at the General Shareholders Meeting (GSM) scheduled for April 18, 2013. Considering the intermediate dividends paid on October 31, 2012, in the amount of R$ 953,417 thousand, representing R$ 0.54 per share, will result in a payout for the fiscal year of 2012 of 89.54%. 5
  • 6. Earnings Highlights Net Income expansion of 17.9% despite the temporary contraction of Adjusted EBITDA Mg... Financial Indicators (R$ MM) 4Q11 4Q12 Chg % 2011 2012 Chg % Net Revenues 1 1,225.4 1,411.9 15.2% 4,577.6 5,196.7 13.5% EBIT 659.6 679.7 3.0% 2,277.0 2,497.4 9.7% 2 Adjusted EBIT Mg. 53.8% 48.1% -5.7 p.p. 49.7% 48.1% -1.6 p.p. 3 EBIT on the same basis 659.6 688.1 4.3% 2,277.0 2,514.9 10.4% 3 EBITD Mg. on the same basis 53.8% 50.9% -2.9 p.p. 49.7% 49.5% -0.2 p.p. Adjusted EBITDA 4 787.5 881.8 12.0% 2,933.8 3,271.8 11.5% Adjusted EBITDA Mg. 64.3% 62.5% -1.8 p.p. 64.1% 63.0% -1.1 p.p. 3 Adjusted EBITDA on the same basis 787.5 879.8 11.7% 2,933.8 3,267.4 11.4% 3 Adjusted EBITDA Mg. on the same basis 64.3% 65.1% +0.8 p.p. 64.1% 64.3% +0.2 p.p. Net Income 294.7 347.5 17.9% 899.4 1,177.3 30.9% 1 Net Operational Revenues excludes Construction Revenues. ² The adjusted EBIT margin was calculated by dividing the EBIT by net revenues, excluding construction revenues, because this is an IFRS requirement, whose counterpart in the same amount impacts total costs. ³ Adjustment excluding additional business in 2012: the international airports of Quito, San José and Curaçao, Transolímpica and Barcas, which still have not yet reached maturity. 4 Adjusted EBITDA was calculated by the sum of net revenues and construction revenues, cost of provided services, administrative expenses, depreciation and amortization, maintenance provision and settlement of prepaid expenses. ...due to new business addition in the initial phase . 6
  • 7. CVM 527 Instruction – EBITDA standardizing 1,667 987 Concession IFRS Fee 32 882 2 880 150 830 21 4Q12 Total Depreciation 4Q12 Prepaid Maintenance 4Q12 Effect of 4Q12 Net Revenue Costs and CVM Expenses Provision Adjusted New Adjusted and Amortization EBITDA1 EBITDA Business 2 EBITDA on Construction the same Revenue Basis 2 1 Calculation performed according to CVM 527/2012 Instruction. ² Adjustment excluding business added in 2012: International Airports of Quito, San José and Curaçao, Transolímpica and Barcas, which have not reached maturity yet. 7
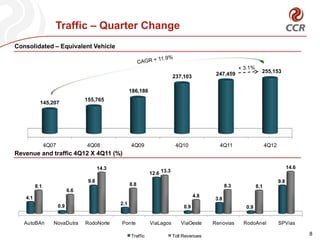
  • 8. Traffic – Quarter Change Consolidated – Equivalent Vehicle 247,459 255,153 237,103 186,186 155,765 145,207 4Q07 4Q08 4Q09 4Q10 4Q11 4Q12 Revenue and traffic 4Q12 X 4Q11 (%) 14.3 14.6 12.6 13.3 9.8 9.8 8.1 8.8 8.3 8.1 6.6 4.1 4.8 3.8 0.9 2.1 0.9 0.9 AutoBAn NovaDutra RodoNorte Ponte ViaLagos ViaOeste Renovias RodoAnel SPVias Traffic Toll Revenues 8
  • 9. Revenue Analysis Gross Operating Revenues Revenue Breakdown Aeroportos ViaLagos Renovias Controlar 7% 8% 13% 2.2% 1.7% 1.5% 7% 1.2% Barcas Others 2.3% 0.1% Ponte 2.6% ViaQuatro 2.8% AutoBAn RodoAnel 29,0% 93% 93% 92% 87% 3.2% SPVias 8.2% STP 3.5% RodoNorte NovaDutra 9.0% 18.9% ViaOeste 4Q09 4Q10 4Q11 4Q12 13.8% Toll Others Revenue Indexer Payment IGPM 3% 42% 40% 35% 33% 58% 60% 65% 67% IPCA 97% 4Q09 4Q10 4Q11 4Q12 9 Electronic Cash
  • 10. Costs Evolution (4Q12 X 4Q11) Total Costs (R$ MM) 27% 39% n.m. 76% 25 987 (108) 34 23% 110 32% 18% 2% 879 37% 37 28 2 40 711 4Q11 Depreciation Third-party Granting Personnel Construction Maintenance Other 4Q12 Ex New 4Q12 1 and Services Power and Costs Costs Provision Costs Business Ex New 1 Amortization Advanced Business Expenses Maintenance New Business, New Business Projects and Bargaining and Construction of Consulting Agreement and Review of Construction New Business Service Roads Services SPVias Maintenance Cicle Works 1 – Effects of the consolidation of results of the new business added in 2012: International Airports of Quito, San José and Curaçao, Transolímpica and Barcas. 10
  • 11. Revenue and EBITDA evolution (R$ MM) Net Revenue Ex Construction Revenue 126 1,412 60 +10,3% of 4Q12 Adjusted 1,351 Net Revenue vs 4Q11 60 1,225 4Q11 Effect 4Q11 4Q12 Effect 4Q12 Net of New Portfolio Net of New Adjusted EBITDA Revenue Business Addition Revenue Business Net Revenue Adjusted Adjusted EBITDA Mg. EBITDA Mg. On the same basis EBITDA Mg. (92) 62.5% 65.1% 186 64.3% +12,2% of 4Q12 Adjusted 882 2 880 EBITDA on the same basis vs 4Q11 787 4Q11 Net Costs 4Q12 Effect 4Q12 Adjusted Revenue Adjusted of New Adjusted EBITDA EBITDA Business EBITDA on 1 the Same Basis 11 1 – Effects of the consolidation of results of the new business added in 2012: International Airports of Quito, San José and Curaçao, Transolímpica and Barcas.
  • 12. Financial Results Highlight Better financial results reflects the drop in Selic rate and... Net Financial Result (R$ MM) 4Q11 4Q12 Chg % 2011 2012 Chg % Net Financial Result (237.0) (145.6) -38.5% (922.7) (671.1) -27.3% - Income from Hedge Operation 5.7 2.4 -58.3% (17.7) 20.2 n.m. - Monetary Variation (9.4) (6.6) -30.4% (43.4) (27.8) -36.0% - Exchange Rate Variation (10.9) (3.4) -68.4% (34.3) (41.3) 20.5% - Present Value Adjustment of Maintenance Provision (15.7) (8.3) -47.1% (70.6) (48.7) -31.1% - Interest on Loans, Financing and Debentures (218.0) (129.4) -40.6% (870.0) (592.6) -31.9% - Interest and Investment Income 37.4 25.2 -32.7% 195.4 124.4 -36.4% - Others¹ (26.2) (25.5) -2.7% (82.1) (105.3) 28.2% ¹ Comissions, fees, taxes, fines and interest on taxes ...an active management of liabilities with attractive refinancing for the company. 12
  • 13. Debt in December 31, 2012 Gross debt by indexer IPCA IGP-M TJLP 3.2% 3.5% 1.0% • Total Gross Debt: R$ 8.2 B USD • Net Debt / EBITDA: 2,2X 12.3% • Increase in USD from 7.4% in 4Q11 to 12.3% in 4Q12 mainly due to CDI consolidation of new business 80.0% Amortization Schedule (R$ ‘000) 2,528 1,958 279 1,426 1,339 90 85 559 2.047 80 386 1.809 1.054 1.187 95 450 382 - 2013 2014 2015 2016 2017 2018 a 2026 13 CDI USD Others
  • 14. Debt Increase of leverage indexes… Net Debt / EBITDA LTM 2.5 2.3 2.3 2.2 2.2 2.1 2.0 1.9 1.9 7,212 6,186 6,152 6,330 6,344 5,633 5,630 5,8932.5 5,565 2.3 2.3 2.2 2.1 1.9 1.9 1.6 1.5 1.5 4Q10 1Q11 2Q11 3Q11 4Q11 1Q12 2Q12 3Q12 4Q12 Net Debt (R$ MM) Net Debt/EBITDA (x) ...due to new business that still don’t have a strong cash flow. 14
  • 15. 2012 Realized Investments and Maintenance Performed investments Performed maintenance Improvements Equipments and Others Total Maintenance Cost 2012 (R$ MM) 4Q12 2012 4Q12 2012 4Q12 2012 4Q12 2012 AutoBAn 67.4 124.1 8.7 47.5 76.2 171.6 9.3 83.8 NovaDutra 92.4 167.6 5.0 17.6 97.4 185.2 24.6 120.0 ViaOeste 5.8 25.9 5.2 25.2 10.9 51.1 2.7 12.3 RodoNorte (100%) 11.5 22.9 2.1 6.1 13.6 29.0 4.9 24.0 Ponte 3.9 4.5 0.8 3.2 4.7 7.7 0.5 1.5 ViaLagos 0.7 1.7 0.8 1.2 1.5 2.9 2.6 3.6 SPVias 14.5 53.8 10.3 18.9 24.8 72.7 6.5 16.2 ViaQuatro (58%) 0.8 5.5 0.6 4.2 1.4 9.7 0.0 0.0 Renovias (40%) 5.0 13.6 0.0 1.4 5.0 15.0 1.5 8.3 RodoAnel (100%) 11.1 40.2 1.4 5.2 12.5 45.4 0.0 0.0 Controlar (45%) 0.0 0.0 0.6 0.8 0.6 0.8 0.0 0.0 SAMM 6.5 46.0 4.9 33.9 11.4 79.9 0.0 0.0 Transolímpica1 (33.33%) -15.5 13.1 0.2 0.2 -15.4 13.3 0.0 0.0 Airports 2 27.6 61.7 1.9 2.8 29.5 64.4 0.0 0.0 Barcas 0.6 3.4 1.2 1.3 1.8 4.7 0.0 0.0 3 Other 7.3 64.1 20.6 46.4 27.9 110.5 0.0 0.0 Consolidated 239.6 648.2 64.2 215.8 303.8 863.9 52.5 269.7 1 - Net subvention amounts received from the Granting Authority in the amount of R$ 16.7 million in 4Q12. 2 - Includes Quito, San José and Curaçao. 3 - Includes CCR, CCR España, CCR México, CPCSP, STP and Eliminations. 15
  • 16. 2013 Estimated Investments and Maintenance Estimated Estimated Investments Maintenance Construction Equipaments Maintenance 2013 (E)* - R$ MM Total Costs and Others Costs AutoBAn 250.2 27.2 277.3 9.8 NovaDutra 235.8 25.3 261.2 60.7 ViaOeste 94.8 15.0 109.8 22.7 RodoNorte (100%) 86.1 10.8 96.9 29.5 Ponte 13.0 9.4 22.4 3.7 ViaLagos 87.0 4.7 91.7 4.2 SPVias 153.5 17.6 171.1 46.2 ViaQuatro (58%) 106.3 8.6 114.9 0.0 Renovias (40%) 9.2 5.8 15.0 6.3 RodoAnel (100%) 39.8 4.8 44.7 0.0 Controlar (45%) 0.3 2.7 2.9 0.0 Samm 20.3 42.1 62.4 0.0 Transolímpica (33,33%) 60.0 0.0 60.0 0.0 Aeroportos 1 52.0 2.4 54.4 0.0 Barcas 17.3 12.9 30.2 0.0 Outras 2 0.0 44.2 44.2 0.0 Consolidated 1,225.8 233.4 1,459.1 183.2 * Estimated Values. 1 - Includes Quito, San José and Curaçao. 2 - Includes CCR, CPC and STP. 16
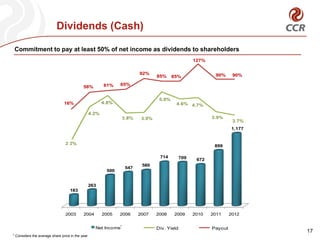
  • 17. Dividends (Cash) Commitment to pay at least 50% of net income as dividends to shareholders 7,0% 7,0% 127% 127% 130% 130% 92% 92% 85% 85% 90% 6,0% 6,0% 85% 85% 90%90% 90% 61% 65% 80% 80% 58% 61% 65% 58% 5,0% 5,0% 5,0% 5.0% 16% 4,8% 4.8% 4,6% 4,7% 30% 16% 4.6% 4.7% 30% 4,0% 4,0% 4,2% 4.2% 3,8% 3,9% 3.8% 3,9% 3.9% 3.9% 3,7% 3.7%-20% 3,0% -20% 3,0% 1,177 2,0% 2,2% Div. Yield Payout -70% 2,0% 2.2% Div. Yield Payout127% 899 -70% 130% 7% 11 2 2 3 3 4 4 5 5 6 6 7 7 8 8 9 9 10 10 714 92% 709 85% 67285% 90% 6% 580 547 65% 80% 58% 500 61% 5% 5% 5% 263 5% 5% 16% 183 30% 4% 4% 4% 4% 4% -20% 3%2003 2004 2005 2006 2007 2008 2009 2010 2011 2012 2% 1 Net Income Div. Yield Payout 2% -70% 17 1 Considers the average share price in the1year 2 3 4 5 6 7 8 9
  • 18. 2013 Rules for IFRS 10 and IFRS 11 In case the IFRS 10 and IFRS 11 rules had been adopted for the preparation of these financial statements, the following are the amounts estimated: Selected 2012 data with Selected 2012 data estimated using the 2012 - (R$ '000) proportional consolidation criteria of consolidation by Equity (current criteria) Income Total assets 14,305,826 12,502,803 Total liabilities 10,943,494 9,140,474 Adjusted EBITDA 3,271,783 3,117,428 IFRS 10 - Consolidated Financial Statements: New definition and additional control guidelines. IFRS 11 - Jointly Controlled: jointly controlled companies shall be classified as joint ventures and will be registered using the equity accounting method. Which companies will be consolidated by the equity accounted method as from 2013: Renovias, STP, Airports, ViaQuatro, Controlar and Transolímpica. Net income for the period and net equity would not have been affected. 18 1 International Airports of Quito, San José and Curaçao.
  • 19. Track Record CCR Track Record: diversification and new bids Milestone Concession Awarded Acquisition Concession Extension IPO STP (2002) AutoBAn + Follow-on (2003) ViaOeste (April 2004) ViaOeste RodoNorte (October 2004) Concession (2005) ViaQuatro Extension (2006) (2006) USA (2007) Via Lagos Concession RenoVias Extension (2011) (2008) RodoAnel 2012: (2008) SP VIAS • Airports: Quito, San Controlar (2010) (2009) José and Curaçao • Barcas Follow-on (2009) • Transolímpica 19
  • 20. Thank you 20